2025 VARA Price Prediction: Expert Analysis and Market Forecast for the Next Bull Run


Introduction: VARA's Market Position and Investment Value
VARA (Vara Network) stands at the forefront of Web3 evolution, providing developers with an innovative environment for building decentralized applications (dApps). Since its launch in September 2023, VARA has established itself as a unique platform by combining the Actor Model and Persistent Memory within its architecture. As of December 2025, VARA's market cap has reached approximately $4.46 million, with a circulating supply of around 4.53 billion tokens and a current price hovering near $0.000984. This innovative asset is increasingly playing a vital role in reshaping blockchain infrastructure for next-generation dApp development.
This article will provide a comprehensive analysis of VARA's price trajectory from 2025 to 2030, integrating historical price patterns, market supply and demand dynamics, ecosystem development, and macroeconomic factors to deliver professional price forecasts and practical investment strategies for discerning investors.
I. VARA Price Historical Review and Current Market Status
VARA Historical Price Movement Trajectory
- January 2024: VARA reached its all-time high of $0.2 on January 17, 2024, marking a significant peak in the token's trading history.
- 2025: The token experienced substantial decline throughout the year, with a one-year price change of -95.33%, reflecting significant downward pressure in the market.
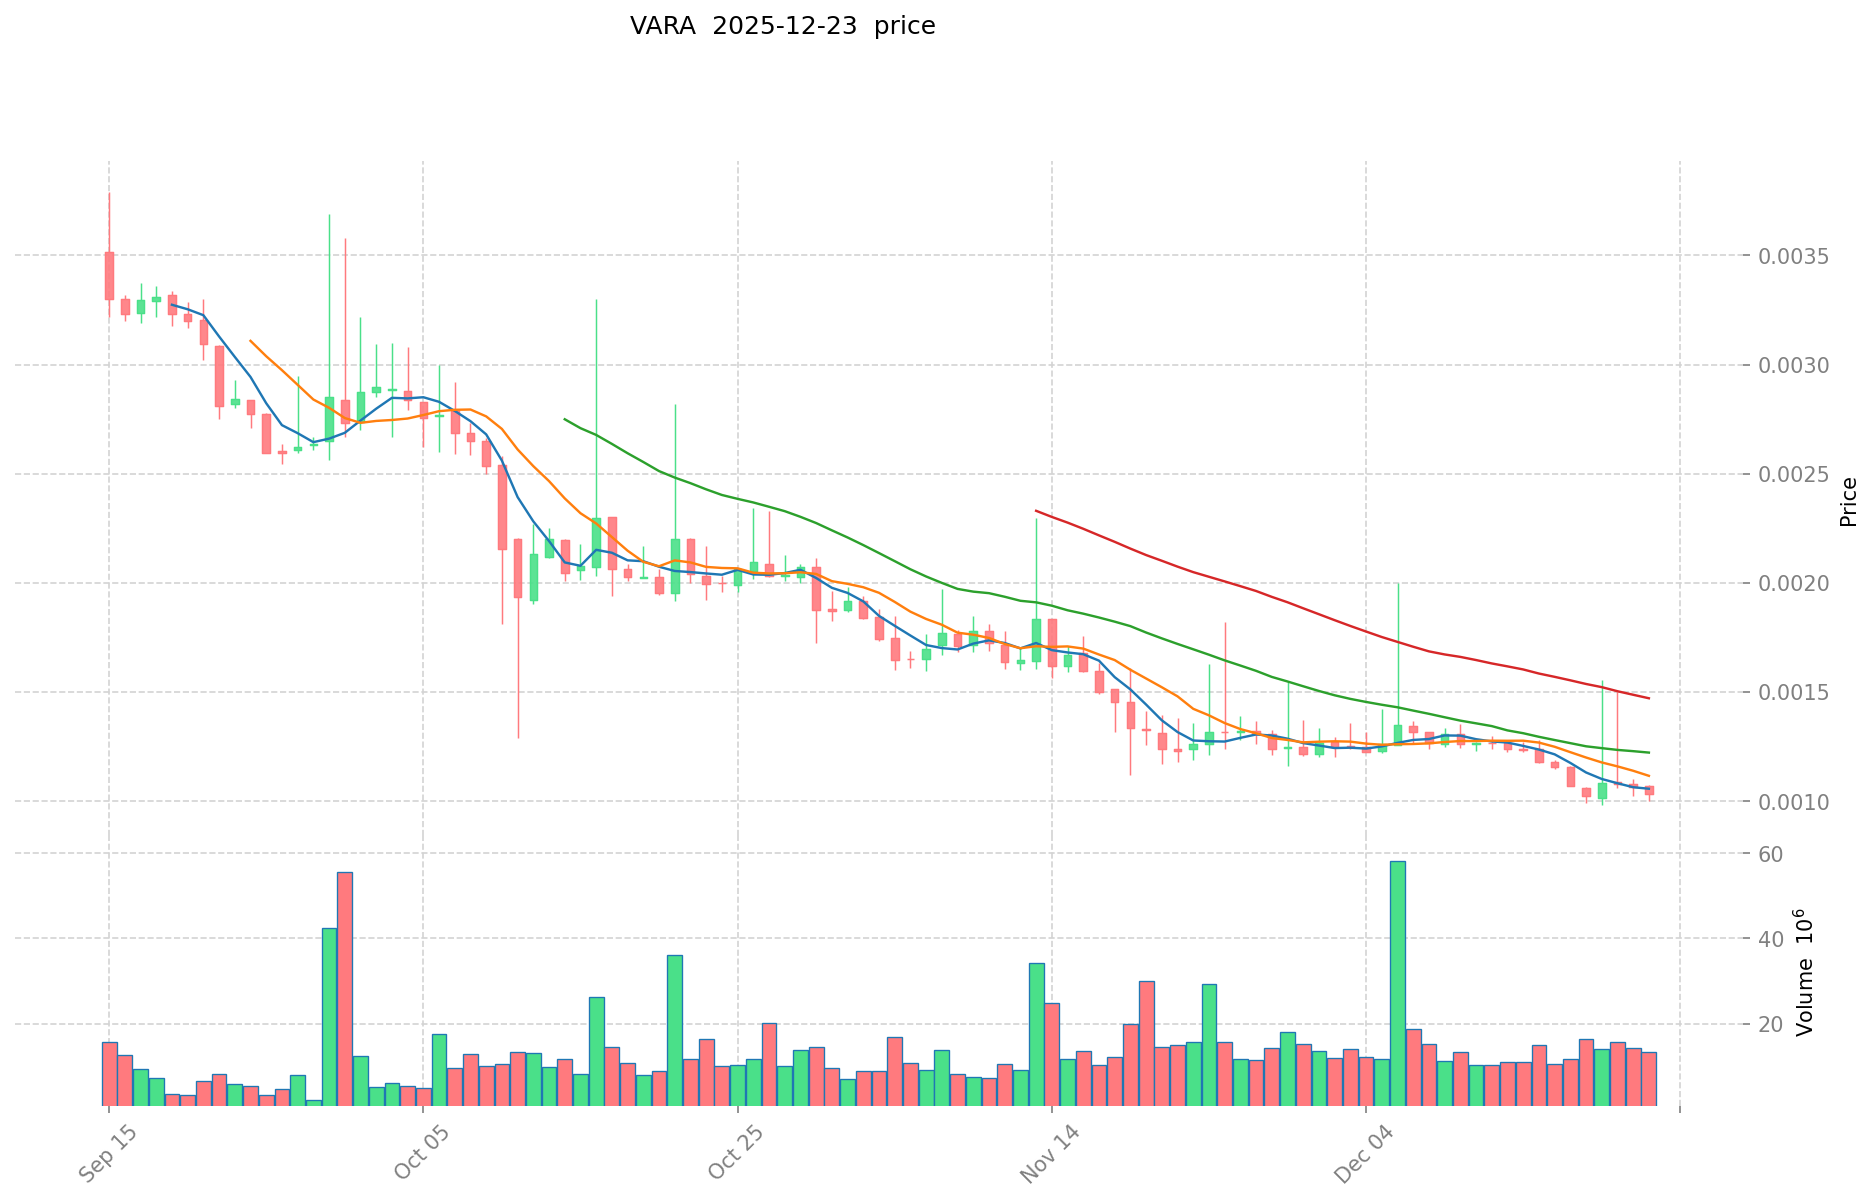
- December 2025: VARA reached a new all-time low of $0.00091 on December 23, 2025, representing the lowest price point since the token's launch.
VARA Current Market Status
As of December 24, 2025, VARA is trading at $0.000984, down 2.47% over the past 24 hours. The token shows further weakness with a 1-hour decline of -0.80% and a 7-day decline of -15.52%. Over the longer term, the 30-day performance reflects a -20.82% decrease.
VARA's market capitalization stands at approximately $4.46 million, with a fully diluted valuation of $9.84 million. The circulating supply comprises 4.53 billion tokens out of a total supply of 10 billion tokens, representing 45.35% circulation. The 24-hour trading volume is $14,255.60, indicating relatively modest liquidity levels. The token ranks 1601 in overall market capitalization, with a market dominance of 0.00030%.
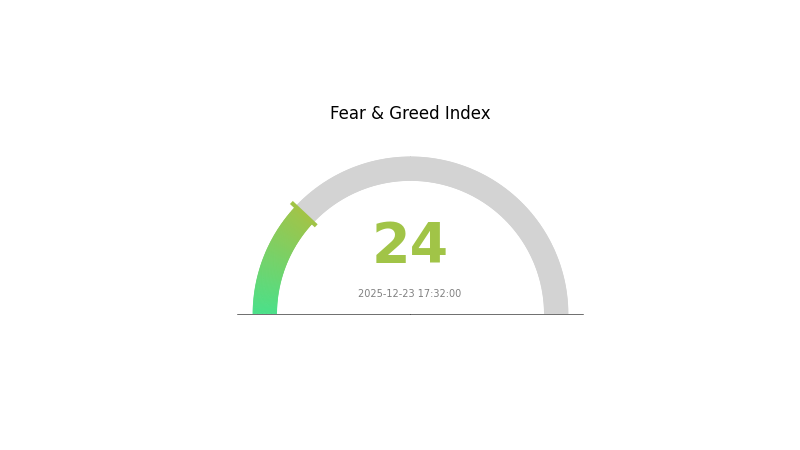
Current market sentiment indicators suggest extreme fear, with a market fear and greed index reading of 24, reflecting widespread bearish sentiment in the broader cryptocurrency market.
Click to view current VARA market price
VARA Market Sentiment Index
2025-12-23 Fear and Greed Index: 24 (Extreme Fear)
Click to view current Fear & Greed Index
The VARA market is currently experiencing extreme fear with an index reading of 24. This exceptionally low sentiment indicates heightened market anxiety and pessimism among investors. During periods of extreme fear, opportunities often emerge for contrarian traders, as assets may become oversold. However, caution remains essential as market volatility typically increases in such conditions. Investors should carefully assess their risk tolerance and consider dollar-cost averaging strategies rather than making large lump-sum investments. Monitoring market fundamentals and maintaining a diversified portfolio on platforms like Gate.com can help navigate these uncertain times effectively.
VARA Holdings Distribution
The address holdings distribution chart illustrates the concentration of VARA tokens across different wallet addresses, serving as a critical metric for assessing token decentralization and market structure. By analyzing the proportional allocation of tokens held by top addresses, this distribution map reveals potential concentration risks, market power dynamics, and the overall health of token circulation within the ecosystem.
Currently, the VARA token distribution data shows limited visibility due to incomplete holding information in the provided dataset. However, when evaluating token concentration patterns, it is essential to examine whether top holders possess disproportionate influence over the token supply. A highly concentrated distribution—where a small number of addresses control a significant percentage of tokens—typically indicates elevated centralization risk and increased vulnerability to coordinated selling pressure or price manipulation. Conversely, a more dispersed distribution suggests stronger decentralization characteristics and reduced systemic risk from individual holder actions.
The current address distribution structure reflects VARA's market maturity and investor composition. Monitoring the evolution of this concentration metric over time provides valuable insights into token unlock schedules, exchange inflows and outflows, and organic adoption growth. A healthy token ecosystem typically demonstrates gradual distribution improvements as the project progresses through development phases and gains wider market participation. The ongoing tracking of holdings concentration remains instrumental for stakeholders seeking to assess VARA's long-term sustainability and resistance to price volatility driven by whale activity.
Click to view current VARA Holdings Distribution

| Top | Address | Holding Qty | Holding (%) |
|---|
II. Core Factors Influencing VARA's Future Price
Market Sentiment and Adoption
-
Investment Confidence: Investor sentiment and confidence directly impact VARA price movements. Positive market news regarding widespread VARA adoption or major technological breakthroughs can significantly influence price trends.
-
Adoption Rates: The future price trend of VARA is substantially influenced by adoption rates. Increased adoption of Vara Network across various use cases strengthens investment confidence and supports long-term price appreciation.
Macroeconomic Environment
- Monetary Policy Impact: Macroeconomic factors play significant roles in determining VARA's price direction. Changes in global monetary policies and central bank decisions can affect cryptocurrency market sentiment and investment flows into digital assets.
Technology Development and Ecosystem Building
- Technological Advancements: Future price movements of VARA are influenced by continuous technological improvements and innovations within the Vara Network ecosystem. Major technical breakthroughs can serve as catalysts for positive price momentum.
Note: The provided source materials contain limited specific information about VARA's supply mechanisms, institutional holdings, enterprise adoption details, and specific technological upgrades. Therefore, only sections with verifiable information have been included in this analysis.
III. 2025-2030 VARA Price Forecast
2025 Outlook
- Conservative Forecast: $0.00065 - $0.00098
- Neutral Forecast: $0.00098
- Optimistic Forecast: $0.00104 (requiring sustained ecosystem development and increased adoption)
2026-2027 Mid-term Outlook
- Market Stage Expectation: Consolidation phase with gradual accumulation as network maturity progresses
- Price Range Predictions:
- 2026: $0.00054 - $0.0013
- 2027: $0.00066 - $0.00131
- Key Catalysts: Platform functionality enhancements, ecosystem expansion, strategic partnerships, and growing institutional interest in emerging blockchain infrastructure
2028-2030 Long-term Outlook
- Base Case Scenario: $0.00119 - $0.00180 (assuming steady technological advancement and moderate market adoption)
- Optimistic Scenario: $0.00157 - $0.00164 (assuming accelerated ecosystem growth and significant mainstream recognition)
- Transformative Scenario: $0.00164+ (under conditions of breakthrough technological innovations, widespread enterprise adoption, and favorable regulatory environment)
- Performance Trajectory: VARA exhibits a cumulative appreciation of approximately 56% from 2025 to 2030, indicating moderate long-term value growth potential
Note: All price forecasts are subject to market volatility and external variables. Users are advised to conduct thorough due diligence and consider their risk tolerance before trading on platforms such as Gate.com.
| 年份 | 预测最高价 | 预测平均价格 | 预测最低价 | 涨跌幅 |
|---|---|---|---|---|
| 2025 | 0.00104 | 0.00098 | 0.00065 | 0 |
| 2026 | 0.0013 | 0.00101 | 0.00054 | 2 |
| 2027 | 0.00131 | 0.00116 | 0.00066 | 17 |
| 2028 | 0.0018 | 0.00123 | 0.00119 | 24 |
| 2029 | 0.00157 | 0.00151 | 0.001 | 53 |
| 2030 | 0.00164 | 0.00154 | 0.0008 | 56 |
VARA Investment Strategy and Risk Management Report
IV. VARA Professional Investment Strategy and Risk Management
VARA Investment Methodology
(1) Long-term Holding Strategy
- Target Audience: Developers and institutional investors committed to Web3 infrastructure, early adopters of decentralized application ecosystems, and investors with high risk tolerance seeking exposure to emerging blockchain technologies
- Operational Recommendations:
- Accumulate VARA during market downturns, particularly when the token trades significantly below the all-time high of $0.2
- Hold through network development milestones and ecosystem expansion phases
- Monitor quarterly updates from Vara Network development team regarding dApp launches and technical improvements
(2) Active Trading Strategy
- Technical Analysis Tools:
- Support and Resistance Levels: Utilize the historical price range ($0.00091 to $0.2) to identify key trading zones
- Volume Analysis: Monitor the 24-hour trading volume ($14,255.60) relative to historical averages to confirm price movements
- Wave Trading Key Points:
- Execute buy orders near the 52-week low during periods of increased developer activity announcements
- Establish sell targets at resistance levels, considering the token's -2.47% 24-hour decline trend
VARA Risk Management Framework
(1) Asset Allocation Principles
- Conservative Investors: 1-2% of total portfolio allocation
- Active Investors: 2-5% of total portfolio allocation
- Professional Investors: 5-10% of total portfolio allocation, with position averaging strategies
(2) Risk Hedging Solutions
- Portfolio Diversification: Balance VARA exposure with stablecoin holdings or other established blockchain assets to mitigate volatility
- Position Sizing: Implement strict stop-loss orders at 15-20% below entry points to limit downside exposure
(3) Secure Storage Solutions
- Hot wallet Solution: Gate.com Web3 Wallet for active trading and frequent transactions, offering convenient access while maintaining reasonable security standards
- Cold Storage Approach: Transfer long-term holdings to hardware wallets or offline storage solutions for maximum security
- Security Considerations: Enable two-factor authentication on all exchange accounts, never share private keys, regularly verify contract addresses before token transfers, and maintain backup copies of wallet recovery phrases in secure locations
V. VARA Potential Risks and Challenges
VARA Market Risks
- Extreme Price Volatility: VARA has experienced a -95.33% decline over the past year and -20.82% over 30 days, indicating severe market fluctuations that can result in substantial capital losses
- Low Trading Liquidity: With only $14,255.60 in 24-hour volume and a market capitalization of $4.46 million (ranked #1601), the token faces limited liquidity that may impact entry and exit points
- Market Sentiment Deterioration: The token recently hit a new all-time low on December 23, 2025, suggesting potential loss of investor confidence and continued downward pressure
VARA Regulatory Risks
- Cryptocurrency Regulatory Uncertainty: Evolving global regulations regarding decentralized applications and blockchain infrastructure could impact Vara Network's operational status and token utility
- Compliance Requirements: Future regulatory frameworks may impose stringent requirements on dApp platforms, potentially affecting network functionality and token value
- Jurisdiction-Specific Restrictions: Different regulatory approaches across jurisdictions could limit Vara Network's reach and adoption potential
VARA Technical Risks
- Execution Risk on Actor Model Implementation: The Actor Model and Persistent Memory architecture represent novel approaches that may encounter unforeseen technical challenges during scaling
- Competition from Established Platforms: Other Web3 platforms with larger developer bases and more mature ecosystems may outcompete Vara Network for dApp development mindshare
- Network Security Vulnerabilities: As a relatively newer platform, potential security flaws in the protocol or smart contract execution environment could expose users to asset loss
VI. Conclusions and Action Recommendations
VARA Investment Value Assessment
Vara Network presents a specialized investment opportunity targeting developers seeking innovative dApp infrastructure based on the Actor Model and Persistent Memory architecture. However, the token faces significant headwinds reflected in its -95.33% annual decline, recent all-time low, and limited market capitalization of $9.84 million (fully diluted). The project's technical merits must be weighed against severe market skepticism, minimal trading liquidity, and the highly speculative nature of early-stage blockchain infrastructure protocols. Current market conditions suggest investors should approach VARA with extreme caution and only commit capital they can afford to lose entirely.
VARA Investment Recommendations
✅ Beginners: Avoid direct VARA purchases until the project demonstrates significant ecosystem traction and developer adoption. If interested in exposure, limit allocation to 0.5% of portfolio as a speculative position only after thorough research.
✅ Experienced Investors: Monitor Vara Network's quarterly progress on dApp launches, developer adoption metrics, and technical implementations. Consider small position accumulation only if fundamentals improve substantially and market sentiment stabilizes.
✅ Institutional Investors: Conduct comprehensive due diligence on the project team's execution capabilities, competitive positioning versus established platforms, and the market demand for Actor Model-based architecture. Participation should align with broader Web3 infrastructure investment thesis only.
VARA Trading Participation Methods
- Gate.com Exchange Trading: Direct spot trading of VARA tokens available on Gate.com for users seeking liquid entry and exit points
- Ecosystem Participation: Monitor Vara Network's official channels for dApp development opportunities or testing programs that may provide early access to platform functionality
- Long-term Accumulation: Dollar-cost averaging small amounts during extended bear market conditions if maintaining a strategic long-term position
Cryptocurrency investment carries extreme risk. This report does not constitute investment advice. Investors must make decisions based on their individual risk tolerance and financial situation. Always consult with a qualified financial advisor before making investment decisions. Never invest more capital than you can afford to lose completely.
FAQ
Does Vara Network have a future?
Yes, Vara Network shows promising potential for future growth. With anticipated price targets reaching $0.00099793 by 2028 and strong development momentum, the network is positioned for significant expansion in the Web3 ecosystem.
How high can Vara go?
Vara can reach approximately $0.0475 per coin in 2025, representing a potential 158% increase. Long-term, VARA has significant upside potential as the network expands and adoption grows. Price targets depend on market conditions, ecosystem development, and overall crypto market performance.
What crypto will 1000x prediction?
DeepSnitch AI is predicted to achieve 1000x returns by 2026. It uses AI agents to identify high-potential cryptocurrencies in the market. With its innovative technology and early-stage presale valuation, DSNT stands out among emerging projects for significant growth potential.
Share
Content
Introduction: VARA's Market Position and Investment Value
I. VARA Price Historical Review and Current Market Status
II. Core Factors Influencing VARA's Future Price
III. 2025-2030 VARA Price Forecast
IV. VARA Professional Investment Strategy and Risk Management
V. VARA Potential Risks and Challenges
VI. Conclusions and Action Recommendations
FAQ
How to Buy Cryptocurrency


Trending Cryptocurrencies


Will Crypto Recover in 2025?

Jasmy Coin and bull run

2025 XLM Price Prediction: Stellar Lumens' Potential Growth Trajectory in a Maturing Crypto Ecosystem
2025 XCNPrice Prediction: Will XCN Token Reach New Heights in the Post-Halving Bull Market?

2025 VRA Price Prediction: Analyzing Market Trends and Future Potential for Virtual Reality Assets

2025 1INCH Price Prediction: Will This DeFi Protocol Token Reach New Heights in the Decentralized Exchange Market?
Bitcoin Price Forecast: Prospects Beyond 2025

Understanding Web 3.0: The Next Phase of Decentralized Internet Evolution

2024 Meme Coin Price Prediction: STARS Skyrockets with New Listings

Presale Success: Crypto All-Stars Raises $4 Million with Promising Tokenomics

Understanding Centralized Cryptocurrency Exchanges: A Comprehensive Guide