2025 ZND Price Prediction: Expert Analysis and Market Forecast for the Coming Year

Introduction: ZND's Market Position and Investment Value
ZND (ZND) is a fully regulated financial ecosystem integrating multiple platforms for diverse user needs, built upon zondacrypto, a leading Central European cryptocurrency exchange since 2014. As of December 2025, ZND's market capitalization has reached approximately $5.64 million, with a circulating supply of around 203.5 million tokens, currently trading at $0.02771 per token. This innovative asset, designed to simplify access to the crypto market for both beginners and experienced users, is playing an increasingly critical role in enabling seamless trading, earning, borrowing, and exploration within its ecosystem.
This article will comprehensively analyze ZND's price trends from 2025 through 2030, combining historical patterns, market supply and demand dynamics, ecosystem development, and macroeconomic factors to provide investors with professional price forecasts and practical investment strategies.
ZND Token Market Analysis Report
I. ZND Price History Review and Current Market Status
ZND Historical Price Evolution
- December 2023: ZND Platform launched, marking the beginning of the token's market journey with an initial price of $0.31.
- March 2025: ZND reached its all-time high (ATH) of $0.55, representing a significant appreciation from its launch price.
- December 2025: ZND experienced substantial decline, falling to an all-time low (ATL) of $0.02559, reflecting a dramatic 94.48% decrease over the one-year period.
ZND Current Market Situation
As of December 23, 2025, ZND is trading at $0.02771, representing a significant contraction from its peak valuation. The token has experienced considerable volatility across multiple timeframes:
- 1-hour performance: +5.19% ($0.001367 increase)
- 24-hour performance: -6.15% ($0.001816 decrease)
- 7-day performance: -7.95% ($0.002393 decrease)
- 30-day performance: -64.09% ($0.049455 decrease)
- Year-to-date performance: -94.48% ($0.474283 decrease)
Market Capitalization Metrics:
- Current Market Cap: $5,638,992.88
- Fully Diluted Valuation (FDV): $19,240,416.97
- 24-hour Trading Volume: $1,708,640.85
- Market Cap to FDV Ratio: 12.63%
Supply Dynamics:
- Circulating Supply: 203,500,284.08 ZND (12.63% of total supply)
- Total Supply: 694,349,223 ZND
- Maximum Supply: 694,349,223 ZND
ZND maintains a ranking of #1461 among cryptocurrencies by market capitalization, with a market dominance of 0.00060%. The token is held by 2,257 addresses and is listed on 5 exchanges, including Gate.com. Trading activity shows $1.71 million in 24-hour volume, reflecting ongoing market participation despite the pronounced downward trend.
Click to view current ZND market price

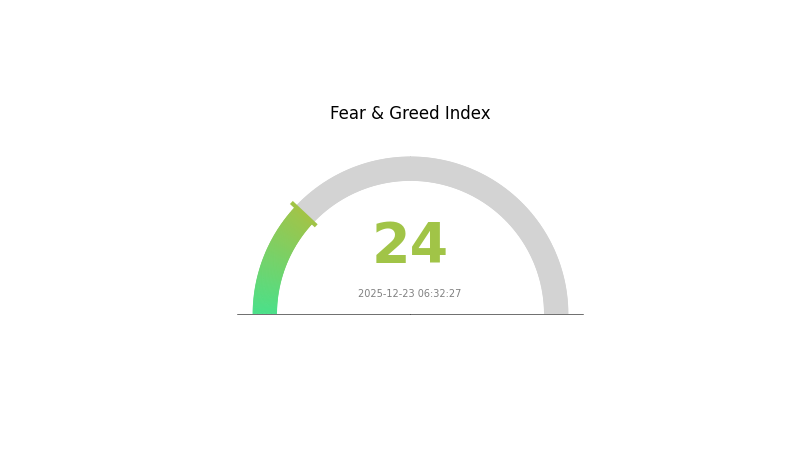
ZND Market Sentiment Indicator
2025-12-23 Fear and Greed Index: 24 (Extreme Fear)
Click to view current Fear & Greed Index
The crypto market is experiencing extreme fear with a Fear and Greed Index of 24. This indicates severe market pessimism and risk aversion among investors. During periods of extreme fear, assets are typically undervalued, presenting potential buying opportunities for contrarian investors. However, such conditions also signal heightened volatility and downside risks. Traders should exercise caution, maintain proper risk management, and avoid emotional decision-making. Monitor market developments closely on Gate.com to identify optimal entry points when sentiment begins to stabilize.
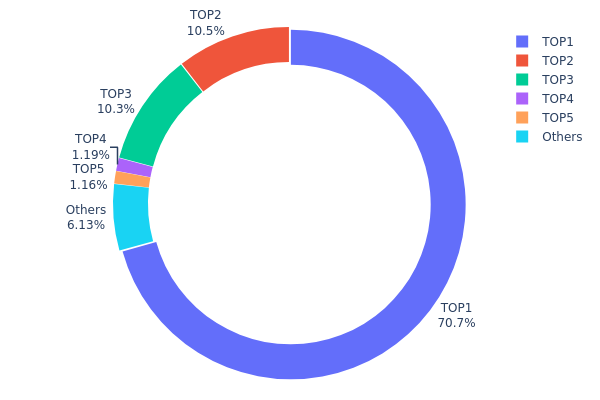
ZND Holdings Distribution
The address holdings distribution chart represents the concentration of ZND tokens across the blockchain network, displaying the top holders and their respective ownership percentages. This metric is instrumental in assessing the decentralization level of the token ecosystem and identifying potential governance risks or market manipulation vectors.
The current ZND distribution exhibits significant concentration concerns, with the top address commanding 70.67% of total holdings, representing an exceptionally high degree of centralization. The combined stake of the top three addresses accounts for 91.51% of all tokens, indicating a highly skewed ownership structure. While addresses ranked four and five each hold approximately 1.16-1.18% of the circulating supply, the remaining holders collectively account for merely 6.15%, further underscoring the pronounced concentration at the upper tier of the holder hierarchy.
This extreme centralization poses considerable implications for market structure and stability. The dominant position of the leading address creates substantial price manipulation potential and liquidity risks, as coordinated token movements could trigger significant price fluctuations or market disruptions. The heavy concentration among a small number of stakeholders compromises the project's decentralization objectives and introduces elevated counterparty risk. Such distribution patterns typically indicate early-stage projects or those with concentrated institutional involvement, where governance mechanisms may lack sufficient checks and balances to prevent potential abuse of market power or dilutive token release decisions.
View current ZND Holdings Distribution
| Top | Address | Holding Qty | Holding (%) |
|---|---|---|---|
| 1 | 0xcb3d...dba792 | 490358.25K | 70.67% |
| 2 | 0x6edf...1c5048 | 72883.36K | 10.50% |
| 3 | 0x7812...d657fc | 71801.02K | 10.34% |
| 4 | 0xae4f...859943 | 8237.78K | 1.18% |
| 5 | 0x0d07...b492fe | 8063.94K | 1.16% |
| - | Others | 42514.18K | 6.15% |
Core Factors Influencing ZND's Future Price
Supply Mechanism
-
Token Distribution: Based on available data, ZND maintains a defined supply structure with major holders concentrated among the top addresses. The top holder (0x378f...54739d) controls approximately 40.04% of the total supply, followed by significant holdings at 20.00%, 17.50%, and 11.73% respectively, with remaining distribution among other holders at 9.31%.
-
Historical Supply Impact: Supply scarcity plays a crucial role in cryptocurrency valuation. As with most digital assets, the limited supply nature of ZND contributes to its potential value proposition when demand increases.
-
Current Market Implications: The concentrated nature of ZND's token distribution suggests that large holder movements could significantly influence price dynamics. Investor monitoring of these major positions on Gate.com and other platforms remains essential for understanding potential supply-side pressure.
Regulatory Environment
-
Market Sentiment: The regulatory environment surrounding cryptocurrency significantly impacts ZND's price trajectory. Changes in global regulatory frameworks can enhance market confidence or trigger investor caution and market withdrawals.
-
Investor Monitoring: Market participants closely track regulatory developments to anticipate potential price movements, making regulatory clarity an important factor for ZND investors to monitor.
Macroeconomic Environment
-
Monetary Policy Influence: Broader economic conditions, including inflation rates and interest levels, play important roles in shaping cryptocurrency investment behavior and market trends.
-
Inflation Hedge Properties: During periods of economic uncertainty, cryptocurrencies like ZND may be viewed as potential hedges against traditional financial system risks, which could support price appreciation. Conversely, positive economic indicators might redirect investor attention toward traditional assets.
-
Global Economic Factors: Interest rates, economic stability, and macroeconomic conditions fundamentally influence how investors allocate capital between traditional and digital assets, directly affecting ZND's market performance.
Technical Development and Ecosystem
-
Technological Advancement: Progress in blockchain technology and cryptocurrency infrastructure enhances digital asset functionality, security, and scalability. Such improvements make tokens more attractive to users and investors, positively impacting price dynamics.
-
Market Dynamics: Understanding technological trends remains critical for predicting future price movements in the cryptocurrency market.
Investor Note: ZND's future price is influenced by supply scarcity, market demand, and the regulatory environment. Technological advancements and macroeconomic factors also play key roles. Investors should monitor these dynamics closely through platforms like Gate.com and stay informed about global economic developments.
Three、2025-2030 ZND Price Forecast
2025 Outlook
- Conservative Forecast: $0.0161 - $0.02825
- Neutral Forecast: $0.02825
- Optimistic Forecast: $0.03418 (requires sustained market momentum and positive ecosystem developments)
2026-2027 Medium-term Outlook
- Market Stage Expectation: Consolidation phase with gradual accumulation, characterized by moderate volatility and incremental adoption growth
- Price Range Forecast:
- 2026: $0.01842 - $0.03215
- 2027: $0.01964 - $0.04468
- Key Catalysts: Enhanced protocol functionality, increased institutional interest, expansion of DeFi applications, and improved market liquidity on major exchanges like Gate.com
2028-2030 Long-term Outlook
- Base Case Scenario: $0.02673 - $0.04543 (assuming steady technological progress and moderate market adoption)
- Optimistic Scenario: $0.03219 - $0.0556 (assuming accelerated network effects, strategic partnerships, and broader crypto market recovery)
- Transformational Scenario: $0.04578 - $0.06575 (extreme favorable conditions including mass adoption, breakthrough technological innovations, and major enterprise integration)
- 2030-12-31: ZND projected at $0.06575 (peak scenario with sustained bullish momentum)
| 年份 | 预测最高价 | 预测平均价格 | 预测最低价 | 涨跌幅 |
|---|---|---|---|---|
| 2025 | 0.03418 | 0.02825 | 0.0161 | 1 |
| 2026 | 0.03215 | 0.03122 | 0.01842 | 12 |
| 2027 | 0.04468 | 0.03168 | 0.01964 | 14 |
| 2028 | 0.04543 | 0.03818 | 0.02673 | 37 |
| 2029 | 0.0556 | 0.04181 | 0.03219 | 50 |
| 2030 | 0.06575 | 0.04871 | 0.04578 | 75 |
ZND Investment Strategy and Risk Management Report
IV. ZND Professional Investment Strategy and Risk Management
ZND Investment Methodology
(1) Long-term Holding Strategy
- Suitable investors: Users seeking stable exposure to regulated financial ecosystems and cryptocurrency infrastructure growth
- Operation recommendations:
- Accumulate ZND tokens during market downturns, leveraging the current 94.48% year-over-year decline as a potential accumulation opportunity
- Monitor ecosystem adoption metrics across zondacrypto's trading, earning, borrowing, and exploration features
- Maintain a 12-24 month holding horizon to benefit from platform growth and token utility expansion
(2) Active Trading Strategy
- Technical analysis tools:
- Support and Resistance Levels: Utilize historical highs ($0.55 on March 3, 2025) and current lows ($0.02559 on December 23, 2025) to identify entry and exit points
- Volume Analysis: Monitor the 24-hour trading volume ($1.71 million) relative to market cap movements to gauge market sentiment and potential breakout opportunities
- Swing trading key points:
- Watch for consolidation patterns following the 30-day decline of -64.09%
- Execute small position scaling with strict stop-loss orders at 2-5% below entry points given the token's volatility
ZND Risk Management Framework
(1) Asset Allocation Principles
- Conservative investors: 0.5-1% of total portfolio
- Active investors: 1-3% of total portfolio
- Professional investors: 3-5% of total portfolio (with hedging strategies)
(2) Risk Hedging Solutions
- Portfolio Diversification: Balance ZND holdings with established cryptocurrencies and traditional assets to mitigate concentration risk
- Dollar-Cost Averaging (DCA): Invest fixed amounts at regular intervals to reduce the impact of volatility and timing risk
(3) Secure Storage Solutions
- Hardware Wallet Options: Self-custody solutions for long-term holdings exceeding three months
- Exchange Custody: Store active trading positions on Gate.com, which provides institutional-grade security for frequently traded assets
- Security considerations: Implement multi-signature authentication for wallets containing significant ZND holdings, enable two-factor authentication on all exchange accounts, and maintain private keys in secure offline storage
V. ZND Potential Risks and Challenges
ZND Market Risk
- Extreme Price Volatility: ZND has experienced a 94.48% decline over the past year, indicating high sensitivity to market sentiment and liquidity conditions
- Low Liquidity Depth: With a 24-hour volume of $1.71 million against a market cap of $5.64 million, the token faces potential slippage during large trades
- Limited Market Dominance: ZND represents only 0.0006% of total cryptocurrency market capitalization, making it vulnerable to broader market movements
ZND Regulatory Risk
- Regional Compliance Exposure: While zondacrypto operates as a regulated entity in Central Europe, expansion into other jurisdictions may face divergent regulatory frameworks
- Regulatory Uncertainty: Changes in cryptocurrency classification or stablecoin regulations could impact the viability of zondacrypto Pay and the ZND ecosystem
- Compliance Costs: Maintaining full regulatory compliance across multiple jurisdictions increases operational expenses and reduces token utility economics
ZND Technology Risk
- Smart Contract Vulnerability: As an ERC-20 token, ZND is dependent on Ethereum network security and susceptible to smart contract exploits
- Network Scalability: Ethereum congestion during high-demand periods may impact transaction throughput for ZND token transfers and ecosystem operations
- Ecosystem Integration Dependency: The token's value is directly tied to adoption rates across zondacrypto's Trade, Earn, Borrow, and Explore platforms; failure to achieve adoption thresholds would diminish utility
VI. Conclusion and Action Recommendations
ZND Investment Value Assessment
ZND presents a specialized investment opportunity within the cryptocurrency market, offering exposure to a regulated financial ecosystem built on Central Europe's established zondacrypto infrastructure since 2014. The token serves as the primary settlement unit within an integrated platform combining trading, lending, and earning opportunities. However, the 94.48% year-over-year decline, combined with a market capitalization of only $5.64 million and limited liquidity, positions ZND as a high-risk, high-reward speculative asset. Success depends critically on the ecosystem's ability to achieve meaningful adoption across its four core pillars and maintain regulatory compliance across expanding markets. The current market conditions suggest ZND may appeal primarily to risk-tolerant investors with specific exposure objectives to regulated European crypto infrastructure.
ZND Investment Recommendations
✅ Beginners: Start with minimal allocation (0.5% of crypto portfolio) through Gate.com's spot trading, using limit orders to control entry prices during consolidation phases. Avoid margin trading and derivatives until you develop deeper familiarity with ZND's ecosystem dynamics.
✅ Experienced Investors: Consider dollar-cost averaging during periods of downward price movement, allocating 1-3% of total portfolio while monitoring key ecosystem metrics including platform transaction volumes and regulatory developments. Implement strict stop-loss orders at 2-5% below entry points.
✅ Institutional Investors: Structure positions through institutional custody solutions on Gate.com, combining spot purchases with long-dated options strategies to hedge regulatory and liquidity risks. Conduct direct engagement with the ZND team regarding roadmap execution and adoption metrics across platform verticals.
ZND Trading Participation Methods
- Spot Trading: Purchase ZND directly on Gate.com using major trading pairs (ZND/USDT, ZND/ETH) with market or limit order execution
- Token Swaps: Convert between ZND and other assets on Gate.com's exchange interface, utilizing available liquidity pools
- Staking and Ecosystem Participation: Hold ZND tokens to unlock rewards and exclusive benefits within the zondacrypto ecosystem across its Earn, Trade, Borrow, and Explore verticals
Cryptocurrency investment carries extreme risk. This report does not constitute investment advice. Investors should make decisions based on their individual risk tolerance and financial situation. It is strongly recommended to consult with a professional financial advisor before investing. Never invest more than you can afford to lose.
FAQ
Is Zen Coin good?
Zen Coin (ZEN) from Horizen is a privacy-focused blockchain with the industry's largest node network. It offers strong security, scalability, and enterprise potential. Its value depends on market adoption and investor sentiment.
What will ZND price be in 2024/2025?
In 2025, ZND is expected to average $0.05334, with a potential high of $0.07094 and a low of $0.03093 based on market analysis and trend forecasting.
What factors affect ZND token price?
ZND token price is affected by market demand, trading volume, whale activity, cryptocurrency market trends, and investor sentiment. Large holder movements and overall market conditions significantly influence price fluctuations.
How can I predict ZND price movements?
To predict ZND price movements, analyze technical indicators, monitor trading volume and market trends. Track on-chain metrics, sentiment analysis, and historical patterns. Use reliable data sources and combine multiple analysis methods for better accuracy.
What is the historical price performance of ZND?
ZND Token has shown moderate volatility in recent months. As of late November 2025, ZND traded around $0.079, fluctuating between $0.074545 and $0.083303. The token demonstrates typical crypto market dynamics with regular price swings reflecting broader market sentiment and trading activity.
Share
Content
Introduction: ZND's Market Position and Investment Value
I. ZND Price History Review and Current Market Status
Supply Mechanism
Regulatory Environment
Macroeconomic Environment
Technical Development and Ecosystem
Three、2025-2030 ZND Price Forecast
IV. ZND Professional Investment Strategy and Risk Management
V. ZND Potential Risks and Challenges
VI. Conclusion and Action Recommendations
FAQ
How to Buy Cryptocurrency


Trending Cryptocurrencies


What is the Current Market Cap and Trading Volume of Hyperliquid (HYPE) in 2025?
PUNDIX vs GRT: A Comprehensive Comparison of Two Leading Blockchain Utility Tokens
ADX vs LINK: Comparing Two Leading Oracle and Data Solutions for Blockchain Applications
BTRST vs AAVE: Comparing Two Leading Governance Tokens in the DeFi Ecosystem
ENSO vs QNT: A Comprehensive Comparison of Climate Oscillation Patterns and Quantum Computing Technologies
G vs LINK: A Comprehensive Comparison of Two Leading Blockchain Protocols and Their Impact on Decentralized Finance

How to Withdraw Funds from Hotbit After the Platform Shutdown
AI Predicts the 10 Cryptos Poised for Growth in 2025 | Expert Insights
What is SMTX: A Comprehensive Guide to Surface Mount Technology X and Its Applications in Modern Electronics Manufacturing

What is SOIL: Understanding the Foundation of Earth's Ecosystems and Agricultural Productivity

What is KONET: A Comprehensive Guide to Korea's National Optical Network Infrastructure