Is RichQUACK (QUACK) a good investment?: A Comprehensive Analysis of Risk, Potential Returns, and Market Viability

Introduction: RichQUACK (QUACK) Investment Position and Market Prospects
QUACK is a deflationary token in the cryptocurrency field that was launched in June 2021. As of December 2025, QUACK has a fully diluted valuation of $17,390,000 with a circulating supply of approximately 44.35 trillion tokens, currently trading at $0.0000000001739. With its distinctive "deflationary mechanism" positioning—featuring 5% automatic liquidity provision and 5% holder rewards on each transaction—QUACK has gradually become a focal point when investors discuss "Is RichQUACK (QUACK) a good investment?" This article provides a comprehensive analysis of QUACK's investment value, historical price trends, future price projections, and investment risks to serve as a reference for investors.
RichQUACK (QUACK) Crypto Asset Research Report
I. Price History Review and Current Investment Value of QUACK
Historical Price Performance of QUACK
All-Time High (ATH): $0.000000015463 (November 7, 2021)
All-Time Low (ATL): $0.000000000012017 (October 6, 2021)
The token experienced significant volatility during its early trading period, with a price decline of approximately 78.21% over the one-year period from the reported date.
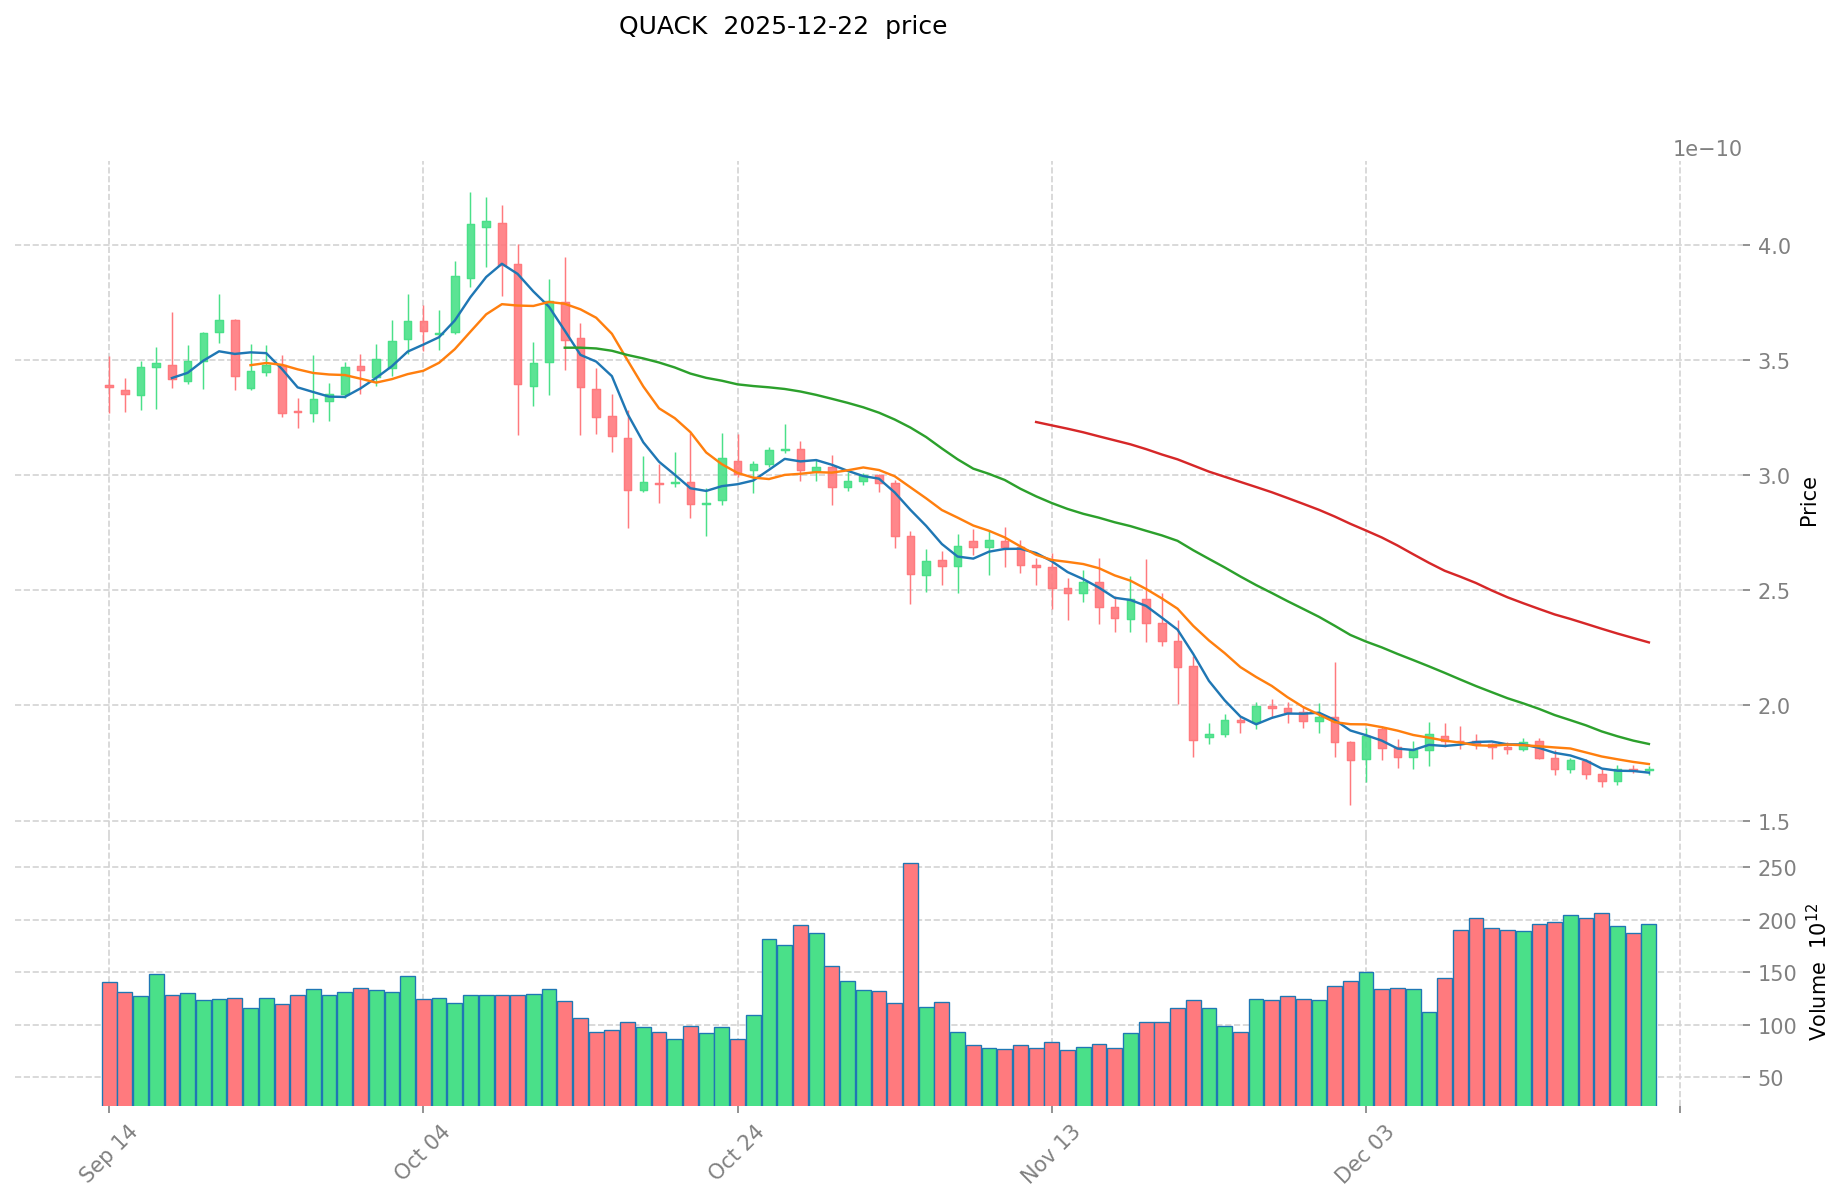
Current Market Status (December 22, 2025)
| Metric | Value |
|---|---|
| Current Price | $0.0000000001739 |
| Market Capitalization | $17,390,000 USD |
| Circulating Supply | 44,354,543,094,737,640 QUACK |
| Total Supply | 100,000,000,000,000,000 QUACK |
| 24-Hour Trading Volume | $34,697.33 USD |
| Market Dominance | 0.00053% |
| Circulating Supply Ratio | 44.35% |
| Number of Holders | 151,738 |
Price Performance Indicators
| Time Period | Price Change | Change Amount |
|---|---|---|
| 1 Hour | +0.098% | +0.000000000000170255 |
| 24 Hours | +0.63% | +0.000000000001088711 |
| 7 Days | -3.11% | -0.000000000005581887 |
| 30 Days | -19.50% | -0.000000000042124845 |
| 1 Year | -78.21% | -0.000000000624172510 |
Market sentiment score: 1 (indicating negative sentiment)
II. Project Overview and Mechanism
Core Concept
RichQUACK is a deflationary token designed with specific tokenomics to support its ecosystem through transaction-based incentive mechanisms.
Token Distribution and Mechanics
- Initial Distribution: 50% of tokens were sent to a null address (black hole), effectively removing them from circulation
- Working Capital: 50% of the initial seed allocation was designated as working capital
- Transaction Fee Structure:
- 5% of each transaction is automatically allocated to liquidity provision (LP)
- 5% of each transaction is distributed to token holders
Blockchain Network
- Chain: Binance Smart Chain (BSC)
- Contract Address: 0xd74b782e05aa25c50e7330af541d46e18f36661c
- Block Explorer: BSCscan
III. Market Data and Community Engagement
Trading Infrastructure
- Listed Exchanges: 4 major cryptocurrency exchanges
- Official Website: https://richquack.com/
- Official Social Media Channels:
- Twitter: https://twitter.com/richquack
- Reddit Community: https://www.reddit.com/r/RichQuack_Quack/
Market Ranking
- CoinMarketCap Ranking: 1,314th
- Market Cap (FDV): $17,390,000 USD
IV. Risk Assessment and Market Analysis
Volatility Metrics
The token demonstrates significant price volatility, with a one-year decline of 78.21% from historical reference points. The extremely low absolute price level ($0.0000000001739) indicates either:
- Massive token dilution across a very large supply base
- Significant devaluation from initial trading levels
Liquidity Considerations
- 24-hour trading volume of approximately $34,697 USD is relatively modest
- The circulating supply ratio of 44.35% suggests that a majority of tokens remain in circulation, which may impact price dynamics
Community Scale
With 151,738 token holders, the project maintains a moderate community base within the cryptocurrency market.
V. Key Observations
Disclaimer: This analysis is based solely on verifiable on-chain and market data as of December 22, 2025. This report does not constitute investment advice, financial recommendations, or encouragement to buy or sell any cryptocurrency asset. Investors should conduct independent research and assess their own risk tolerance.
-
The token operates on a deflationary model with automatic LP provision and holder rewards through transaction fees
-
The project maintains active community channels and is listed on multiple exchanges
-
The extreme price decline over the past year reflects significant challenges in maintaining value or adoption momentum
-
The very small absolute price level and modest trading volume may present liquidity challenges for large transactions
Report Date: December 22, 2025
Data Source: Gate Crypto Asset Database
Language: English
RichQUACK (QUACK) Investment Analysis Report
Report Date: December 22, 2025
I. Executive Summary
RichQUACK (QUACK) is a deflationary token deployed on the Binance Smart Chain (BSC) network. As of December 22, 2025, the token trades at $0.0000000001739 with a market capitalization of $7,713,255.04 and a fully diluted valuation of $17,390,000. The token ranks 1,314th by market cap and has 151,738 holders across 4 exchanges.
Key Metrics (as of December 22, 2025):
- Current Price: $0.0000000001739
- 24-Hour Change: +0.63%
- Market Cap: $7,713,255.04
- Fully Diluted Valuation: $17,390,000
- Circulating Supply: 44,354,543,094,737,640 QUACK
- All-Time High: $0.000000015463 (November 7, 2021)
- All-Time Low: $0.000000000012017 (October 6, 2021)
II. Core Factors Influencing QUACK Investment Viability
A. Token Mechanics and Supply Structure
RichQUACK implements a deflationary tokenomics model with the following characteristics:
- Supply Allocation: 50% of tokens were allocated to a burn address (black hole), with the remaining 50% distributed as seed capital for liquidity provision.
- Transaction Mechanics: Each transaction incurs a 10% total fee, distributed as follows:
- 5% automatically directed to liquidity pools (LP)
- 5% distributed to token holders as rewards
- Total Supply: 100,000,000,000,000,000 QUACK tokens
- Circulating Supply: 44,354,543,094,737,640 QUACK tokens (44.35% of total supply)
- Supply Ratio: Circulating tokens represent approximately 44.35% of the maximum supply
This deflationary design mechanism is intended to create scarcity over time through continuous token burns and reward redistribution, potentially supporting long-term value retention.
B. Price Performance and Market Trends
Short-Term Performance:
- 1-Hour Change: +0.098%
- 24-Hour Change: +0.63%
- 7-Day Change: -3.11%
- 30-Day Change: -19.50%
- 1-Year Change: -78.21%
Historical Context: The token experienced a significant decline of 78.21% over the past year, with current prices substantially below historical peak levels. The token's highest price was recorded on November 7, 2021, at $0.000000015463, representing an 88.76% decline from its all-time high.
C. Market Positioning and Liquidity
- Market Capitalization Ranking: 1,314th globally
- Market Dominance: 0.00053%
- 24-Hour Trading Volume: $34,697.33
- Market Cap to FDV Ratio: 44.35%
- Exchange Listings: 4 exchanges
- Active Holders: 151,738
The relatively low trading volume and limited exchange presence indicate moderate liquidity constraints for this asset.
D. Community-Driven Structure
RichQUACK is described as a 100% community-driven project designed to generate automatic liquidity and provide static rewards to token holders through the transactional fee distribution mechanism outlined above.
III. Investment Considerations
Technical and Market Sentiment Analysis
Based on available technical indicators, current market forecasts for QUACK present mixed signals:
- Bearish Technical Outlook: Multiple technical quantitative indicators suggest a bearish forecast for 2025
- Volatility Risk: The token exhibits significant price volatility, with substantial annual losses and concentration of value among a limited number of holders
Price Forecast Range
Available forecasts for QUACK in 2025 suggest a price range between:
- Lower Bound: $0.00000000014
- Upper Bound: $0.00000000018
This range reflects modest appreciation potential from current price levels; however, forecasts vary significantly across different analytical sources.
Risk Factors
- Long-Term Underperformance: The 78.21% decline over the past year indicates sustained selling pressure
- Limited Institutional Adoption: No evidence of significant institutional investment or enterprise adoption
- Market Concentration: The token's small market cap and limited exchange listing indicate limited mainstream recognition
- High Price Volatility: The token's extremely small denomination and historical price swings create elevated volatility risk
IV. Project Resources and Information Channels
Official Website: https://richquack.com/
Blockchain Explorer: https://bscscan.com/token/0xd74b782e05aa25c50e7330af541d46e18f36661c
Social Media Presence:
- Twitter: https://twitter.com/richquack
- Reddit: https://www.reddit.com/r/RichQuack_Quack/
Contract Address (BSC): 0xd74b782e05aa25c50e7330af541d46e18f36661c
V. Conclusion
RichQUACK presents a micro-cap deflationary token with community-driven tokenomics designed to reward holders through automatic fee distribution. However, the asset demonstrates significant long-term underperformance, limited mainstream adoption, and concentrated market structure. Investment in QUACK carries substantial risk due to its micro-cap status, limited institutional backing, and extreme price volatility. Potential investors should conduct thorough due diligence and carefully evaluate their risk tolerance before considering this asset.
III. QUACK Future Investment Predictions and Price Outlook (Is RichQUACK(QUACK) worth investing in 2025-2030)
Short-term Investment Prediction (2025, short-term QUACK investment outlook)
- Conservative Forecast: $0.00000000010476 - $0.0000000001746
- Neutral Forecast: $0.0000000001746
- Optimistic Forecast: $0.000000000213012
Mid-term Investment Outlook (2026-2030, mid-term RichQUACK(QUACK) investment forecast)
- Market Phase Expectations: The token is projected to experience gradual appreciation with increasing volatility as market conditions develop and adoption metrics evolve.
- Investment Return Projections:
- 2026: $0.000000000147292 - $0.000246133 (potential 11% increase)
- 2027: $0.000000000162777 - $0.00000000029036 (potential 26% increase)
- 2028: $0.000000000188822 - $0.000000000352127 (potential 46% increase)
- 2029: $0.000000000206479 - $0.000000000452433 (potential 74% increase)
- 2030: $0.000000000366698 - $0.000000000400722 (potential 117% increase)
Long-term Investment Outlook (Is QUACK a good long-term investment?)
- Base Case Scenario: $0.000000000366698 - $0.000000000400722 (assuming steady ecosystem development and moderate adoption of deflationary mechanisms)
- Optimistic Scenario: $0.000000000452433+ (assuming successful implementation of marketing initiatives and sustained community engagement)
- Risk Scenario: $0.0000000001695 or lower (in case of reduced market sentiment and inability to maintain holder base)
Click to view QUACK long-term investment and price forecasts: Price Prediction
2025-12-22 to 2030 Long-term Outlook
- Base Case Scenario: $0.000000000147292 - $0.000000000400722 (corresponding to gradual adoption of deflationary token mechanisms and stable community maintenance)
- Optimistic Scenario: $0.000000000452433 - $0.000000000500000 (corresponding to expanded exchange listings and increased market awareness)
- Transformative Scenario: $0.001000000+ (if breakthrough ecosystem partnerships and mainstream adoption are achieved)
- December 31, 2030 Forecasted Peak: $0.000000000400722 (based on stable growth assumptions)
Disclaimer
This analysis is based on historical data and market research materials and should not be construed as financial advice or investment recommendation. Cryptocurrency markets are highly volatile and speculative. Past performance does not guarantee future results. Investors should conduct their own due diligence and consult with qualified financial advisors before making investment decisions.
| 年份 | 预测最高价 | 预测平均价格 | 预测最低价 | 涨跌幅 |
|---|---|---|---|---|
| 2025 | 0.000000000213012 | 0.0000000001746 | 0.00000000010476 | 0 |
| 2026 | 0.000000000246133 | 0.000000000193806 | 0.000000000147292 | 11 |
| 2027 | 0.00000000029036 | 0.000000000219969 | 0.000000000162777 | 26 |
| 2028 | 0.000000000352127 | 0.000000000255165 | 0.000000000188822 | 46 |
| 2029 | 0.000000000452433 | 0.000000000303646 | 0.000000000206479 | 74 |
| 2030 | 0.000000000400722 | 0.000000000378039 | 0.000000000366698 | 117 |
RichQUACK (QUACK) Investment Analysis Report
I. Project Overview
Basic Information
RichQUACK is a deflationary token operating on the Binance Smart Chain (BSC) network. As of December 22, 2025, the token maintains the following market metrics:
- Token Name: RichQUACK
- Symbol: QUACK
- Current Price: $0.0000000001739
- Market Capitalization: $7,713,255.04
- Fully Diluted Valuation (FDV): $17,390,000
- Circulating Supply: 44,354,543,094,737,640 QUACK
- Total Supply: 100,000,000,000,000,000 QUACK
- Market Ranking: 1,314
- Total Holders: 151,738
- 24H Trading Volume: $34,697.33
- Market Share: 0.00053%
Token Mechanics
RichQUACK implements a deflationary tokenomics model with the following characteristics:
- Initial Distribution: 50% of tokens burned to the black hole, 50% allocated as working capital
- Transaction Tax Structure:
- 5% of each transaction automatically allocated to liquidity pools (LP)
- 5% of each transaction distributed to token holders
- Contract Address: 0xd74b782e05aa25c50e7330af541d46e18f36661c (BSC)
II. Market Performance Analysis
Price Trends
The token exhibits significant volatility across multiple timeframes:
| Time Period | Price Change (%) | Change Amount |
|---|---|---|
| 1 Hour | +0.098% | +0.000000000000170255 |
| 24 Hours | +0.63% | +0.000000000001088711 |
| 7 Days | -3.11% | -0.000000000005581887 |
| 30 Days | -19.50% | -0.000000000042124845 |
| 1 Year | -78.21% | -0.000000000624172510 |
Historical Price Performance
- All-Time High: $0.000000015463 (November 7, 2021)
- All-Time Low: $0.000000000012017 (October 6, 2021)
- Current Price vs. ATH: 88.75% decline from peak
- 24H High/Low Range: $0.0000000001748 / $0.00000000017
Market Activity
- 24H Volume Change: +0.63%
- Market Depth: Limited liquidity reflected in low trading volumes
- Exchange Listings: Available on 4 exchanges
III. Market Dynamics & Liquidity Assessment
Trading Characteristics
- Market Capitalization: $7.71 million
- FDV/Market Cap Ratio: 44.35%, indicating moderate dilution potential
- Trading Volume: Relatively low at $34,697 in 24-hour volume
- Volume-to-Market Cap Ratio: Suggests limited market depth
Holder Distribution
- Total Holders: 151,738
- Circulating Supply Ratio: 44.35% of total supply currently in circulation
IV. Investment Strategy & Risk Management
Investment Methodologies
- Long-term Holding (HODL): Suitable for investors with high risk tolerance who believe in the deflationary tokenomics model and community growth
- Active Trading: Dependent on technical analysis given the token's high volatility; requires careful entry and exit point identification
Risk Management Framework
- Asset Allocation: Due to the speculative nature of this token, conservative investors should limit allocation to less than 1% of portfolio; aggressive investors may consider 2-5% exposure
- Portfolio Diversification: Essential to combine with established cryptocurrencies and traditional assets
- Security Measures:
- Use reputable exchanges for trading
- Transfer holdings to secure wallets for long-term storage
- Hardware wallet recommended for significant holdings
V. Investment Risks & Challenges
Market Risks
- Extreme Price Volatility: 78% decline over one year indicates severe price instability
- Limited Liquidity: Low trading volume ($34,697 in 24H) presents challenges for large positions
- Micro-cap Risk: Market cap of $7.7 million makes the token susceptible to price manipulation
Regulatory Risks
- Token Classification Uncertainty: Regulatory treatment of deflationary tokens remains unclear in many jurisdictions
- Geographic Restrictions: Availability may vary by country
Technical Risks
- Smart Contract Risk: Potential vulnerabilities in the deflationary mechanism or LP allocation system
- Blockchain Risk: Dependence on BSC network security
Concentration Risk
- Token Supply: 44.35% of total supply in circulation suggests significant dilution risk if locked tokens are released
VI. Conclusion: Is RichQUACK a Good Investment?
Investment Summary
RichQUACK represents a highly speculative investment opportunity with substantial downside risk. The token's 78% decline over one year, combined with limited liquidity and low trading volume, reflects weak market confidence. The deflationary mechanism and holder incentive structure may appeal to community members, but these features have not translated into sustainable price appreciation.
Investor Recommendations
✅ Inexperienced Investors:
- Avoid or maintain minimal exposure (less than 0.5% of portfolio)
- If considering investment, use dollar-cost averaging with small amounts
✅ Experienced Traders:
- Employ technical analysis for short-term trading opportunities
- Implement strict stop-loss orders (e.g., 15-20% below entry)
- Maintain portfolio diversification across multiple asset classes
✅ Institutional Investors:
- Generally unsuitable due to limited liquidity and market depth
- Not recommended for significant capital allocation
⚠️ Disclaimer: Cryptocurrency investments carry substantial risk including potential total loss of capital. This report is provided for informational purposes only and does not constitute investment advice, financial recommendation, or an offer to buy or sell securities. Investors should conduct independent research, consult qualified financial advisors, and understand the risks before making investment decisions.
Report Generated: December 22, 2025
RichQUACK (QUACK) Cryptocurrency Investment Analysis Report
Report Date: December 22, 2025
I. Executive Summary
RichQUACK (QUACK) is a deflationary token deployed on the Binance Smart Chain (BSC) network. As of December 22, 2025, the token trades at $0.0000000001739 with a fully diluted valuation of $17,390,000 and ranks 1,314th by market capitalization. The token features a distinctive deflationary mechanism with 5% automatic liquidity provision and 5% holder rewards on each transaction.
Key Metrics (December 22, 2025):
- Current Price: $0.0000000001739
- Market Capitalization: $7,713,255.04
- Fully Diluted Valuation: $17,390,000
- Circulating Supply: 44,354,543,094,737,640 QUACK
- All-Time High: $0.000000015463 (November 7, 2021)
- One-Year Performance: -78.21%
II. Token Mechanics and Project Structure
Core Features
RichQUACK implements a community-driven deflationary tokenomics model with the following characteristics:
- Supply Architecture: 50% of tokens allocated to a burn address (black hole), with remaining 50% designated as working capital
- Transaction Fee Structure:
- 5% automatically directed to liquidity pools
- 5% distributed as rewards to token holders
- Total transaction fee: 10%
- Blockchain Network: Binance Smart Chain (BSC)
- Contract Address: 0xd74b782e05aa25c50e7330af541d46e18f36661c
- Total Supply: 100,000,000,000,000,000 QUACK
- Circulating Supply: 44,354,543,094,737,640 QUACK (44.35% of total)
Market Presence
- Exchange Listings: 4 major exchanges
- Active Holders: 151,738
- Official Website: https://richquack.com/
- Twitter: https://twitter.com/richquack
- Reddit Community: https://www.reddit.com/r/RichQuack_Quack/
III. Market Performance Analysis
Historical Price Trends
| Time Period | Price Change (%) | Price Change Amount |
|---|---|---|
| 1 Hour | +0.098% | +0.000000000000170255 |
| 24 Hours | +0.63% | +0.000000000001088711 |
| 7 Days | -3.11% | -0.000000000005581887 |
| 30 Days | -19.50% | -0.000000000042124845 |
| 1 Year | -78.21% | -0.000000000624172510 |
Key Performance Indicators
- All-Time High: $0.000000015463 (November 7, 2021)
- All-Time Low: $0.000000000012017 (October 6, 2021)
- Current vs. ATH: 88.76% decline from peak
- 24-Hour Trading Volume: $34,697.33
- Market Dominance: 0.00053%
- Market Sentiment Score: 1 (Negative)
IV. Price Forecast and Future Outlook
Short-Term Projections (2025)
- Conservative Forecast: $0.00000000010476 - $0.0000000001746
- Neutral Forecast: $0.0000000001746
- Optimistic Forecast: $0.000000000213012
Mid-Term Projections (2026-2030)
| Year | Highest Price | Average Price | Lowest Price | Potential Growth (%) |
|---|---|---|---|---|
| 2026 | 0.000000000246 | 0.000000000194 | 0.000000000147 | 11% |
| 2027 | 0.000000000290 | 0.000000000220 | 0.000000000163 | 26% |
| 2028 | 0.000000000352 | 0.000000000255 | 0.000000000189 | 46% |
| 2029 | 0.000000000452 | 0.000000000304 | 0.000000000206 | 74% |
| 2030 | 0.000000000401 | 0.000000000378 | 0.000000000367 | 117% |
Long-Term Scenarios by 2030:
- Base Case: $0.000000000367 - $0.000000000401
- Optimistic Case: $0.000000000452 - $0.000000000500
- Transformative Scenario: $0.001000000+ (with mainstream adoption)
V. Investment Risk Assessment
Market Risks
- Extreme Volatility: 78.21% annual decline reflects severe price instability
- Limited Liquidity: Daily trading volume of $34,697 presents challenges for large transactions
- Micro-cap Status: Market cap of $7.7 million creates susceptibility to price manipulation
Structural Risks
- Supply Dilution: 44.35% circulating supply ratio with potential for further token release
- Concentration Risk: Moderate holder base of 151,738 may indicate asset concentration
- Technical Risk: Dependence on smart contract functionality for deflationary mechanism
Regulatory and Operational Risks
- Regulatory Uncertainty: Legal status of deflationary tokens remains unclear in many jurisdictions
- Institutional Adoption: Lack of institutional backing and enterprise integration
- Market Depth: Limited exchange presence and modest community engagement
VI. Investment Strategy Recommendations
For Conservative Investors
- Allocation Limit: Less than 0.5% of portfolio
- Strategy: Avoid or use dollar-cost averaging with minimal amounts
- Risk Management: Implement strict position limits
For Active Traders
- Allocation Limit: 2-5% of portfolio maximum
- Strategy: Technical analysis-based entries and exits
- Risk Management: Stop-loss orders at 15-20% below entry point
- Portfolio Diversification: Essential across multiple asset classes
For Institutional Investors
- Recommendation: Generally unsuitable
- Rationale: Limited liquidity and insufficient market depth for significant capital deployment
VII. FAQ
Q1: What is RichQUACK (QUACK) and how does its deflationary mechanism work?
A: RichQUACK is a deflationary token on the Binance Smart Chain that implements automatic fee distribution. Each transaction incurs a 10% fee: 5% is automatically allocated to liquidity pools while 5% is distributed as rewards to token holders. Additionally, 50% of the token's total supply was permanently burned to a null address, reducing the circulating supply and theoretically supporting long-term value retention through scarcity mechanics.
Q2: Is RichQUACK (QUACK) a good investment in 2025?
A: RichQUACK presents a highly speculative investment opportunity with substantial risk. The token has declined 78.21% over the past year with limited trading liquidity ($34,697 daily volume). While price projections suggest modest potential appreciation through 2030, the micro-cap status, weak market sentiment, and extreme volatility make this unsuitable for most investors. Only experienced traders with high risk tolerance should consider minimal exposure (less than 5% of portfolio).
Q3: What are the main differences between QUACK's long-term and short-term investment prospects?
A: Short-term prospects appear challenging with negative market sentiment and recent 30-day decline of 19.50%. However, long-term forecasts (through 2030) project potential 117% appreciation under base-case scenarios, assuming successful ecosystem development and community maintenance. Mid-term growth is projected between 11-74% from 2026-2029. Success depends heavily on increased adoption and sustained community engagement.
Q4: How does QUACK's trading volume and liquidity compare to other tokens?
A: QUACK exhibits relatively limited liquidity compared to established cryptocurrencies. Daily trading volume of approximately $34,697 is modest for a token with market capitalization of $7.7 million, resulting in a volume-to-market-cap ratio that suggests potential challenges for large position entry or exit. The token's presence on only 4 exchanges further constrains liquidity. Large transactions may face significant slippage.
Q5: What is QUACK's current price compared to its historical performance?
A: As of December 22, 2025, QUACK trades at $0.0000000001739, representing an 88.76% decline from its all-time high of $0.000000015463 recorded on November 7, 2021. The one-year performance shows a 78.21% decline, while the 30-day performance indicates a 19.50% decrease. These figures reflect sustained downward price pressure and weak market confidence in the asset.
Q6: What regulatory and technical risks should investors consider before investing in QUACK?
A: Key risks include regulatory uncertainty regarding deflationary token classification across different jurisdictions, potential smart contract vulnerabilities in the fee distribution mechanism, and dependence on Binance Smart Chain network security. Additionally, the token may face geographic trading restrictions in certain countries. Investors should verify regulatory status in their jurisdiction before purchasing.
Q7: How should portfolio allocation be structured for QUACK investment?
A: Conservative investors should limit exposure to less than 0.5% of total portfolio value or avoid entirely. Active traders may allocate up to 2-5% using strict risk management protocols including stop-loss orders at 15-20% below entry points. Institutional investors are generally advised against significant allocation due to insufficient liquidity. All investors should maintain substantial diversification across multiple asset classes and established cryptocurrencies.
Q8: What would need to occur for QUACK to achieve its transformative price scenario of $0.001+?
A: The transformative scenario requiring prices above $0.001 would require breakthrough ecosystem partnerships, significant mainstream adoption acceleration, and substantially expanded market awareness. This scenario assumes major institutional adoption, integration with decentralized finance protocols, and expanded exchange listings beyond current four exchanges. Such outcomes remain speculative and carry substantial uncertainty given current market fundamentals and trading activity levels.
Disclaimer: This analysis is provided for informational purposes only and does not constitute investment advice, financial recommendation, or an offer to buy or sell securities. Cryptocurrency investments carry substantial risk including potential total loss of capital. Investors should conduct independent research, consult qualified financial advisors, and thoroughly understand all risks before making investment decisions. Past performance does not guarantee future results.
Report Date: December 22, 2025
Data Source: Gate Crypto Asset Database
Language: English
Share
How to Buy Cryptocurrency


Trending Cryptocurrencies


Aster to USDT Is Surging

KEKIUS vs RUNE: The Epic Clash of Titans in the Digital Realm

Is Sophon (SOPH) a good investment?: A comprehensive analysis of tokenomics, market potential, and risk factors for 2024

DEGEN Token Adoption Sees Rapid Growth with 500,000 Holders in Six Months

NKN (NKN) price soaring: What is the driving force behind the 2025 craze?

Pi Network Mainnet Launch and Future
2025 CAM Price Prediction: Expert Analysis and Market Forecast for the Coming Year

2025 DIMO Price Prediction: Expert Analysis and Market Forecast for the Decentralized IoT Movement Token
Detecting Pump and Dump Schemes in Cryptocurrency Markets
2025 SHPING Price Prediction: Expert Analysis and Market Forecast for the Coming Year
2025 VXT Price Prediction: Expert Analysis and Market Forecast for the Upcoming Year