Bitcoin cooled off from the $94,589 peak on Tuesday, but the bulls are still trying to keep prices above the key $92,000 level. Investors are now watching the market reaction after the Fed cut interest rates by 0.25% last night, also indicating plans for one more rate cut in 2026.
While some experts believe the bottom has formed, many warn that the current recovery is just a “dead cat bounce” – temporary and prone to panic selling. Colin Talks Crypto, an anonymous analyst on X, predicts Bitcoin could retreat to the $74,000–$77,000 zone if downward pressure persists.
Despite short-term volatility, Michael Saylor’s Strategy is not hesitating to increase Bitcoin holdings. Last week, they spent around $962.7 million to purchase an additional 10,624 BTC, at an average price of $90,615/BTC. Their total holdings now reach 660,624 BTC with an average purchase price of $74,696.
So, what are the important support levels for BTC and major altcoins now? Let’s analyze the charts of the top 10 cryptocurrencies to find the answer.
Technical Analysis of BTC
BTC closed above the 20-day exponential moving average (EMA) at $91,583 on Tuesday, but the bulls could not sustain the price above the resistance level of $94,150.
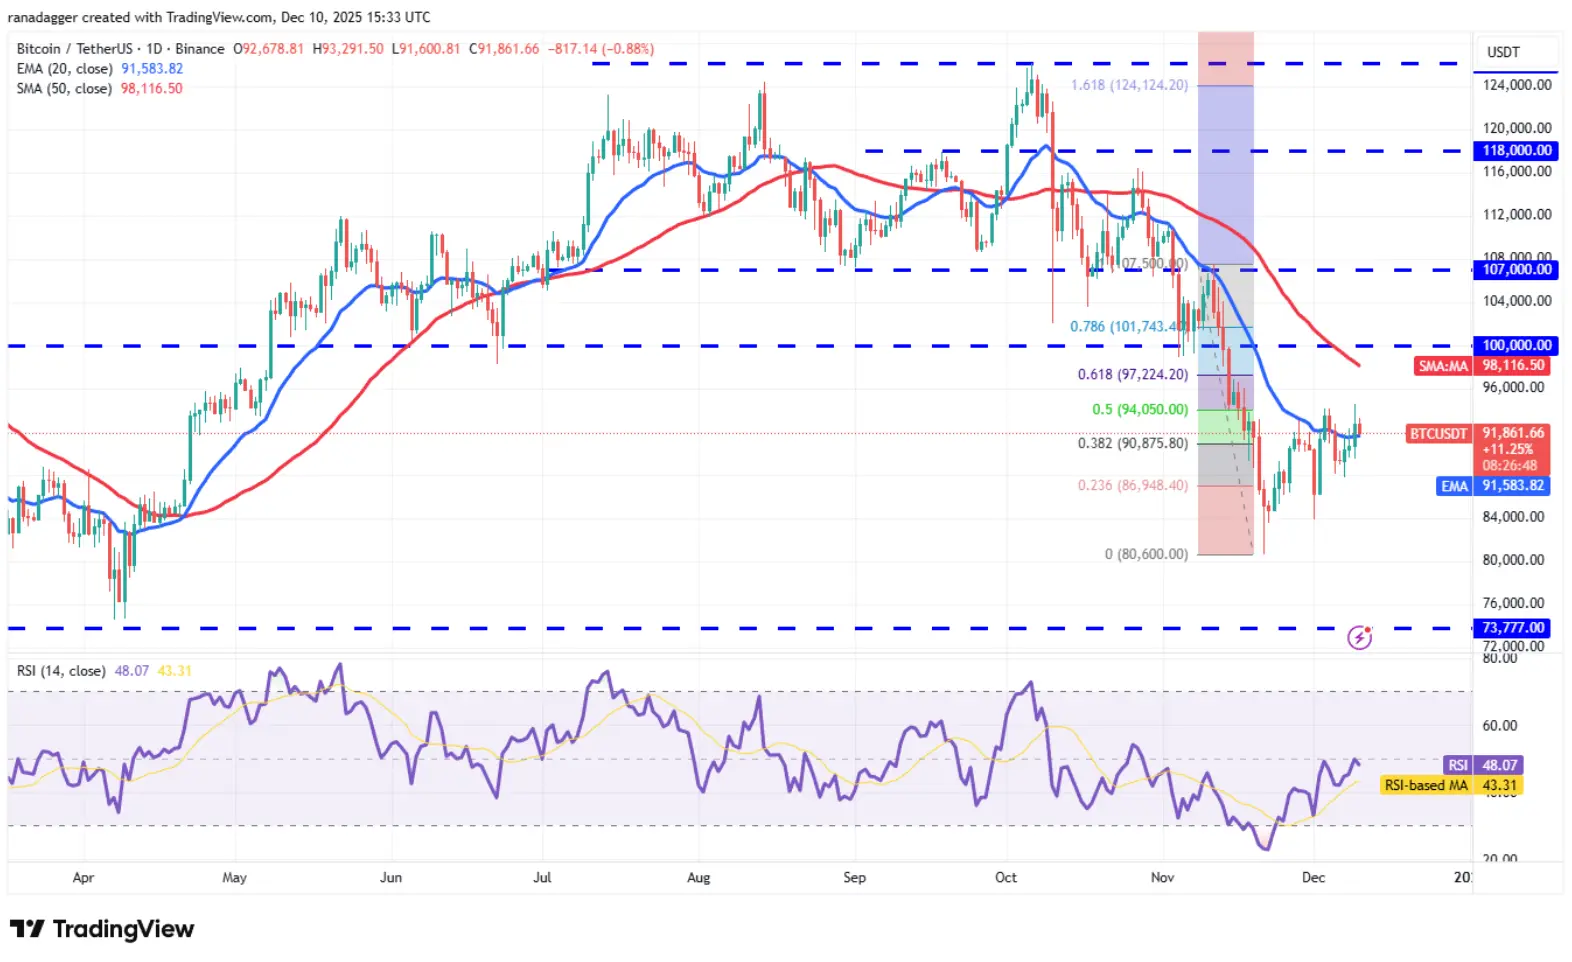 Daily BTC/USDT Chart | Source: TradingView If Bitcoin’s price bounces from the 20 EMA and closes above $94,589, it indicates a potential rally toward $100,000. Sellers are expected to strongly defend the $100,000 level, as a close above this could push the BTC/USDT pair toward $107,000. This suggests the correction phase may be over.
Conversely, if the price drops sharply and breaks below $87,719, it indicates that the bears are still selling into rallies. The pair could then slip to $83,822.
Technical Analysis of ETH
Ether has recovered to $3,332, touching the breakout level of $3,350, signaling strong buying at lower levels.
 Daily ETH/USDT Chart | Source: TradingView The 20-day EMA ($3,116) is gradually sloping up, and the RSI (RSI) is in positive territory, indicating bulls are trying to regain control. A close above $3,350 will open the door for a rise to $3,659 and then to $3,918.
Sellers will need to pull the price below the 20-day EMA to maintain an advantage. If they succeed, the $3,350 level will turn into resistance. The ETH/USDT pair could then decline to $2,716.
Technical Analysis of XRP
XRP has been trading below the 20-day EMA ($2.12) for several days, but the bears have yet to push the price below the support line of the descending channel pattern.
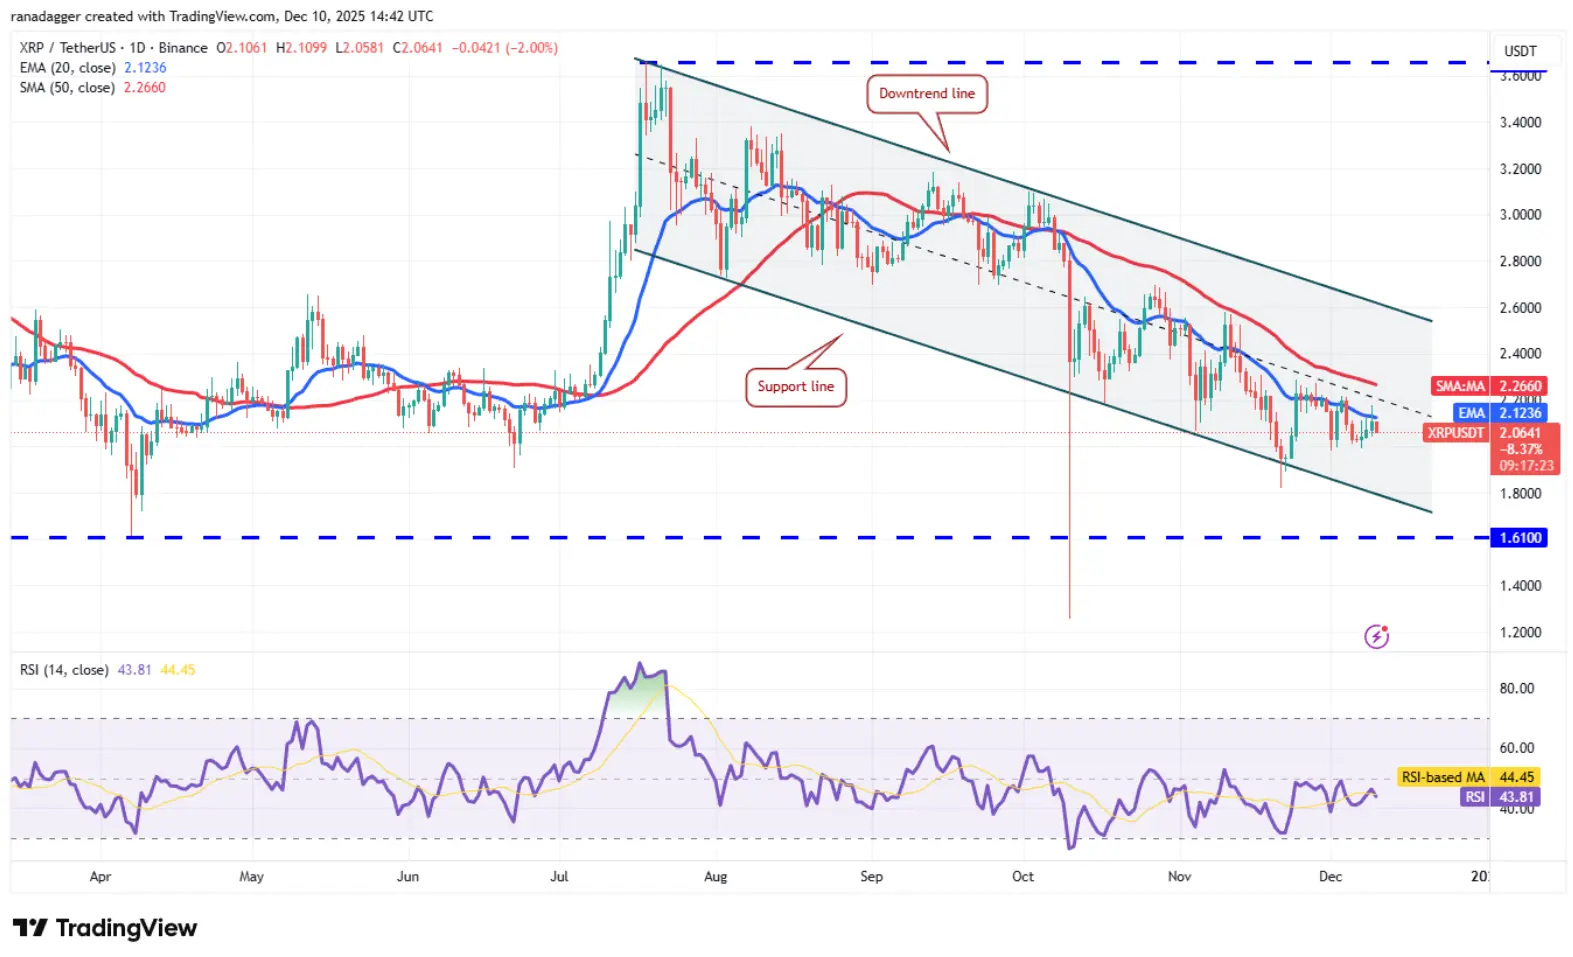 Daily XRP/USDT Chart | Source: TradingView Bulls will try to push the price above the 20 EMA to strengthen their position. If successful, the XRP/USDT pair could rise to the 50-day SMA ($2.26) and then to the downtrend line.
Alternatively, if the price drops and breaks below $1.98, it indicates that the bears are still in control. The pair could fall to the channel’s support line and continue toward $1.61.
Technical Analysis of BNB
BNB is witnessing a tense battle between the bulls and bears at the 20-day EMA ($894).
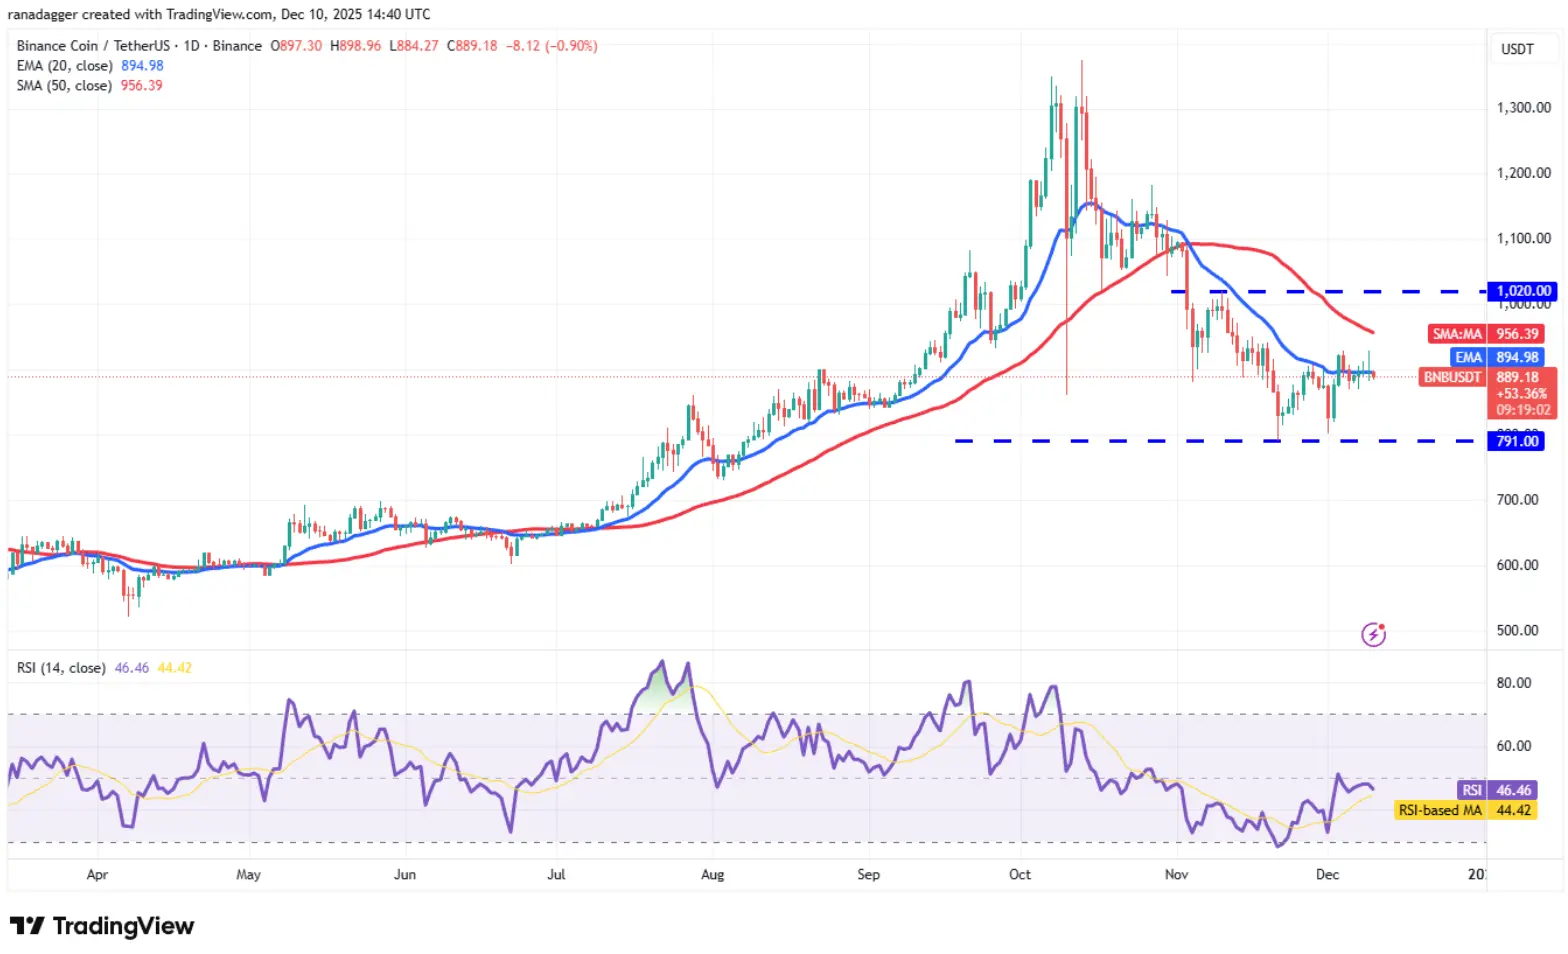 Daily BNB/USDT Chart | Source: TradingView The flat 20-day EMA and RSI just below the midpoint suggest a balance between supply and demand. BNB/USDT could oscillate within the $791–$1,020 range for the next few days.
Buyers need to push the price above $1,020 to signal that the correction phase might be over. Then, the pair could rise to $1,182. Conversely, a break below $791 could lead to a decline to $730.
Technical Analysis of SOL
Buyers are trying to hold SOL above the 20-day EMA ($138), but the bears remain resilient.
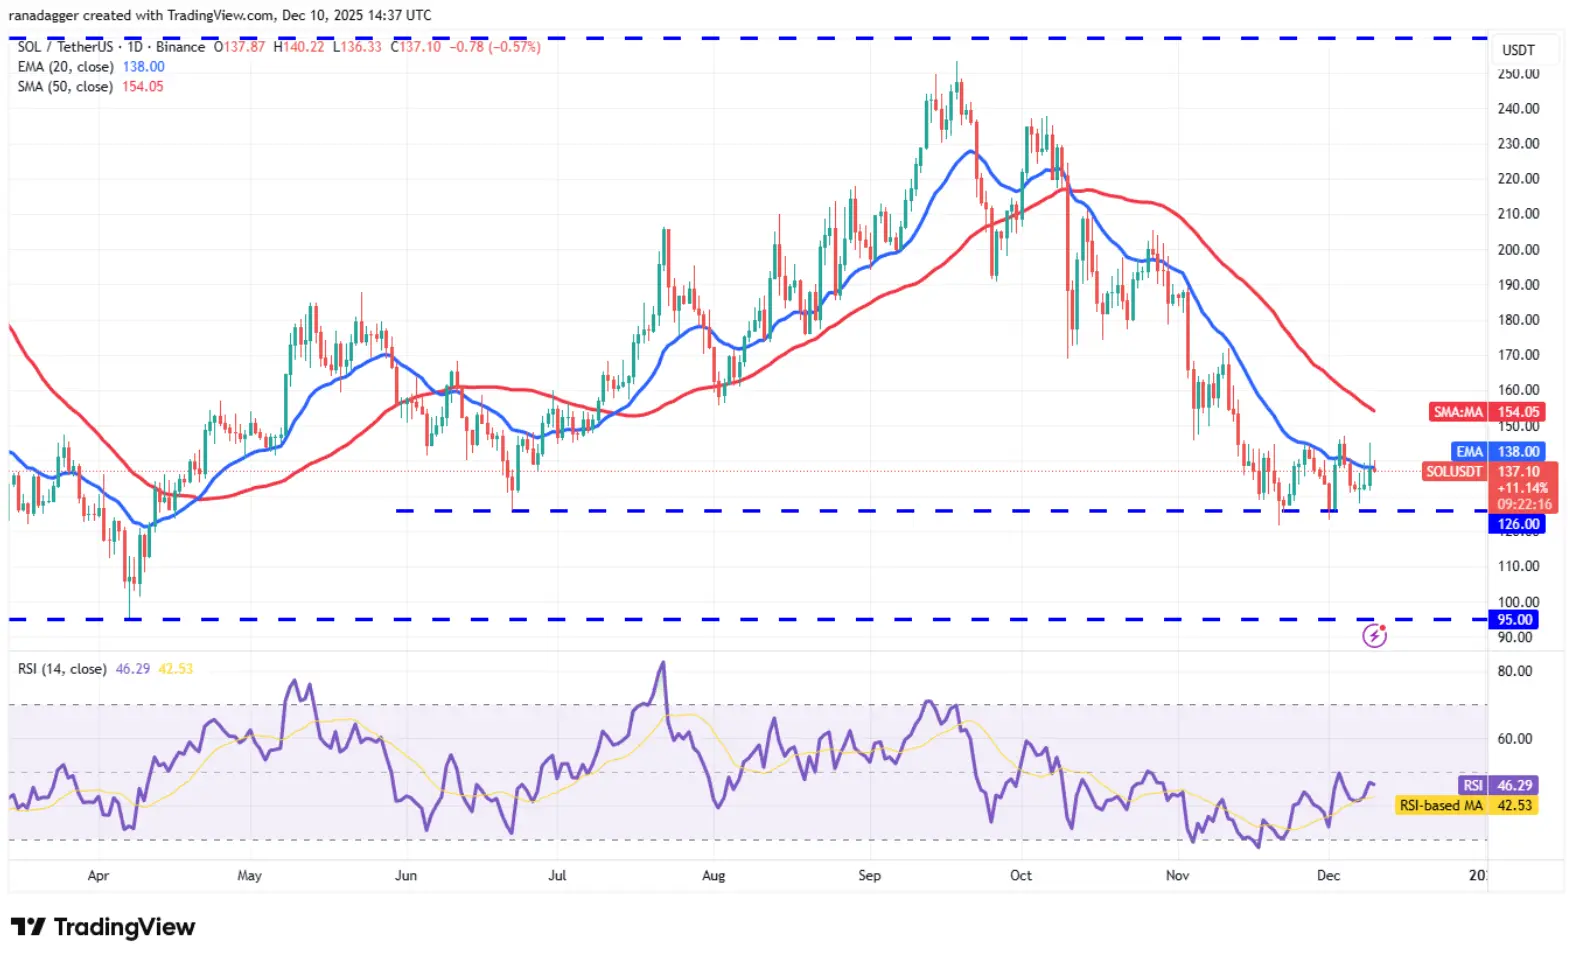 Daily SOL/USDT Chart | Source: TradingView The flat 20-day EMA and RSI just below the midpoint indicate weakening downward momentum. If buyers push past the resistance at the 20 EMA, the SOL/USDT pair could rise to the 50-day SMA ($154) and then to $172.
Conversely, a break and close below $126 would signal that Solana’s price could continue to decline, potentially falling $110 and then supported at $95.
Technical Analysis of DOGE
Buyers successfully protected the support at $0.14 but are having difficulty maintaining prices above the 20-day EMA ($0.15).
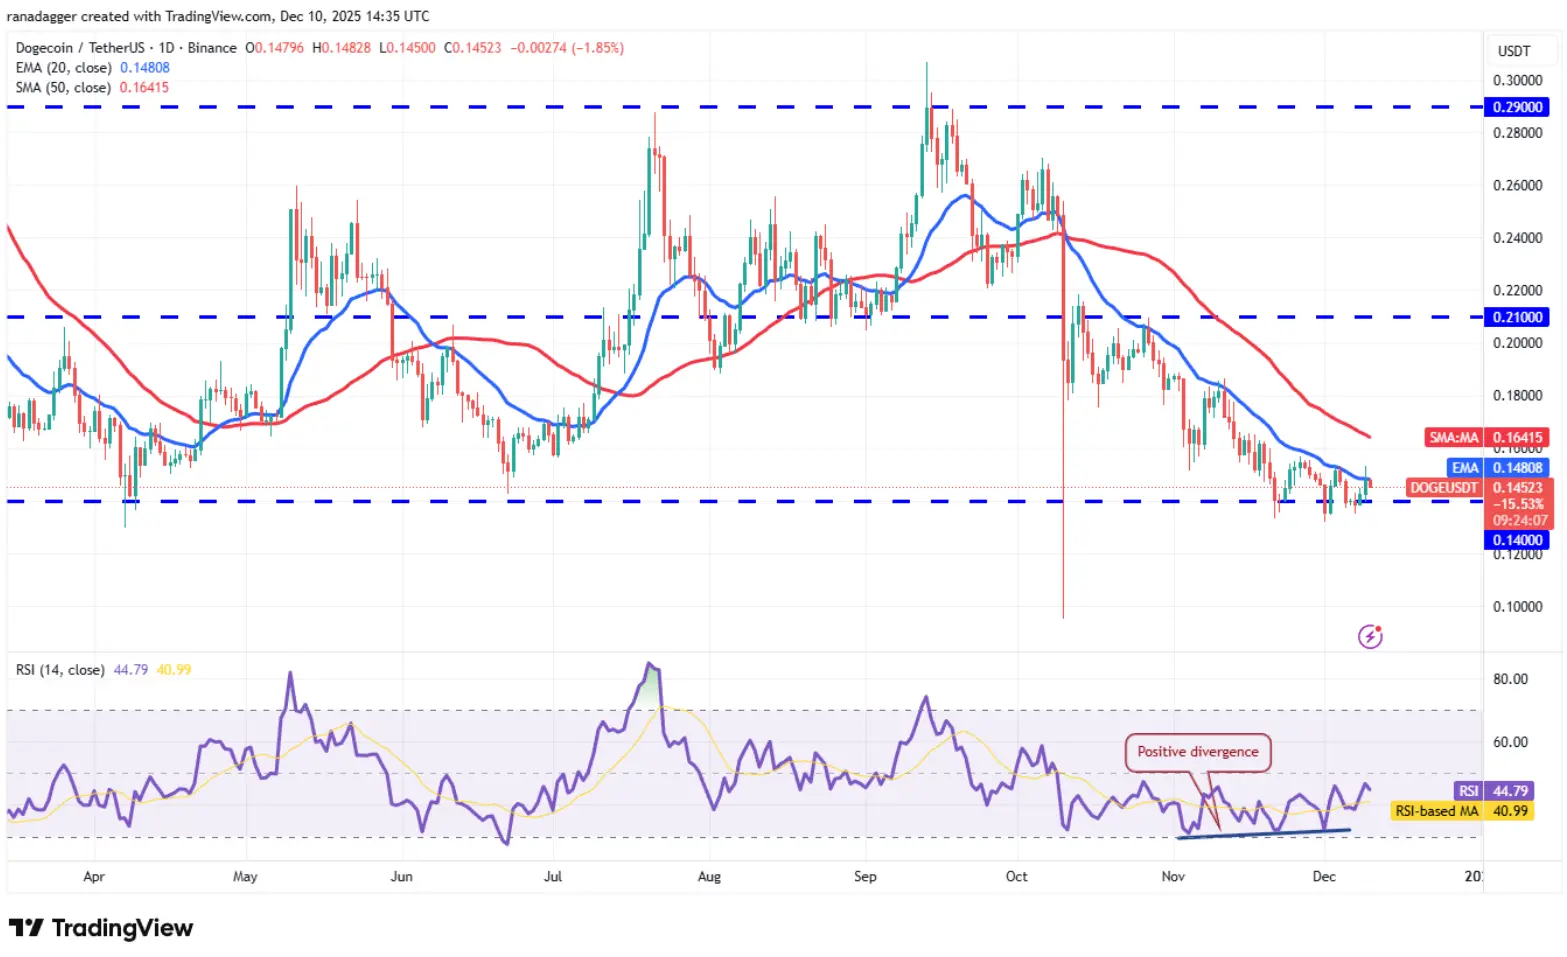 Daily DOGE/USDT Chart | Source: TradingView If the price drops sharply from the 20 EMA and breaks below $0.14, it indicates that the bears are still in control. DOGE could then fall back to the October 10 low of $0.10.
Alternatively, if buyers push the price above the 20 EMA, the DOGE/USDT pair could rise to the 50-day SMA ($0.16). This is an important level the bears need to defend, as a break below it could open the path for a recovery to $0.21.
Technical Analysis of ADA
Cardano (ADA) broke above the 20-day EMA ($0.44) on Tuesday, indicating decreasing selling pressure.
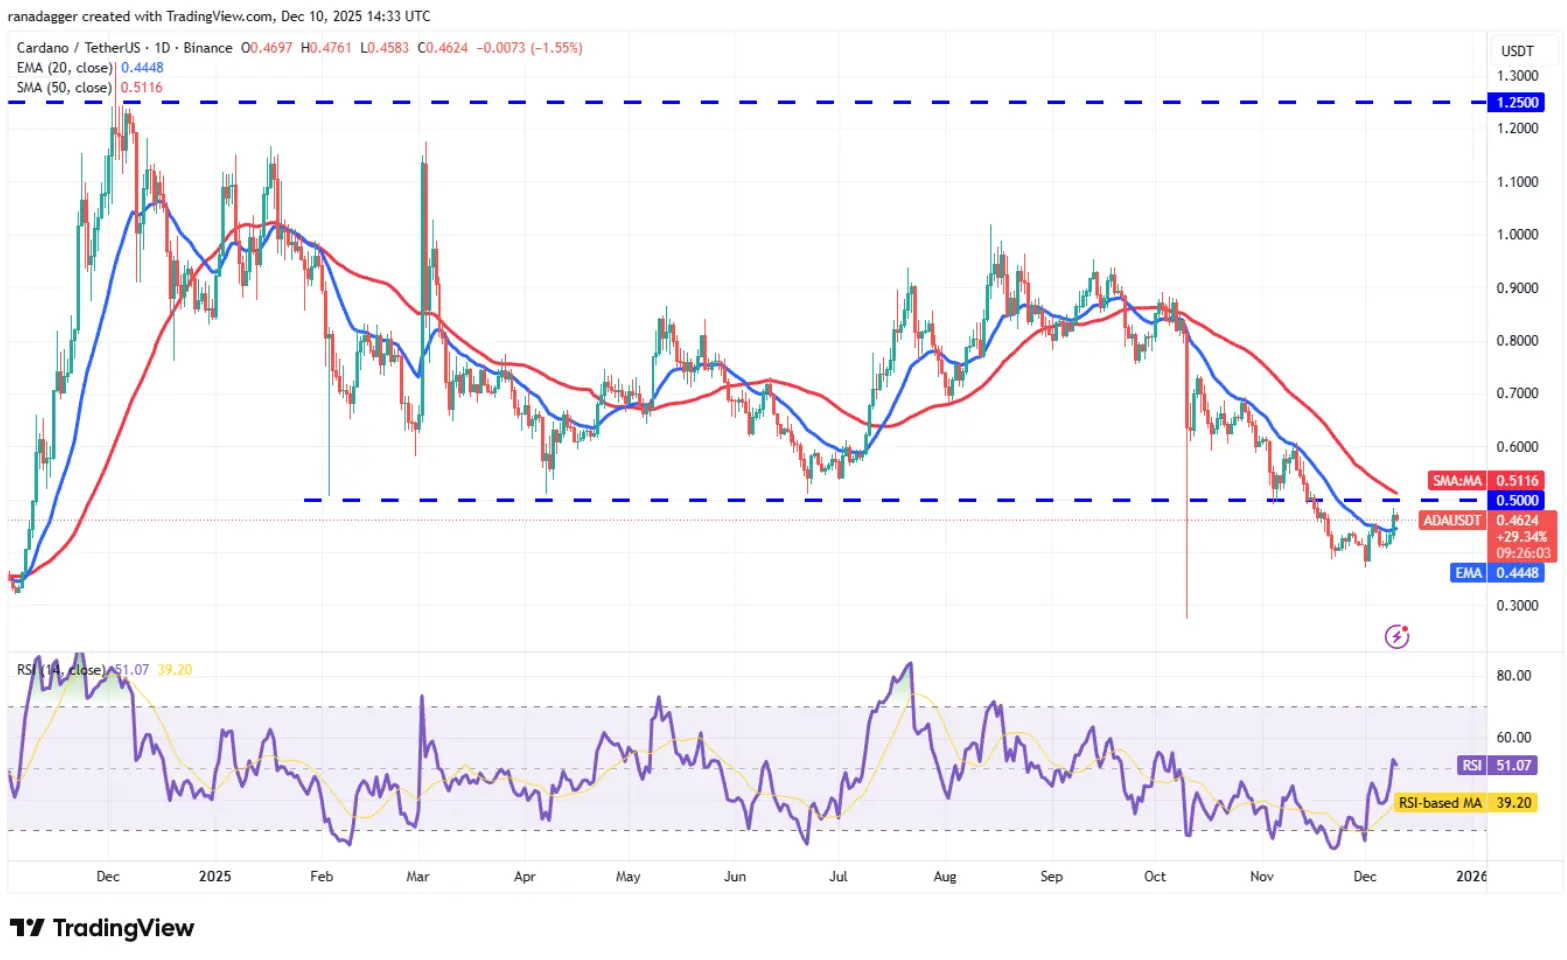 Daily ADA/USDT Chart | Source: TradingView Bulls will attempt to recover by pushing Cardano above the 50-day SMA ($0.51). If successful, ADA/USDT could climb to $0.60 and then to $0.70.
Alternatively, a sharp decline from the breakout level of $0.50 and a fall below the 20 EMA would suggest that the bears have turned this level into resistance. The pair could then decline to $0.37.
Technical Analysis of BCH
Bitcoin Cash (BCH) has declined from the resistance level $607 on Monday, indicating reduced demand at higher prices.
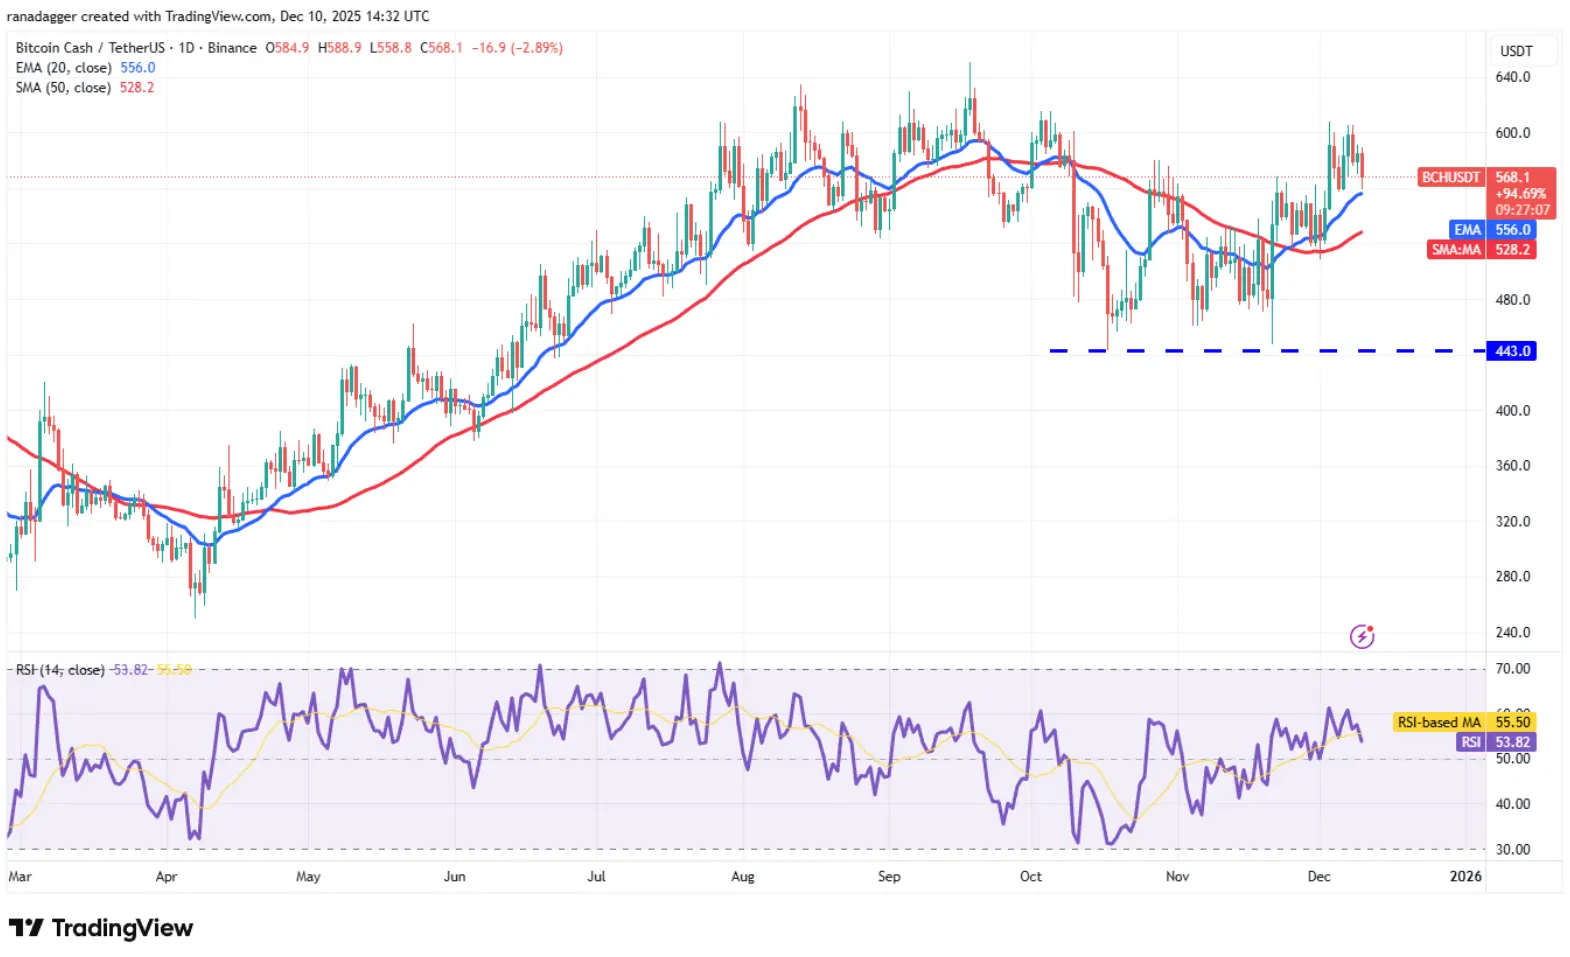 Daily BCH/USDT Chart | Source: TradingView The bears are attempting to pull BCH below the 20-day EMA ($556). If successful, BCH/USDT could slide to the 50-day SMA ($528) and further down to $508.
Otherwise, buyers will need to defend the 20-day EMA and push the price above $607 to maintain an advantage. Then, the pair could rally to $615 and continue toward $651, where bears are expected to appear.
Technical Analysis of LINK
Chainlink’s (LINK) recovery is facing selling pressure at the 50-day SMA ($14.84), indicating bears are active at higher levels.
 Daily LINK/USDT Chart | Source: TradingView Bulls are expected to defend the 20-day EMA ($13.79), as a break below this could lead to a decline to the critical support at $10.94.
If the price rebounds from the 20 EMA, the likelihood of breaking the 50-day SMA increases. If that happens, Chainlink could regain momentum and rise to $16.90, then to $19.06. This suggests the pair might stay within a larger range from $10.94 to $27 for some more time.
Technical Analysis of HYPE
Hyperliquid (HYPE) closed below the support at $29.37 on Tuesday, but the lower levels are attracting buyers.
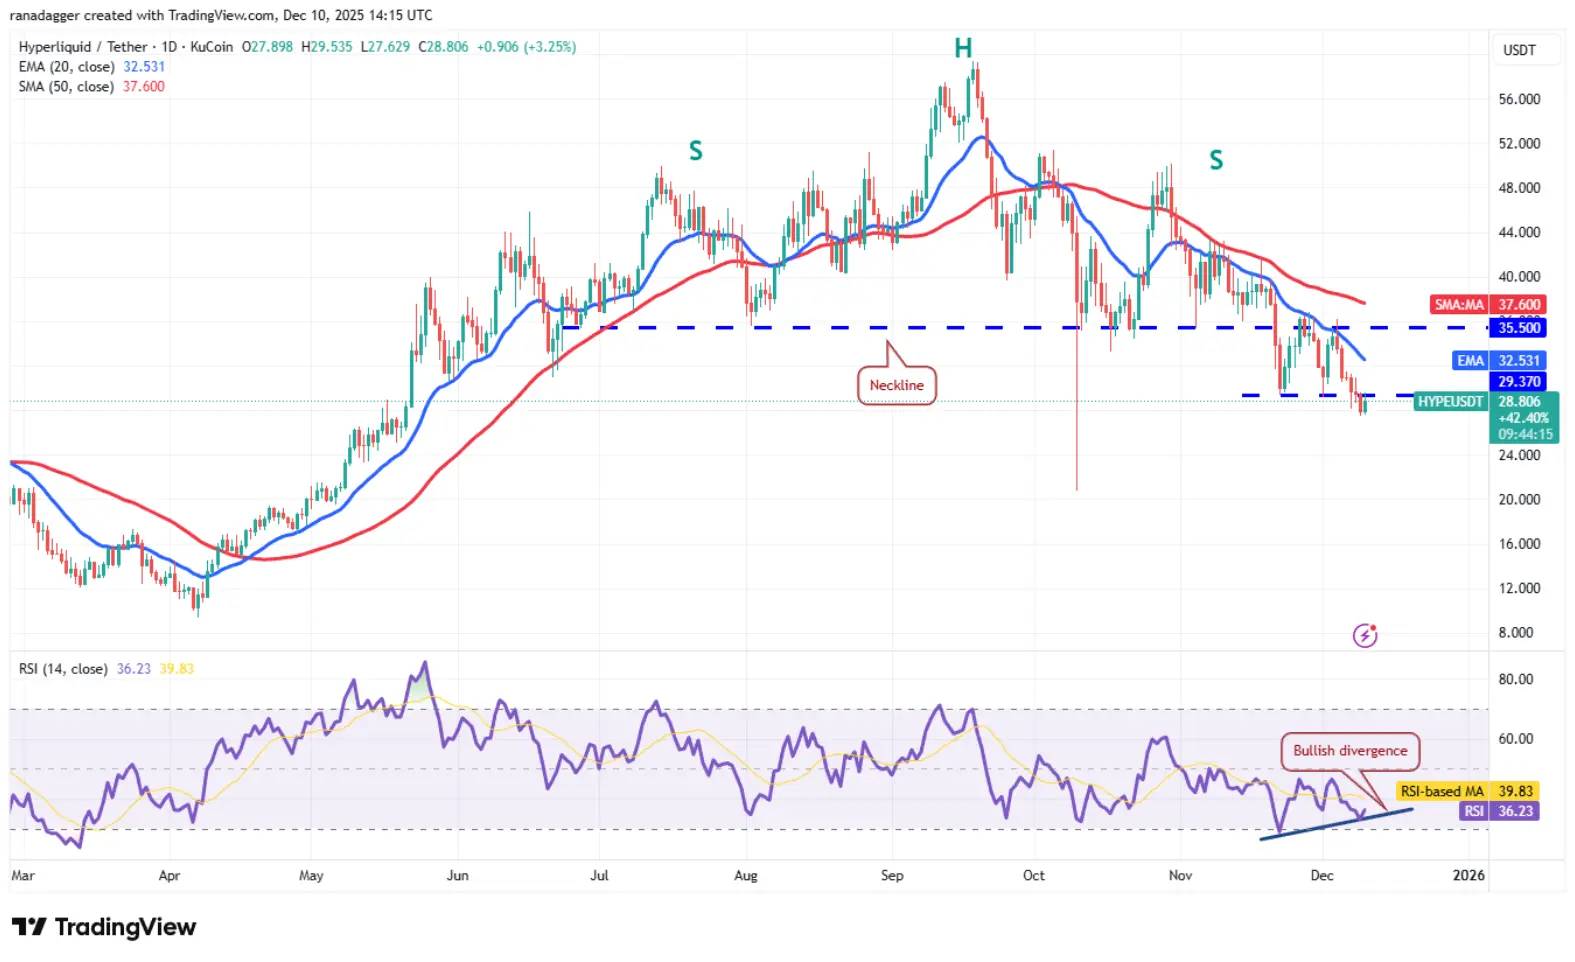 Daily HYPE/USDT Chart | Source: TradingView The RSI is showing early signs of bullish divergence, indicating selling pressure is easing. HYPE/USDT is expected to strengthen if buyers push the price above the 20-day EMA ($32.53).
Conversely, if Hyperliquid’s price drops from the current level or below the 20-day EMA, it indicates that bears continue to sell into rallies. This increases the risk of a decline to the October 10 low of $20.82.

