Trade
Basic
Futures
Futures
Hundreds of contracts settled in USDT or BTC
TradFi
Gold
Trade global traditional assets with USDT in one place
Options
Hot
Trade European-style vanilla options
Unified Account
Maximize your capital efficiency
Demo Trading
Futures Kickoff
Get prepared for your futures trading
Futures Events
Participate in events to win generous rewards
Demo Trading
Use virtual funds to experience risk-free trading
Earn
Launch
CandyDrop
Collect candies to earn airdrops
Launchpool
Quick staking, earn potential new tokens
HODLer Airdrop
Hold GT and get massive airdrops for free
Launchpad
Be early to the next big token project
Alpha Points
Trade on-chain assets and enjoy airdrop rewards!
Futures Points
Earn futures points and claim airdrop rewards
Investment
Simple Earn
Earn interests with idle tokens
Auto-Invest
Auto-invest on a regular basis
Dual Investment
Buy low and sell high to take profits from price fluctuations
Soft Staking
Earn rewards with flexible staking
Crypto Loan
0 Fees
Pledge one crypto to borrow another
Lending Center
One-stop lending hub
VIP Wealth Hub
Customized wealth management empowers your assets growth
Private Wealth Management
Customized asset management to grow your digital assets
Quant Fund
Top asset management team helps you profit without hassle
Staking
Stake cryptos to earn in PoS products
Smart Leverage
New
No forced liquidation before maturity, worry-free leveraged gains
GUSD Minting
Use USDT/USDC to mint GUSD for treasury-level yields
More
BasheerAlgundubi
No content yet
Pin
BasheerAlgundubi
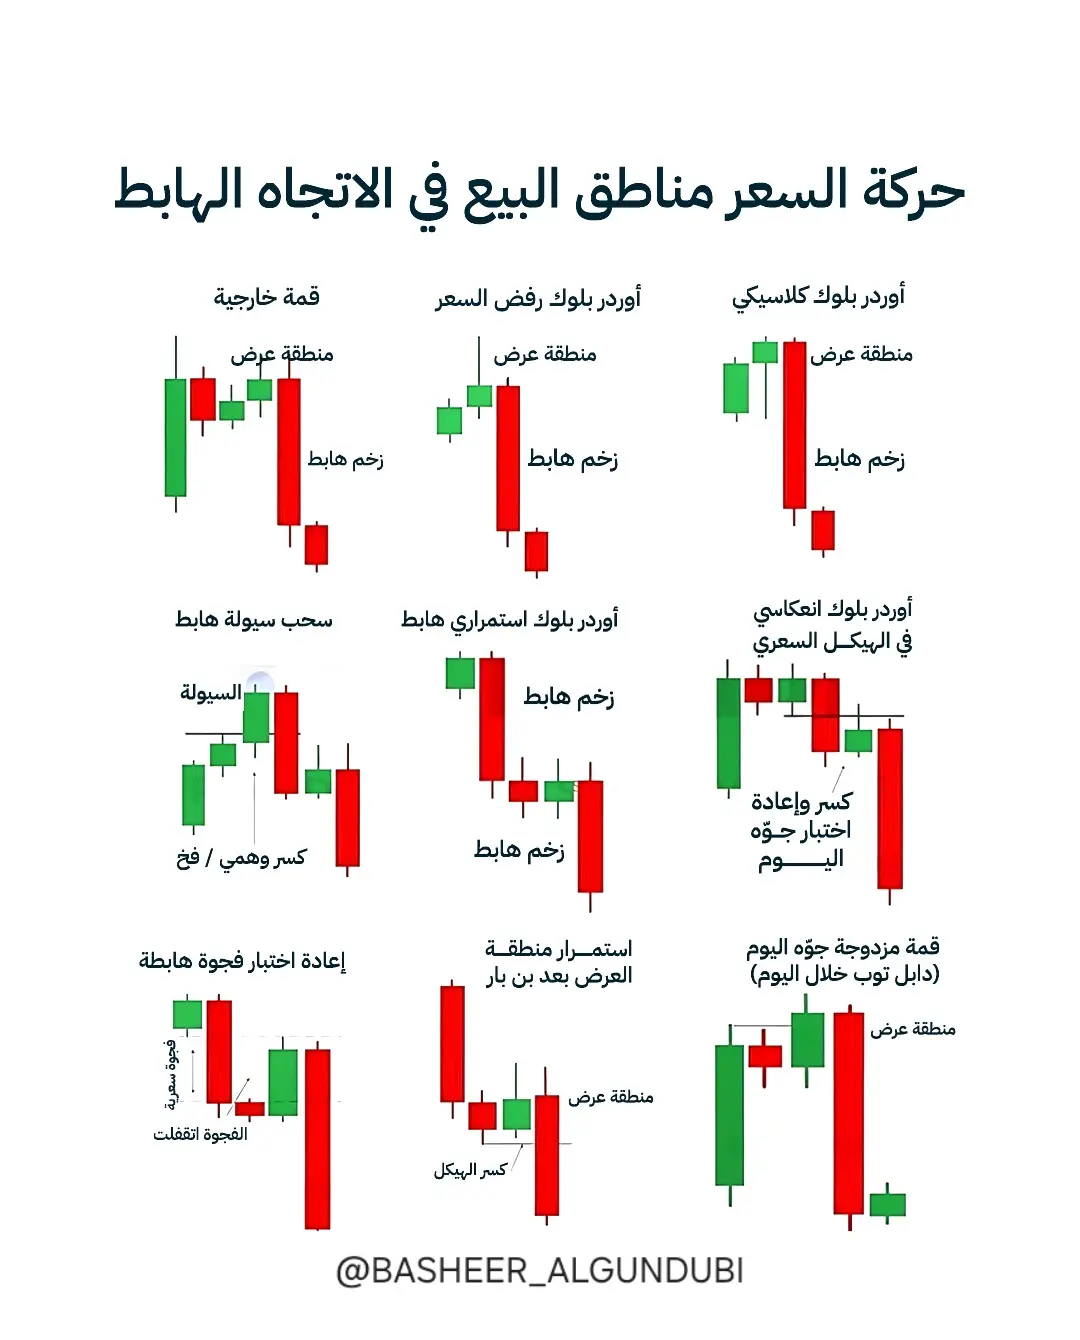
#أقوى.مناطق.البيع + Confirmation Signals + Formation of the Bearish Reversal
In this post, I’ve gathered the most important real patterns that institutions typically draw before any strong downward movement:
📌 Pages 1–2:
Types of supply zones that the market always returns to before a decline
– Structure Break
– Liquidity Pull
– Order Block
– Price Gaps (FVG)
Each pattern is explained simply and easily to understand.
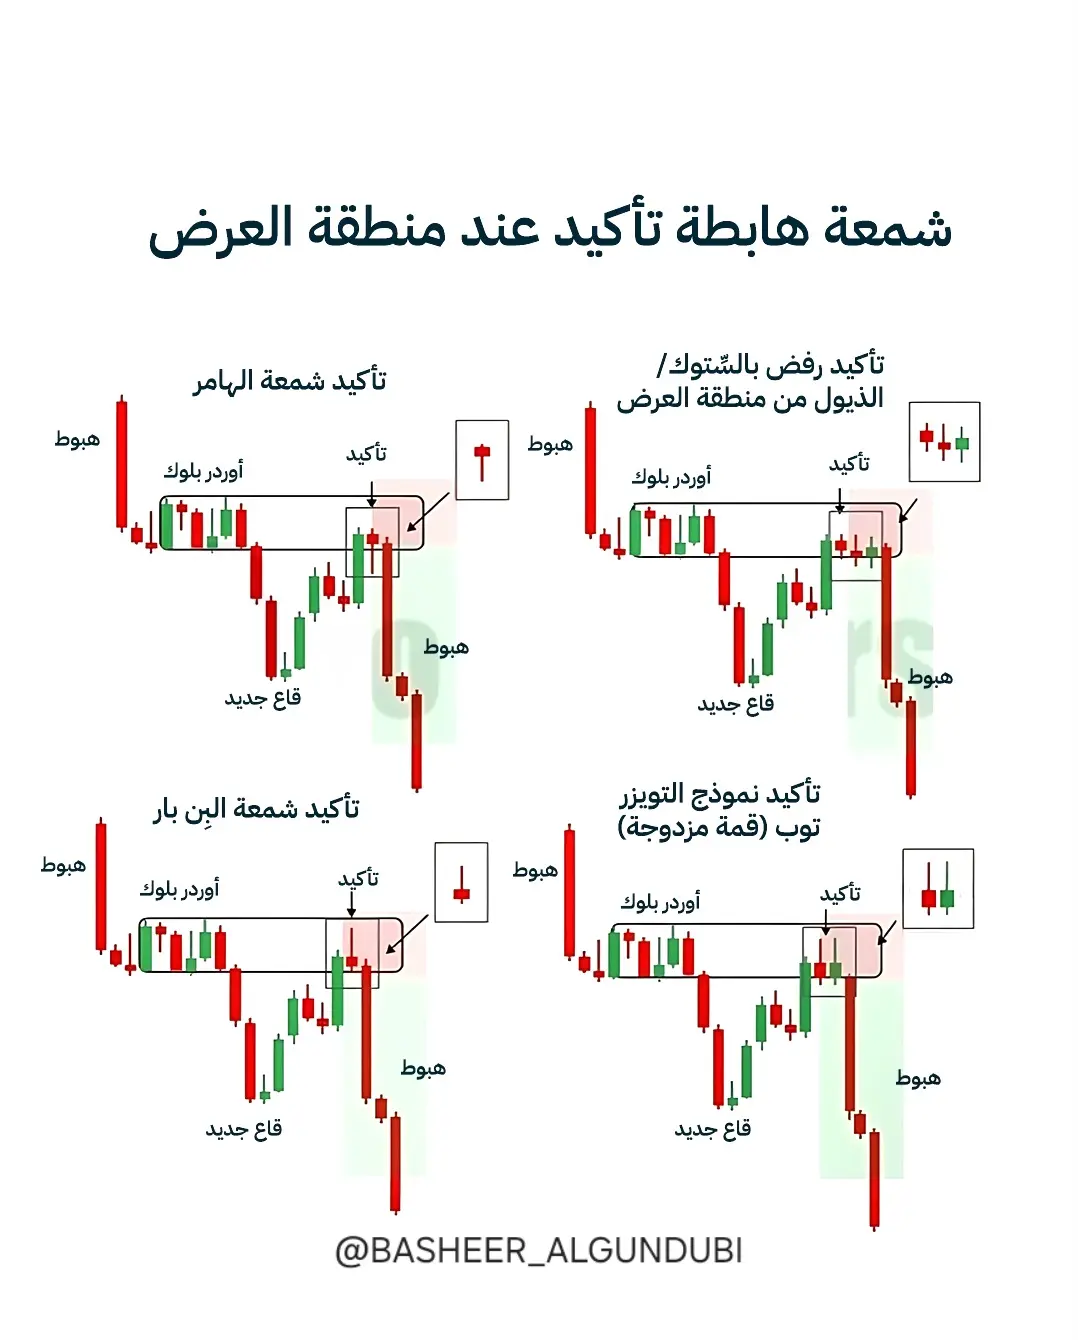
📌 Pages 3–4:
Candlestick signals that confirm the supply zone will indeed activate
– Hammer Candle
– Inside Bar
– Price Rejection
– Tweezer Pattern
This way, you can enter conf
View OriginalIn this post, I’ve gathered the most important real patterns that institutions typically draw before any strong downward movement:
📌 Pages 1–2:
Types of supply zones that the market always returns to before a decline
– Structure Break
– Liquidity Pull
– Order Block
– Price Gaps (FVG)
Each pattern is explained simply and easily to understand.
📌 Pages 3–4:
Candlestick signals that confirm the supply zone will indeed activate
– Hammer Candle
– Inside Bar
– Price Rejection
– Tweezer Pattern
This way, you can enter conf
- Reward
- 3
- 2
- Repost
- Share
ybaser :
:
Wait and see cautiously 🔍View More
#BTCUSDT – Recovery May Continue
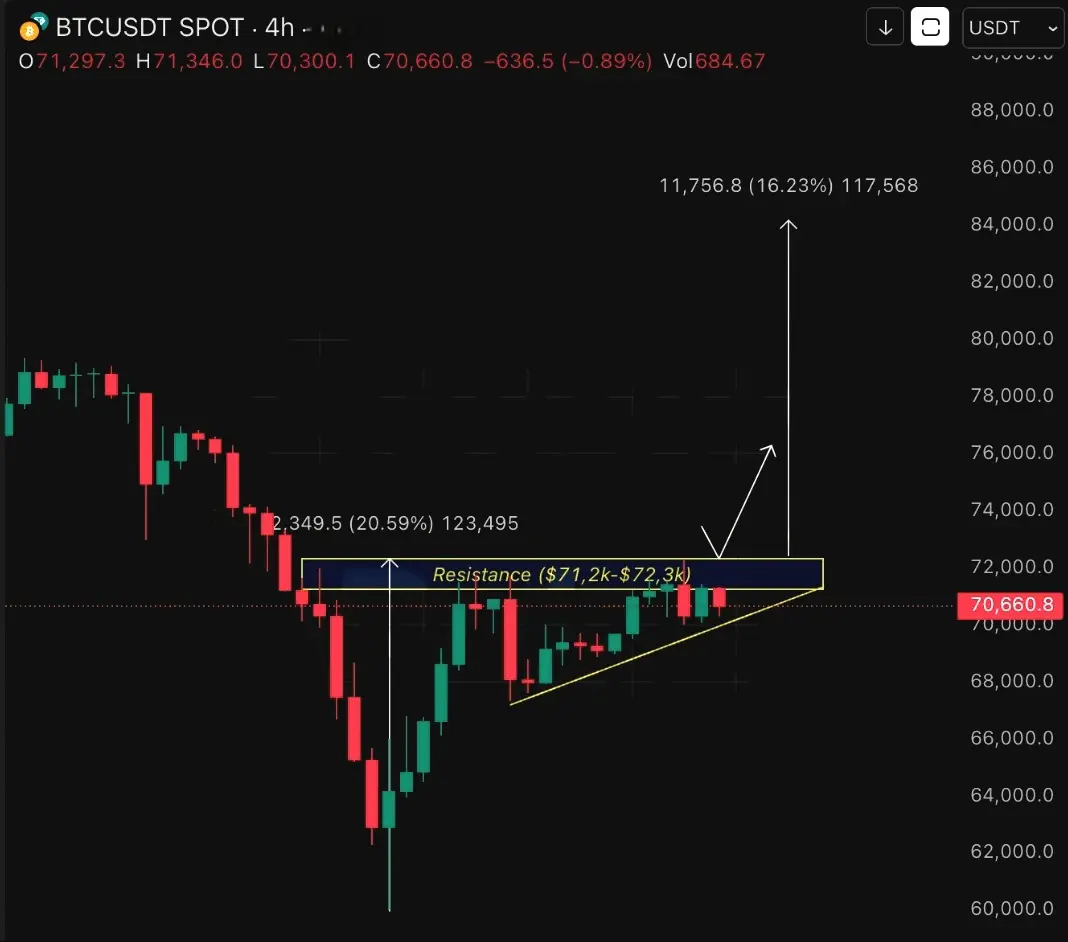
On the four-hour timeframe, Bitcoin's price has surged strongly from around $60,000 and is now consolidating within an ascending triangle pattern, with resistance at the $71,200 - $72,300 level.
A breakout above this level could open the door for a price increase toward $84,000.
Join us for more technical analyses, important news, key market events, discussions, and much more – click Follow on our profile page.
#BitcoinBouncesBack
#Bitcoin
#BTC
$BTC
BTC-0,83%
- Reward
- 2
- 2
- Repost
- Share
BasheerAlgundubi:
Breaking this level could open the way for the price to rise toward $84,000.View More
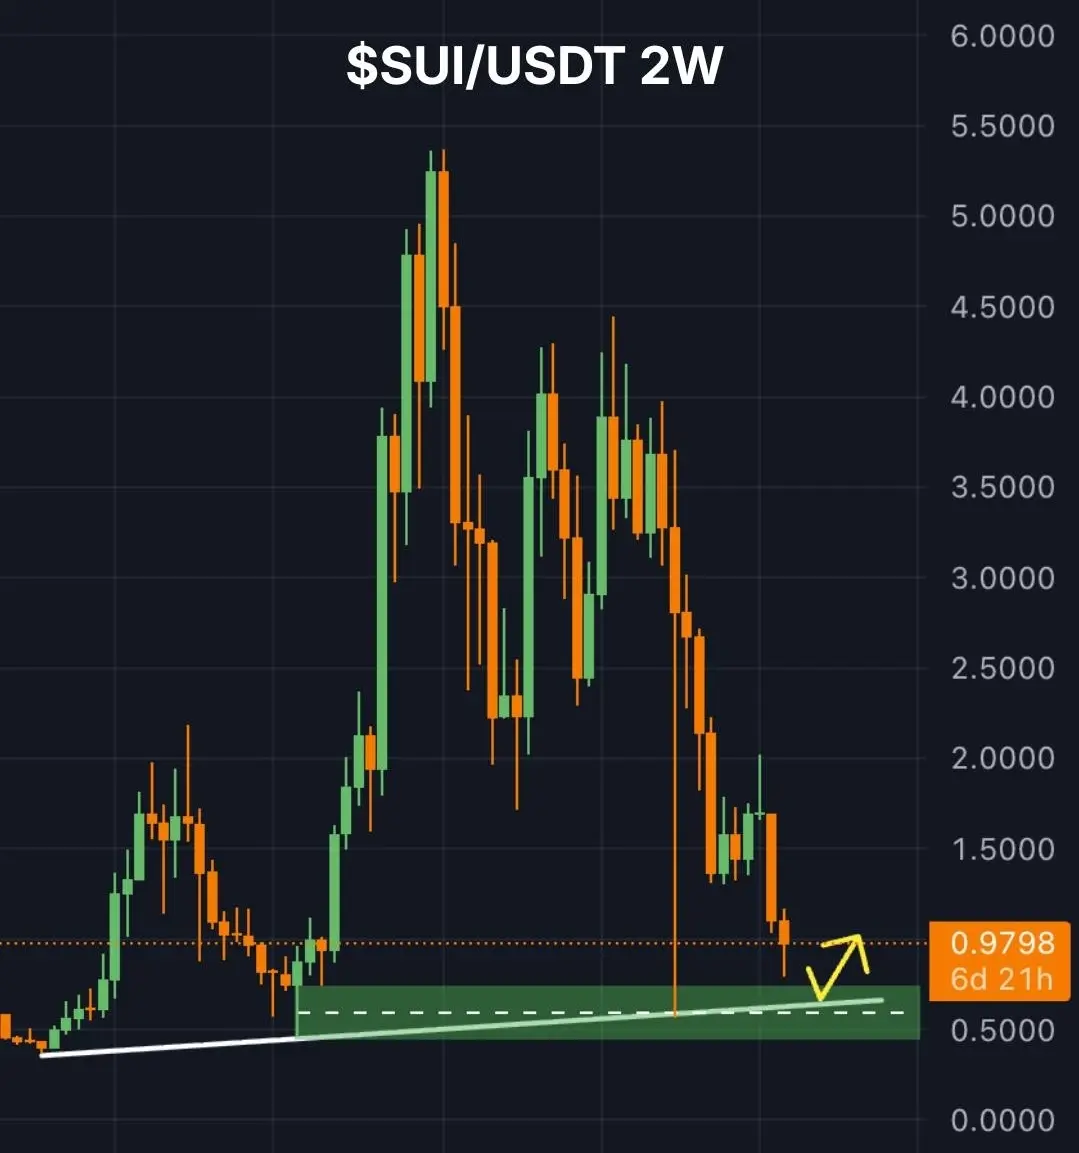
⚠️ Stock #SUIUSDT Approaching Long-Term Critical Support Level
The stock $SUI is consolidating after a sell-off, but market indicators still suggest further decline, with a maximum potential drop to $0.5-$0.7.
Any positive rebound could target a weekly range of $1.7-$2.
Join us for more technical analyses, important news, key market events, discussions, and much more – click Follow on our profile page.
#BuyTheDipOrWaitNow?
#SUI
$SUI
SUI-1,24%
- Reward
- 2
- 2
- Repost
- Share
BasheerAlgundubi:
Any positive rebound may target the 1.7-2 dollar range weekly.View More
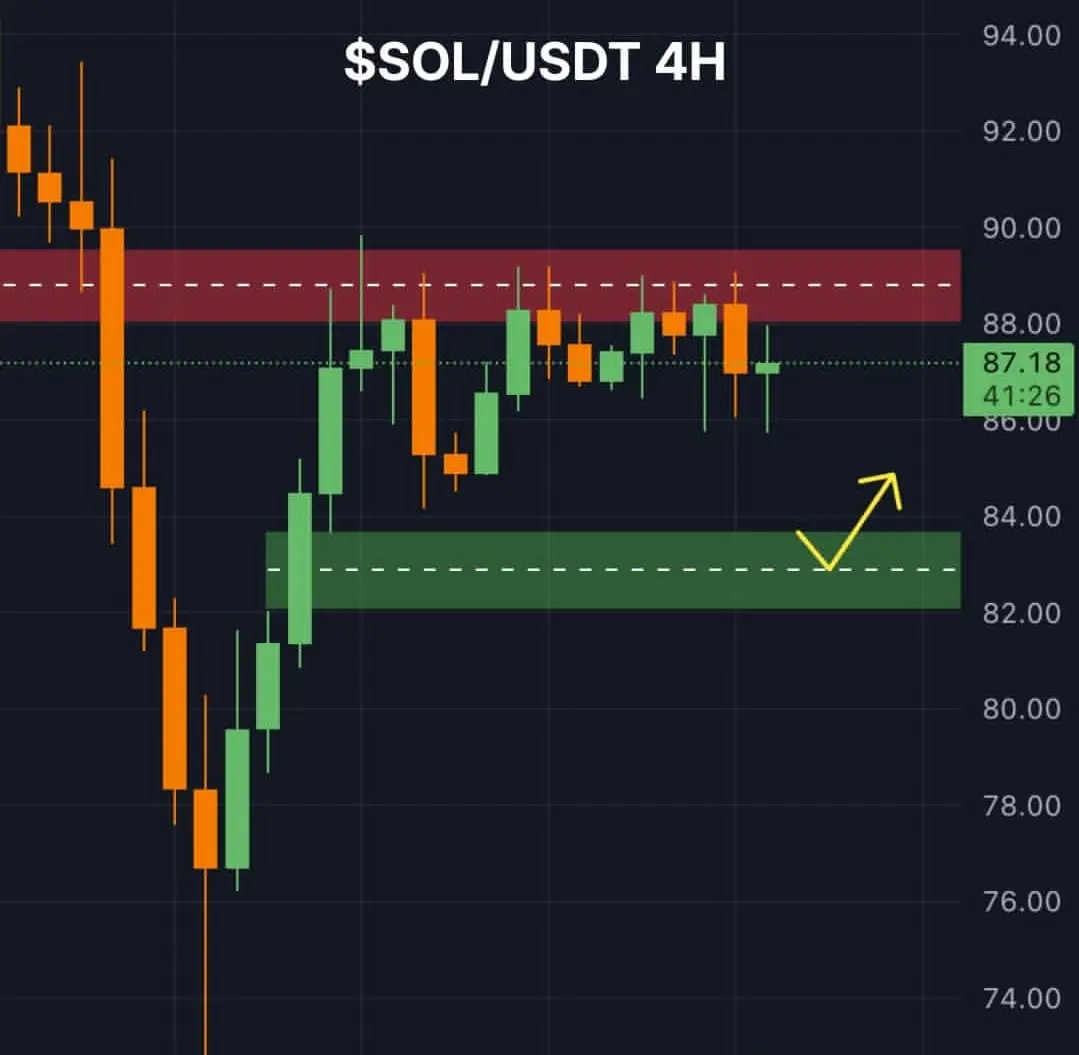
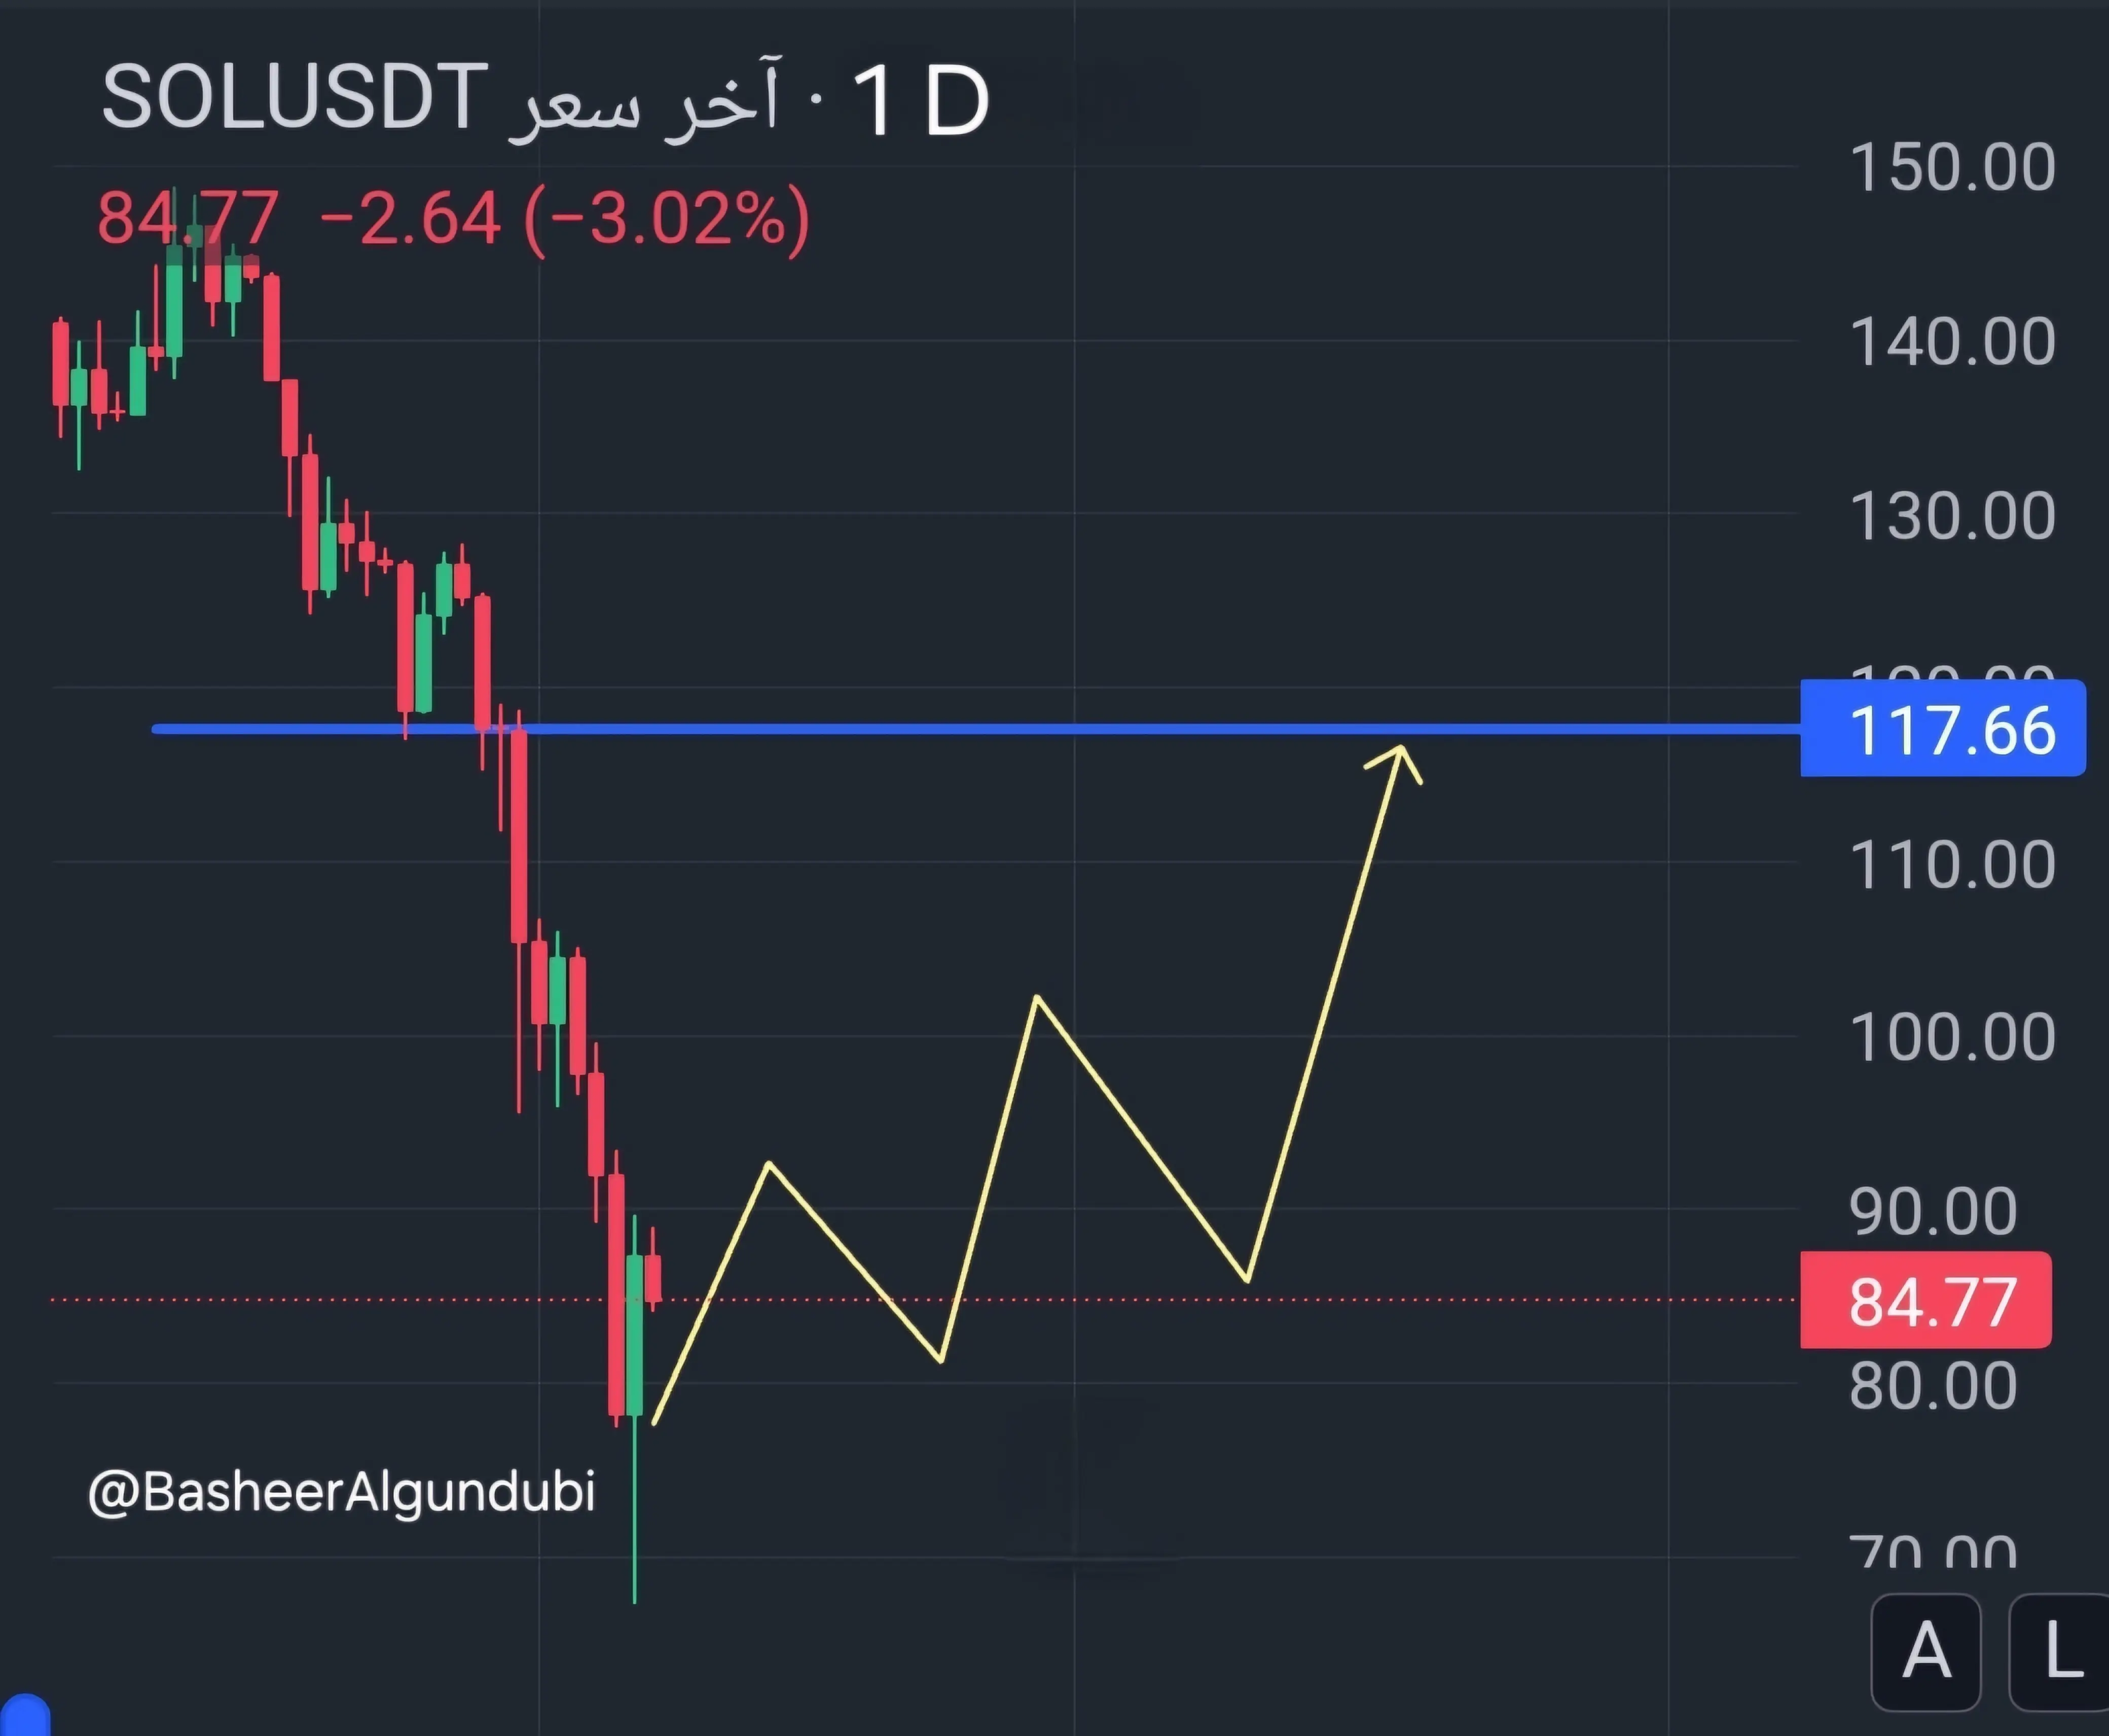
Share #SOLUSDT hovers below a major resistance level ⚠️
There is a suitable price margin around $83, and the price may retest it before any upward movement.
A strong rebound from this level could pave the way for a new test of the $90 level, with a possibility of a price collapse below $80 ❌
Join us for more technical analyses, important news, key market events, discussions, and much more - click Follow on our profile page.
#Solana
#SOL
$SOL
SOL0,32%
- Reward
- 2
- 5
- Repost
- Share
BasheerAlgundubi:
A strong rebound from this level could pave the way for a new test of the $90 level, with a potential price collapse below $80 ❌View More
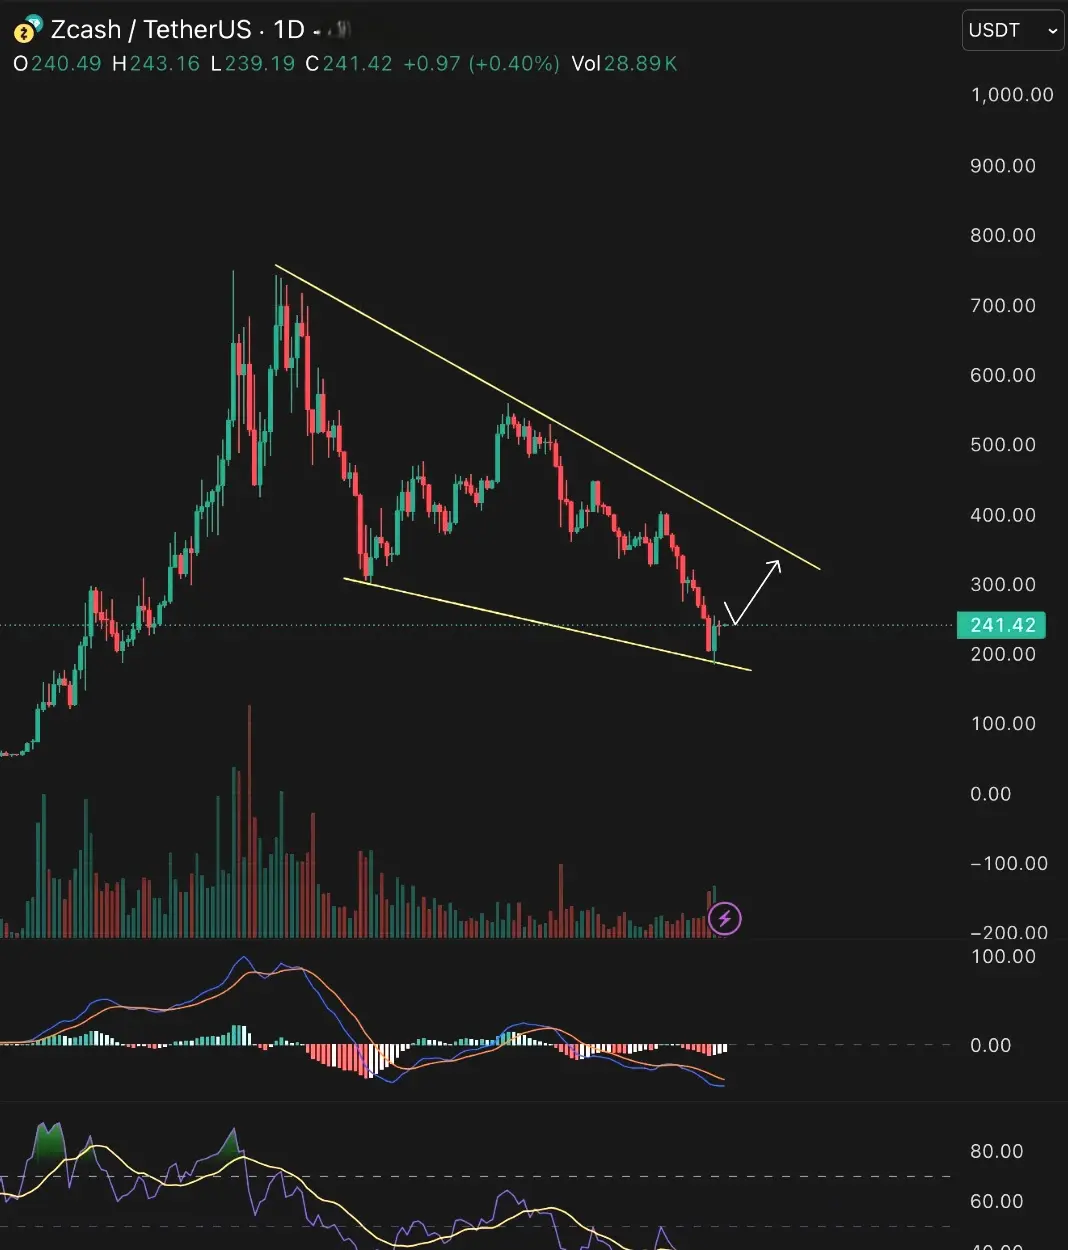
#ZECUSDT – Reaccumulation Phase?
The $ZEC stock looks interesting on the daily chart. The price is currently fluctuating within a descending wedge pattern after the rally since October 1, 2025, which is a continuation pattern.
It seems we are in a reaccumulation phase, with the potential to rise toward the resistance level of $320-330.
Join us for more technical analyses, important news, key market events, discussions, and much more – click follow on our profile page.
#Zcash
#ZEC
$ZEC
ZEC0,64%
- Reward
- 4
- 2
- Repost
- Share
BasheerAlgundubi:
It seems we are in a reassembly phase, with the potential to rise towards the resistance level of $320-330.View More
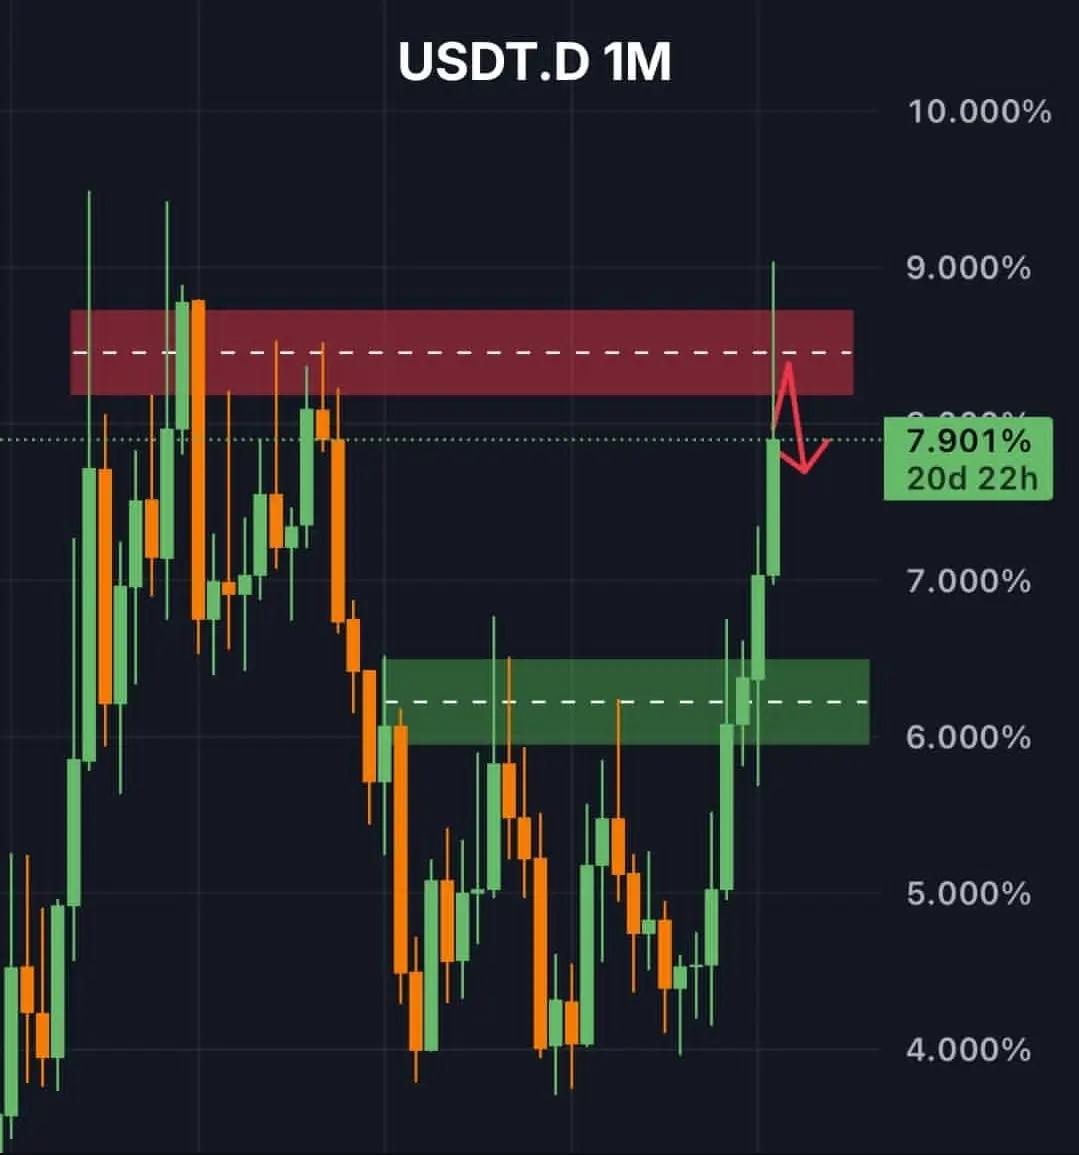
The USDT.D pair faces higher resistance on the ⚠ timeframe.
It seems that a pullback toward the support zone of 6.3-6.4% is most likely first, and until then, a rebound rally in the cryptocurrency market may continue 📈
#USDT
#BuyTheDipOrWaitNow?
View OriginalIt seems that a pullback toward the support zone of 6.3-6.4% is most likely first, and until then, a rebound rally in the cryptocurrency market may continue 📈
#USDT
#BuyTheDipOrWaitNow?
- Reward
- 3
- 2
- Repost
- Share
BasheerAlgundubi:
The USDT.D pair faces higher resistance on the ⚠ timeframe. It seems that a pullback toward the support zone of 6.3-6.4% is most likely first, and until then, a rebound rally in the cryptocurrency market may continue 📈.
View More
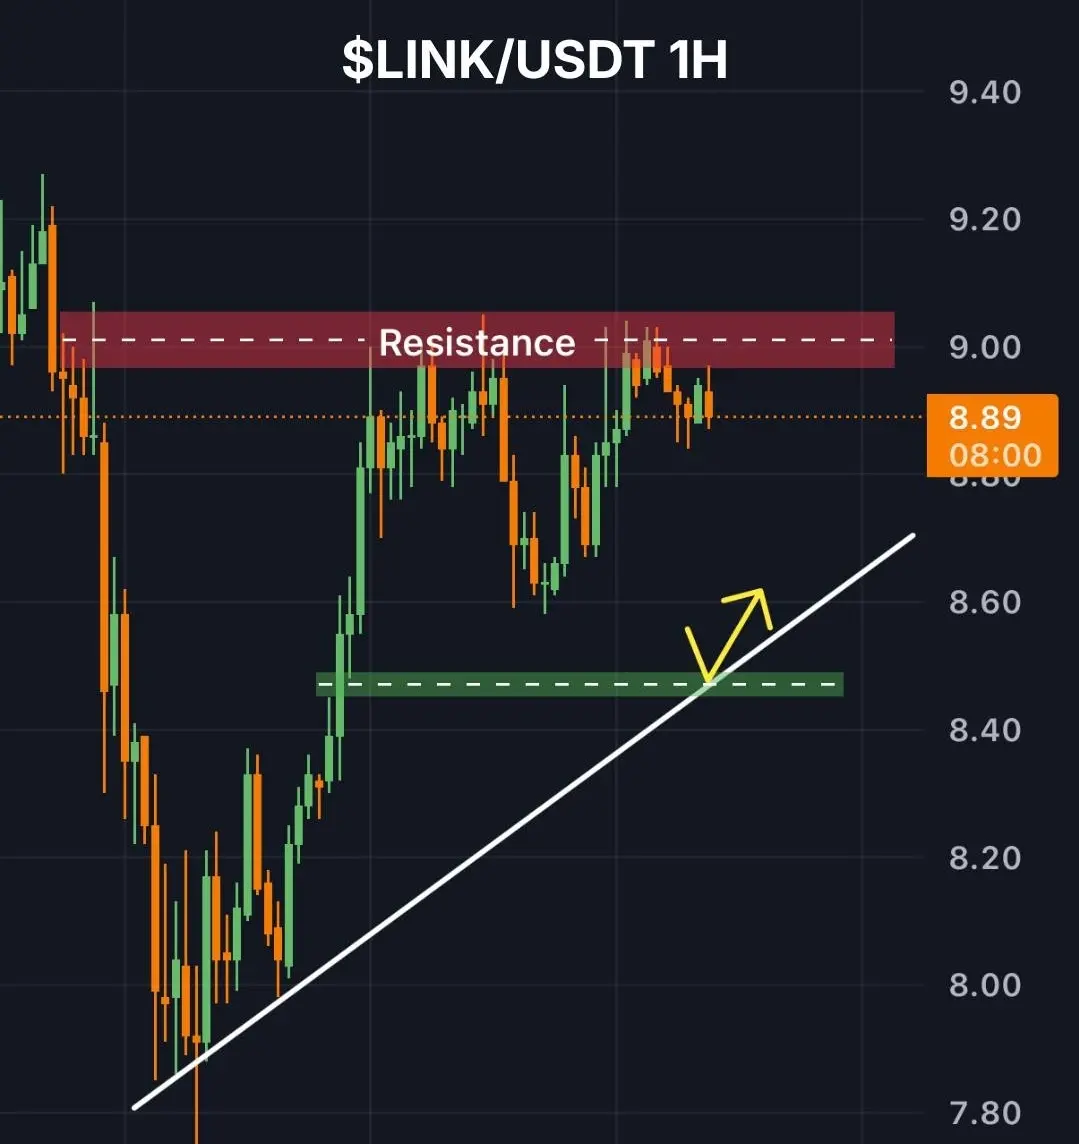
Share #LINKUSDT declines below the resistance level ⚡
Share $LINK forms an ascending triangle, pressing against the resistance level while maintaining higher lows.
The nearest support level is at the fair value gap around $8.46-8.48, which also coincides with the support level of the ascending triangle 📈
Join us for more technical analyses, important news, key market events, discussions, and much more — click Follow on our profile page to stay updated.
#Chainlink
#LINK
$LINK
LINK0,34%
- Reward
- 1
- 1
- Repost
- Share
BasheerAlgundubi:
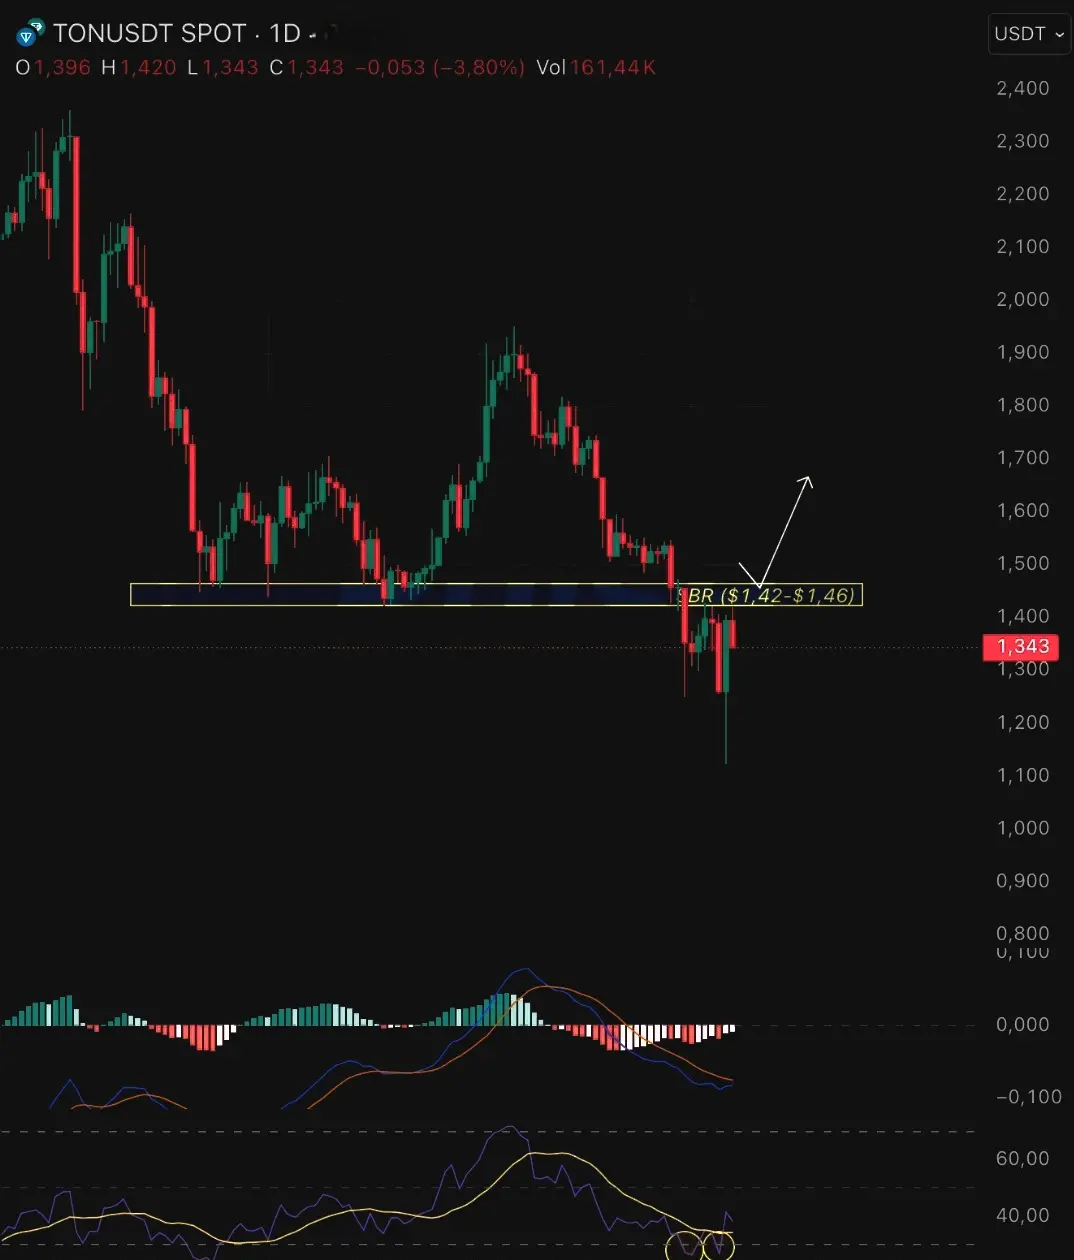
The nearest support level is at the fair value gap around $8.46-$8.48, which also corresponds to the ascending triangle support level 📈#TONUSDT – At a Critical Level
On the daily chart, $TON stock price has fallen below the support level of $1.42-1.46 and is now rebounding toward the support zone. If it recovers, the price may rise toward $1.6.
The (RSI) Relative Strength Index indicates a double bottom, while the MACD indicator has started forming a golden cross.
Stay tuned. Closing two candles on the four-hour timeframe above $1.42 may confirm a buying opportunity.
Join us for more chart analyses, important news, key market events, discussions, and much more – click Follow on our profile page.
#Toncoin
#TON
$TON
TON-2,27%
- Reward
- 2
- 1
- Repost
- Share
BasheerAlgundubi:
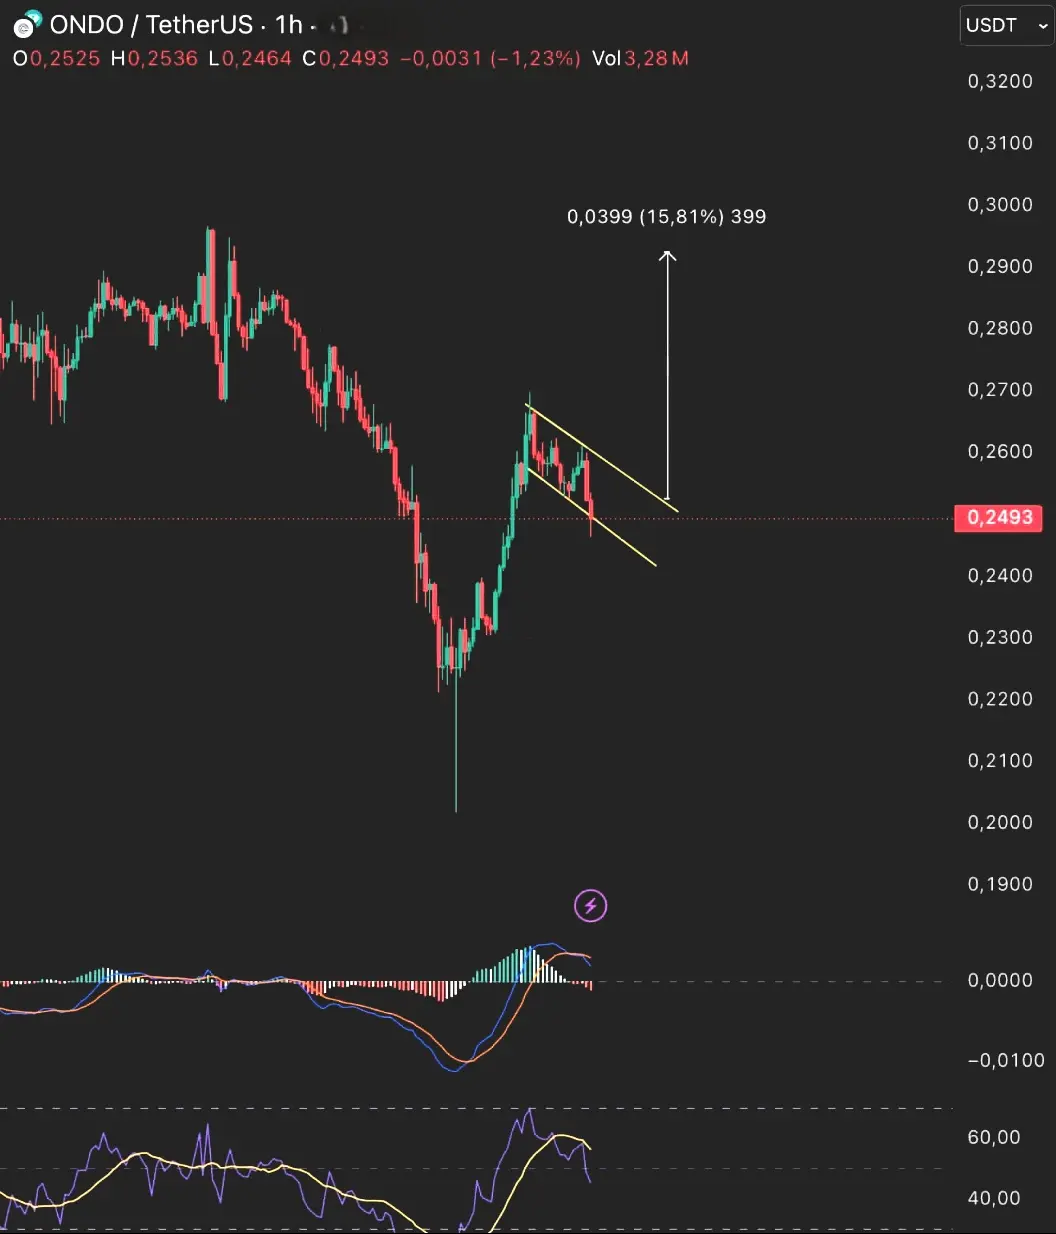
Stay tuned. Closing two candles on the 4-hour timeframe above $1.42 could confirm a buying opportunity.#ONDOUSDT – Continued upward movement is possible
On the 1-hour chart, the $ONDO stock shows a strong rebound, followed by an ascending flag pattern — a bullish continuation pattern.
Wait for a clear breakout before entering buy positions.
Join us for more chart analyses, important news, key market events, discussions, and much more — click Follow on our profile page.
#BuyTheDipOrWaitNow?
#ONDO
$ONDO
ONDO-2,47%
- Reward
- 1
- 1
- Repost
- Share
BasheerAlgundubi:
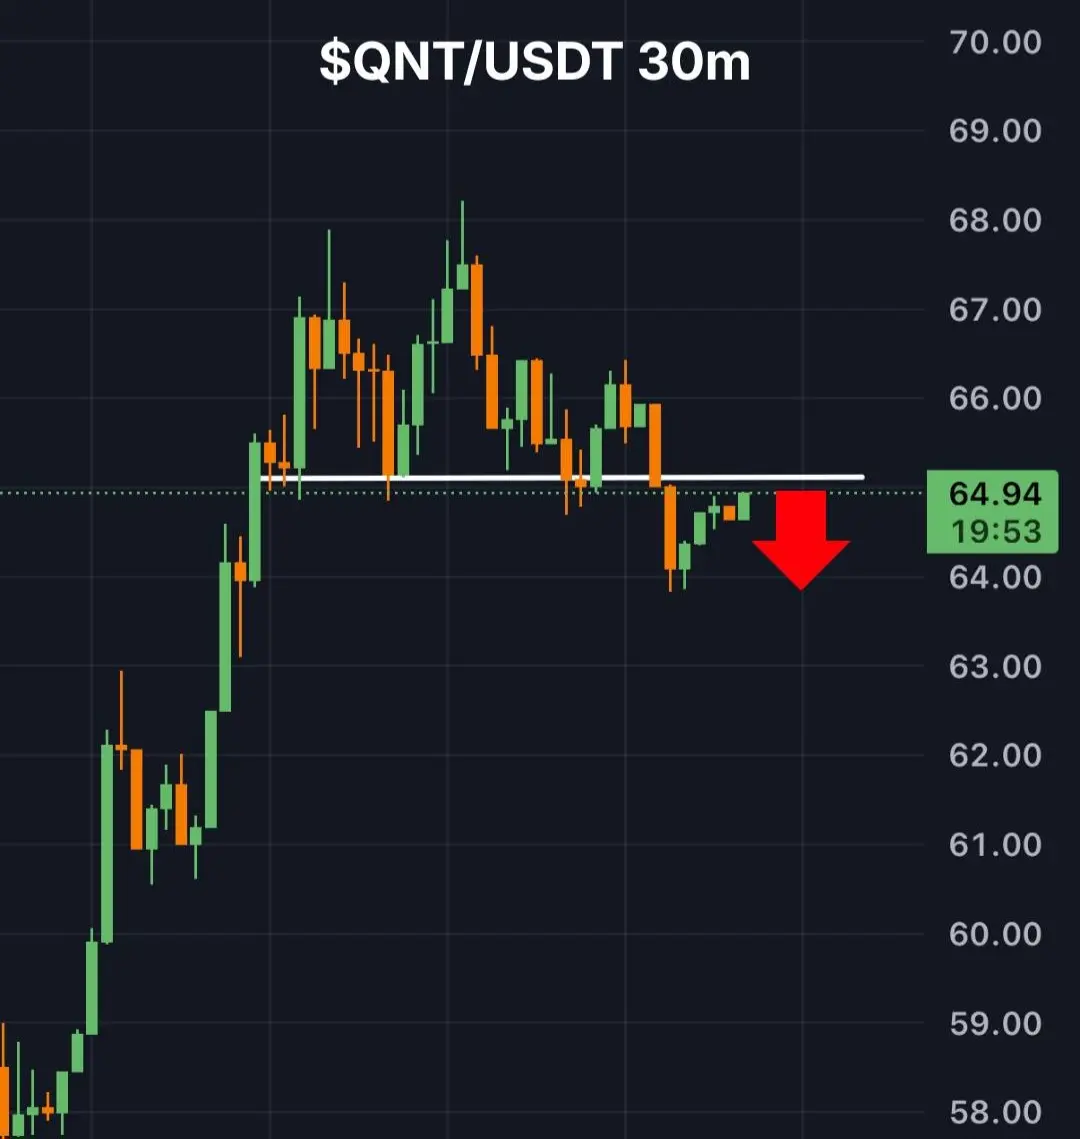
Wait for a clear breakout before entering buy positions.The #QNTUSDT stock faces resistance at the 📉 resistance level.
The price has entered a major resistance level on the hourly timeframe, and we are already seeing a decline below the neckline on shorter timeframes.
The price may drop toward the $60 region, with a potential breakdown if it surpasses $67 ⚠️
Join us for more chart analyses, important news, key market events, discussions, and much more – click follow on our profile page.
#CryptoMarketPullback
#QNT
$QNT
QNT5,54%
- Reward
- 4
- 2
- Repost
- Share
BasheerAlgundubi:
The price may drop towards the $60 region, with a potential collapse if it surpasses $67 ⚠️View More
The #SOLUSDT stock may be on the verge of a price correction after its recent move, as Fibonacci levels converge around the 104-110 range.
After such strong momentum, a pullback to the support level is natural, and this correction often presents a new investment opportunity 📊
Where do you expect the $SOL stock to go after that? Will it undergo a deeper correction or continue its upward trend? Share your predictions below 👇
Join us for more technical analyses, important news, key market events, discussions, and much more - click Follow on our profile page.
#GateJanTransparencyReport
#Solan
SOL0,32%
- Reward
- 1
- 3
- Repost
- Share
BasheerAlgundubi:
Where do you expect $SOL stock to go next? Will it undergo a deeper correction or continue its upward trend? Share your predictions below 👇View More
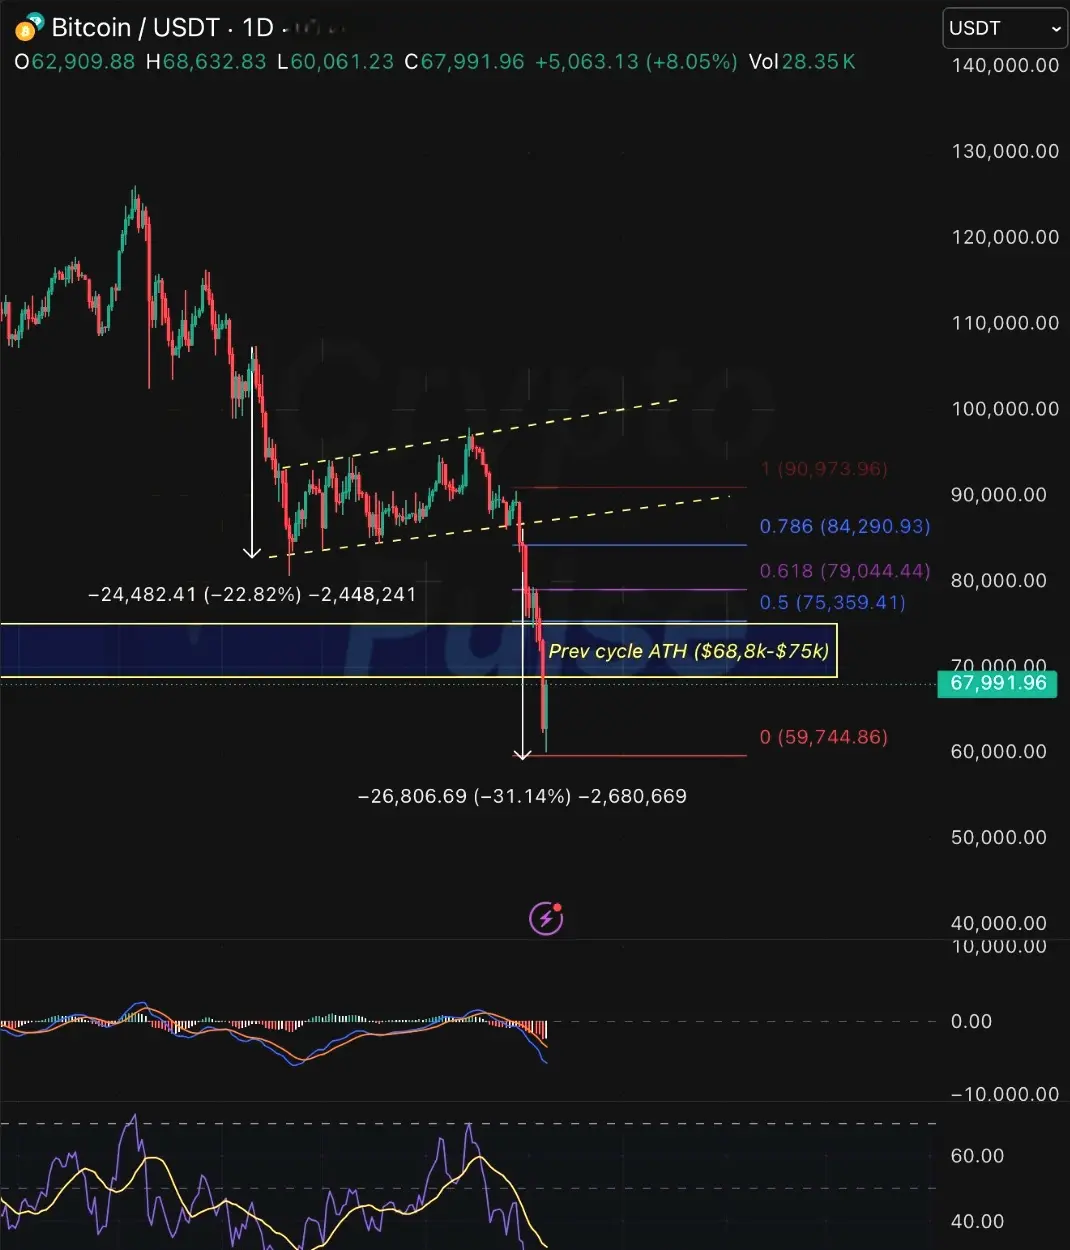
#BTCUSDT – Potential for Bitcoin Price Increase ($BTC ) After a Drop, Here's the Scenario
On January 21, we shared the #البيتكوين price roadmap. We mentioned that breaking the support level could push the price to $75,000, which has already happened — even with a larger decline, in line with the descending flag pattern that used the flagpole for the breakout.
Now, the #Bitcoin price has fallen from its previous cycle high of (68.8K — $75,000), and the Relative Strength Index (RSI) is in the oversold region, so a rebound is likely.
Using Fibonacci ratios, the realistic upward target ranges b
BTC-0,83%
- Reward
- 1
- 1
- Repost
- Share
BasheerAlgundubi:
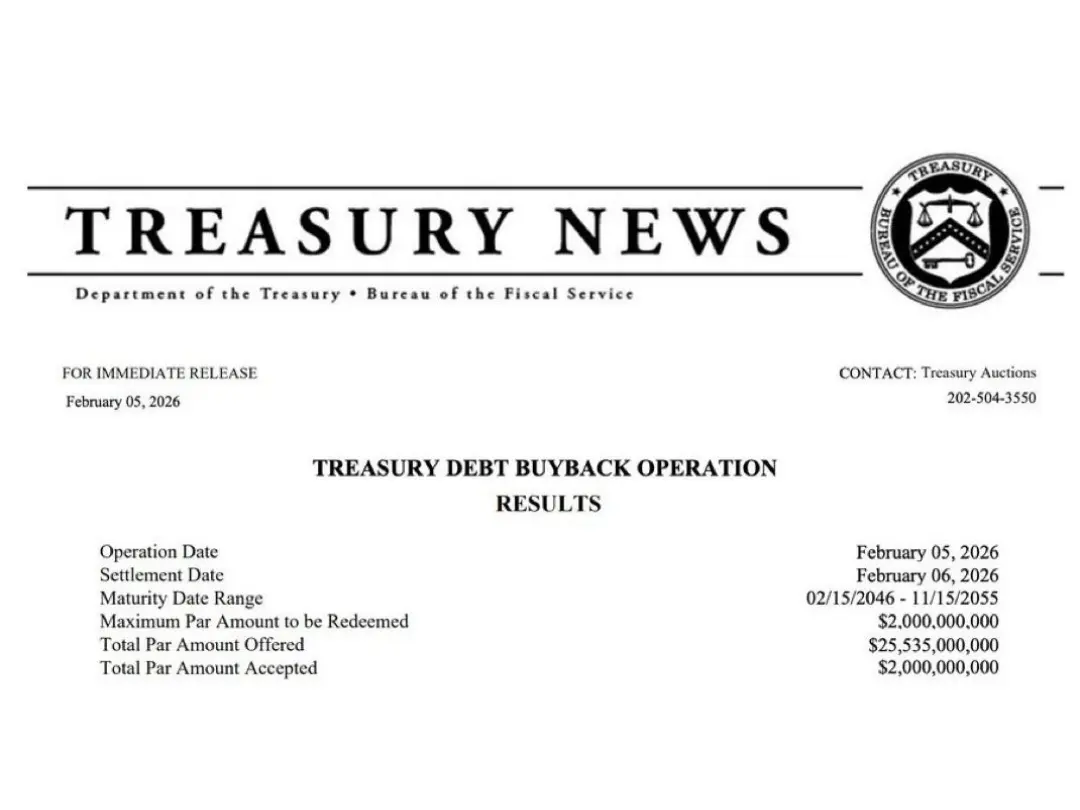
Using Fibonacci ratios, the realistic upward target ranges between $75,000 and $80,000.#عاجل🚨🚨🚨 : U.S. Treasury Department repurchases an additional $2 billion in debt
The U.S. Treasury Department completed an additional $2 billion debt buyback on February 6, injecting liquidity that can be redirected to broader financial markets.
Early signs of liquidity support could pave the way for a return to quantitative easing if this trend continues.
Join us for more technical analysis, important news, key market events, discussions, and much more – click follow on our official page.
#CryptoMarketPullback
$SOL
$XRP
$GT
View OriginalThe U.S. Treasury Department completed an additional $2 billion debt buyback on February 6, injecting liquidity that can be redirected to broader financial markets.
Early signs of liquidity support could pave the way for a return to quantitative easing if this trend continues.
Join us for more technical analysis, important news, key market events, discussions, and much more – click follow on our official page.
#CryptoMarketPullback
$SOL
$XRP
$GT
- Reward
- 1
- 1
- Repost
- Share
BasheerAlgundubi:
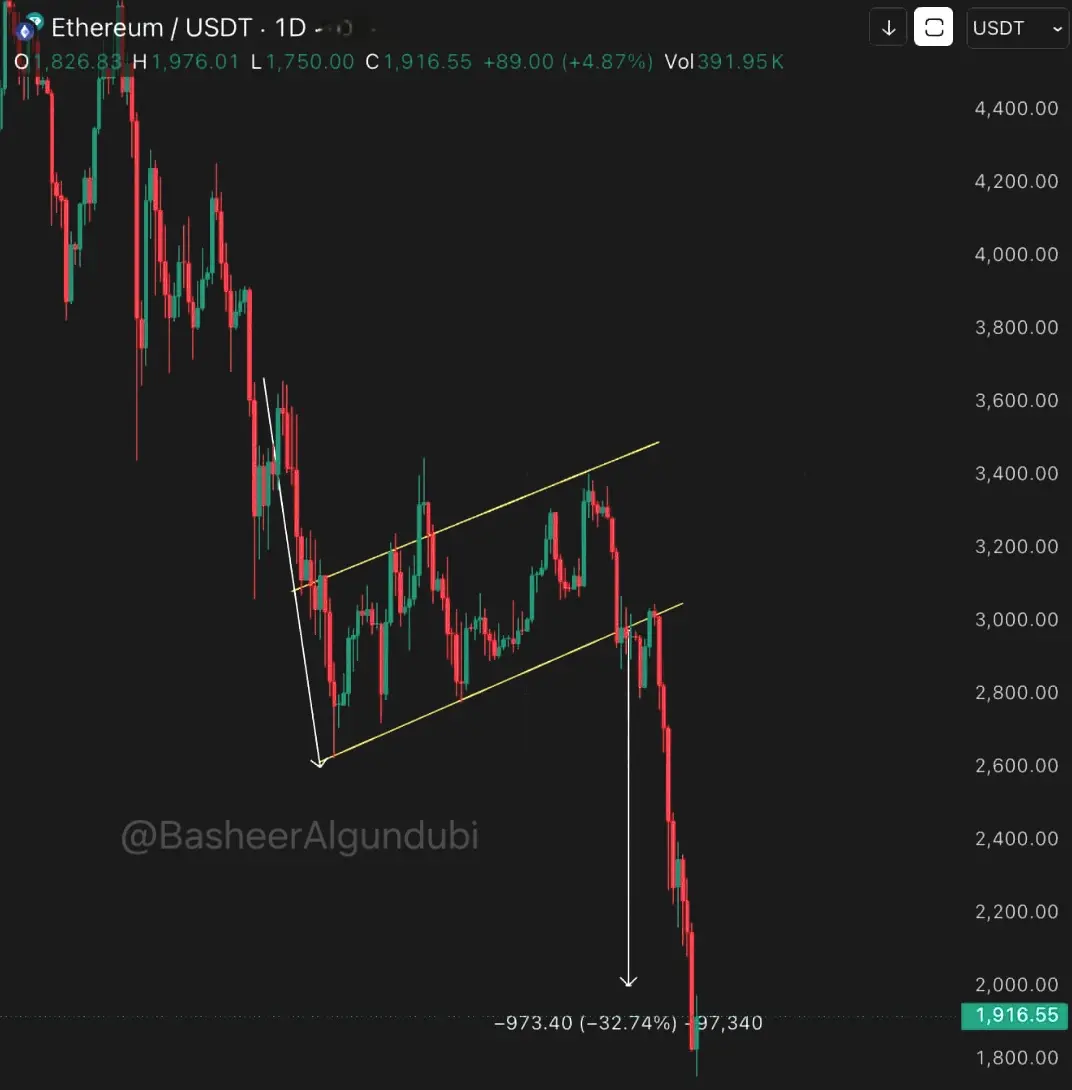
Early signals of liquidity support could pave the way for the resumption of quantitative easing if this trend continues.#ETHUSDT – 33% profit based on our latest forecasts
On January 21, we shared our predictions and warned that the price of $ETH was still in a downtrend. We also recommended opening a short position if the support level of the bearish flag pattern was broken.
The predictions were spot on, achieving nearly 33% profit. Congratulations to those who followed.
Join us for more technical analyses, important news, key market events, discussions, and much more – click follow on our profile page.
#EthereumL2Outlook
#Ethereum
#ETH
$ETH
ETH0,38%
- Reward
- 2
- 1
- Repost
- Share
BasheerAlgundubi:
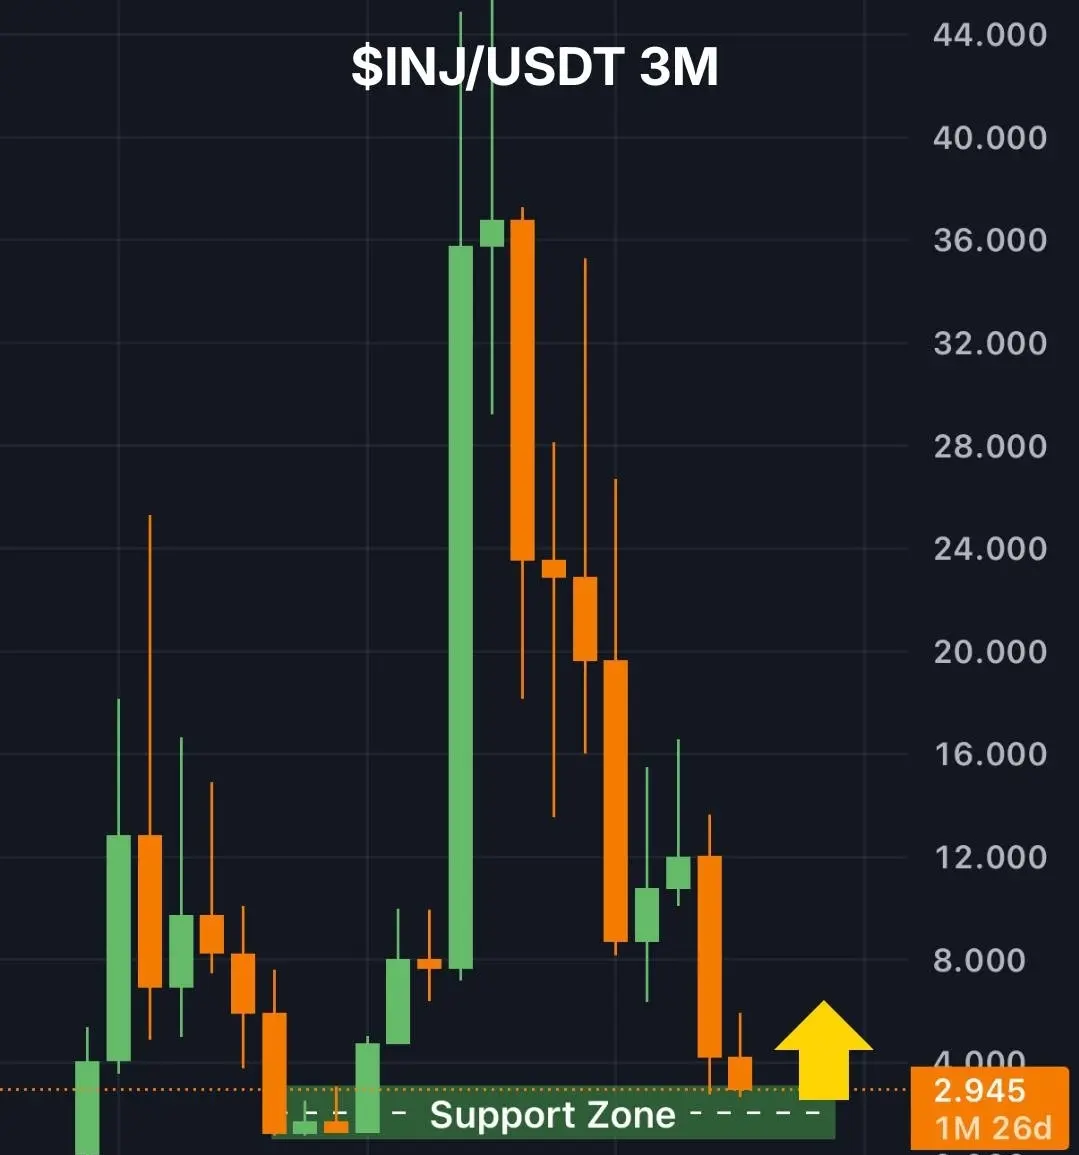
The prediction was completely successful, achieving a profit of approximately 33%. Congratulations to those who followed it.National Lottery Stock (#INJUSDT ) Returns to a Major Long-Term Support Level ⚠
After a significant rise and sharp decline, the National Lottery stock ($INJ ) is now testing a historically important support level around $3.
If this level holds, we may see a slight increase toward the $8-10 range.
Join us for more technical analyses, important news, key market events, discussions, and much more – click Follow on our profile page.
#GateJanTransparencyReport
#İNJ
$INJ
INJ-0,53%
- Reward
- 1
- 1
- Repost
- Share
BasheerAlgundubi:
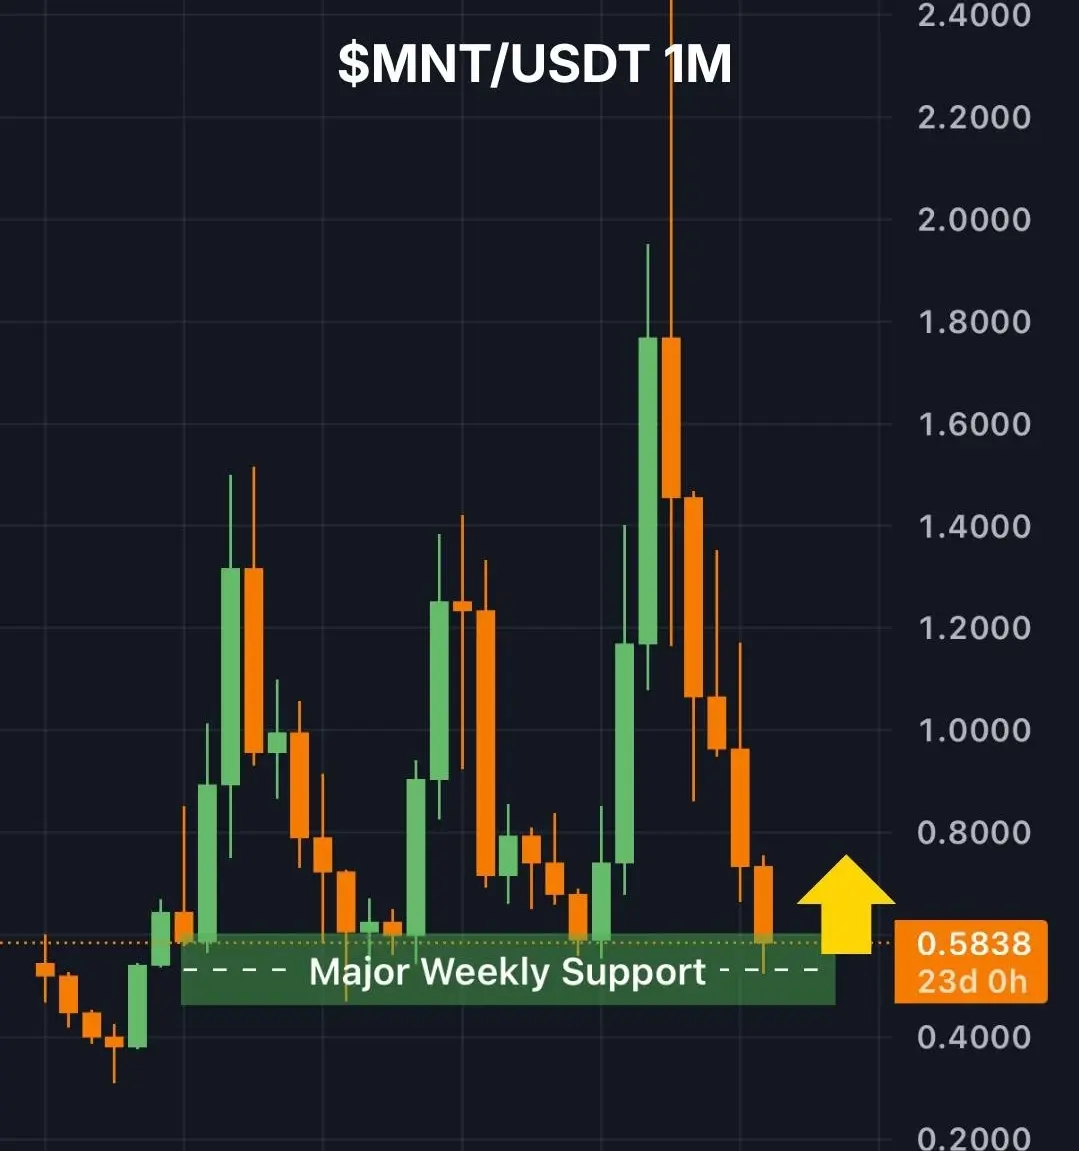
If this level holds, we may see a slight increase toward the $8-10 range.The #MNTUSDT coin is stabilizing at a major monthly support level 👀
The price is currently testing a long-term major support zone around $0.50, a level that has historically represented a strong demand area.
If buyers enter and maintain this level, a short-term rebound toward $0.8 - $1 could follow.
Join us for more technical analyses, important news, key market events, discussions, and much more – click follow on our profile page.
#BuyTheDipOrWaitNow?
#MNT
$MNT
MNT1,12%
- Reward
- 2
- 1
- Repost
- Share
BasheerAlgundubi:
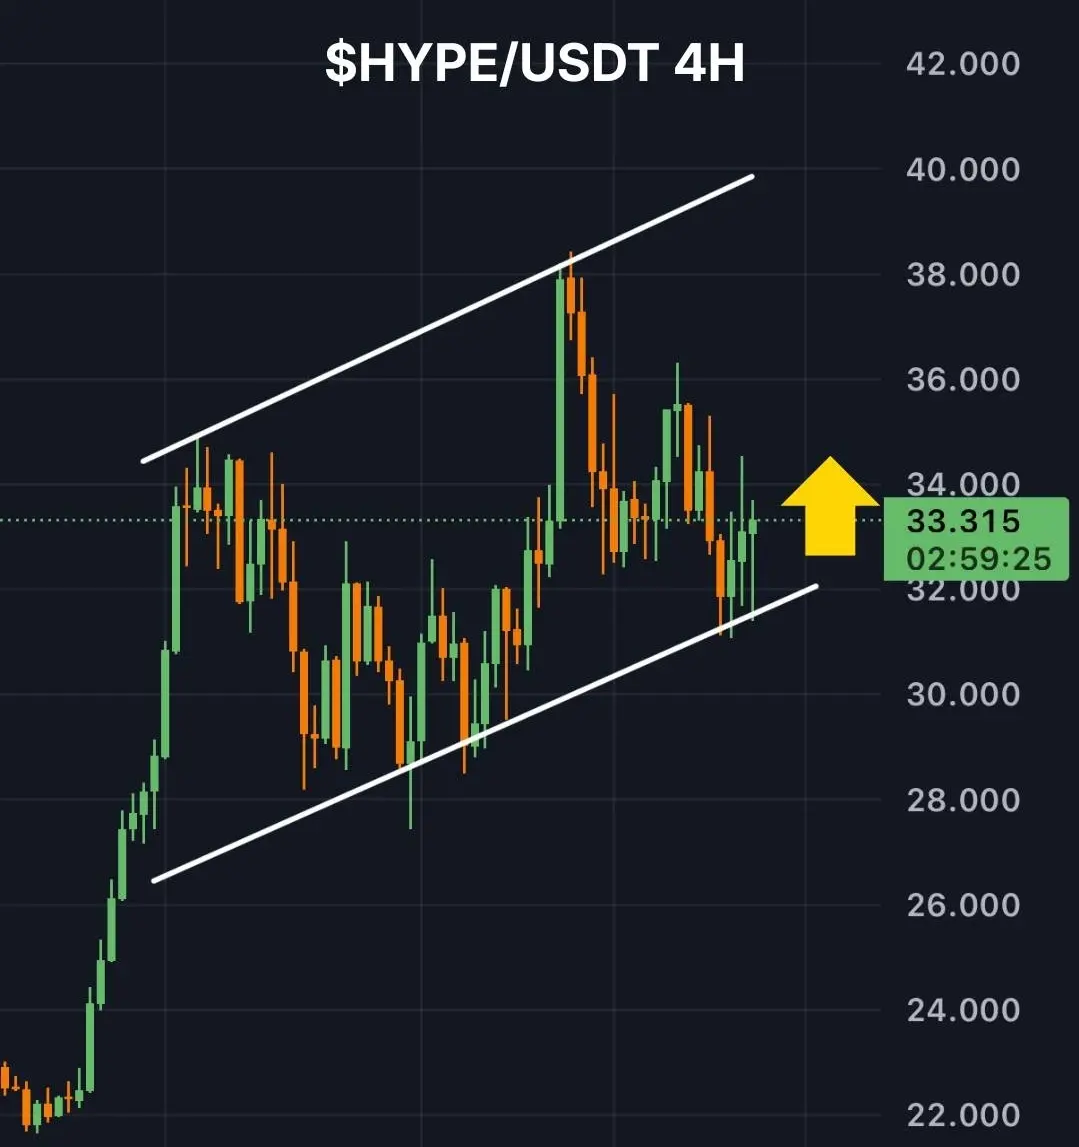
If buyers enter and maintain this level, a short-term rebound towards $0.8 - $1 could follow.The #HYPEUSDT currency maintains its strength despite the weak market 💪📈
While the broader cryptocurrency market faces pressure, the $HYPE coin continues its upward trajectory.
As long as the price stays above $30, the market structure remains healthy, and a retest of the $40 level remains possible.
Join us for more technical analyses, important news, key market events, discussions, and much more – click follow on our profile page.
#Hyperliquid
#HYPE
$HYPE
HYPE-2,82%
- Reward
- 2
- 3
- Repost
- Share
BasheerAlgundubi:
As long as the price remains above $30, the market structure remains healthy, and the possibility of retesting the $40 level still exists.View More
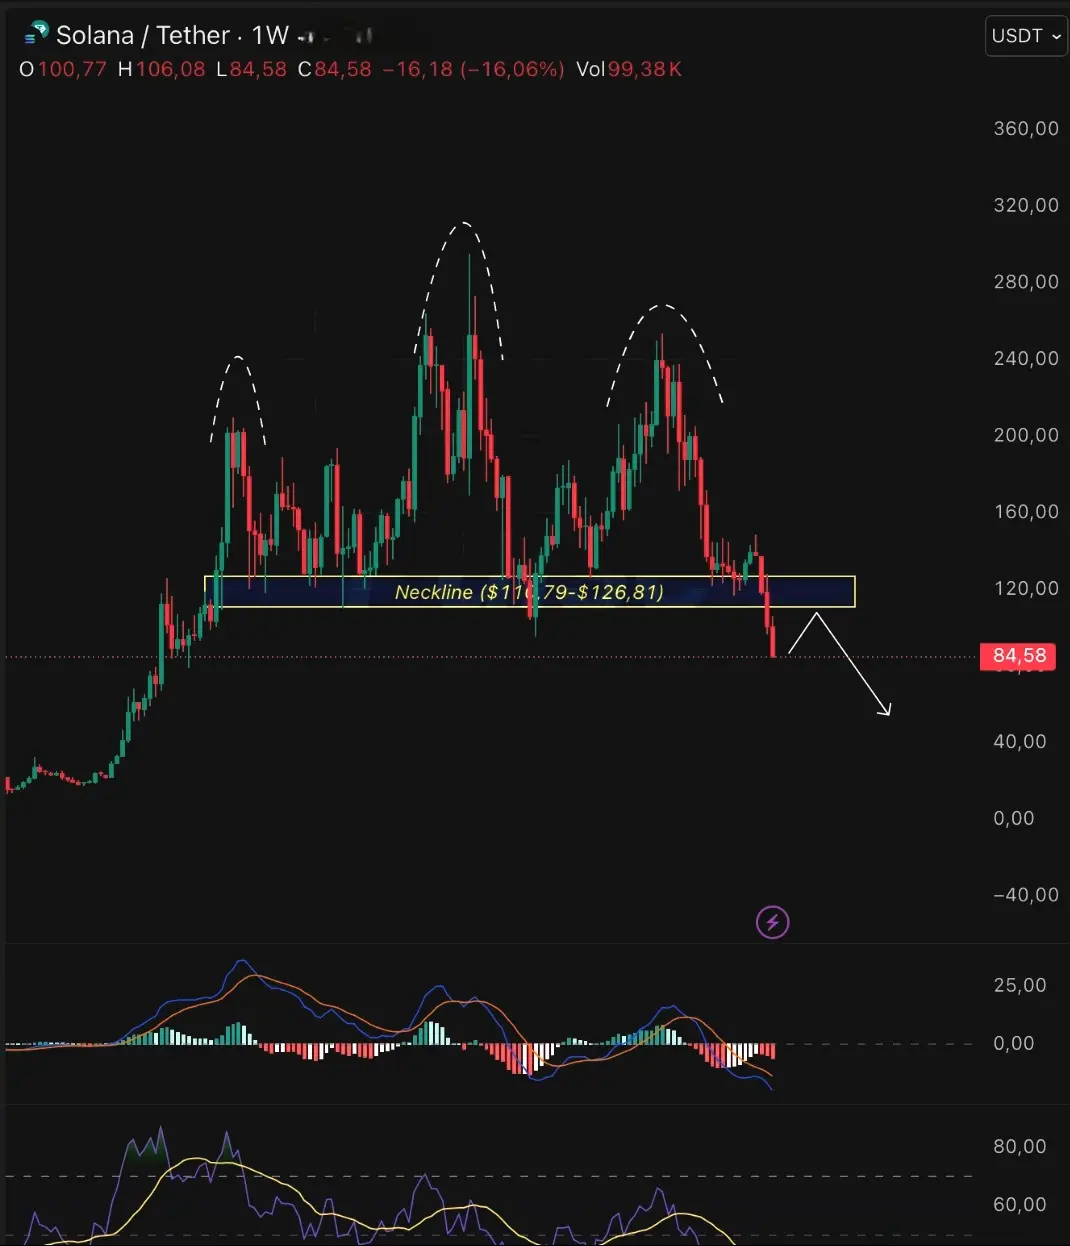
#SOLUSDT – Head and Shoulders Confirmation, Larger Drop Expected
On the weekly chart, the stock price of $SOL has fallen below the neckline of the Head and Shoulders pattern, indicating a reversal of the trend from bullish to bearish. The ( RSI (Relative Strength Index) is in the oversold zone, suggesting that a rebound is likely in the upcoming week. Traders should consider this an opportunity to exit long positions or to look for potential short-selling opportunities.

*Image showing the Head and Shoulders pattern with the neck
SOL0,32%
- Reward
- 1
- 2
- Repost
- Share
GateUser-775ff117:
2026 Go Go Go 👊View More
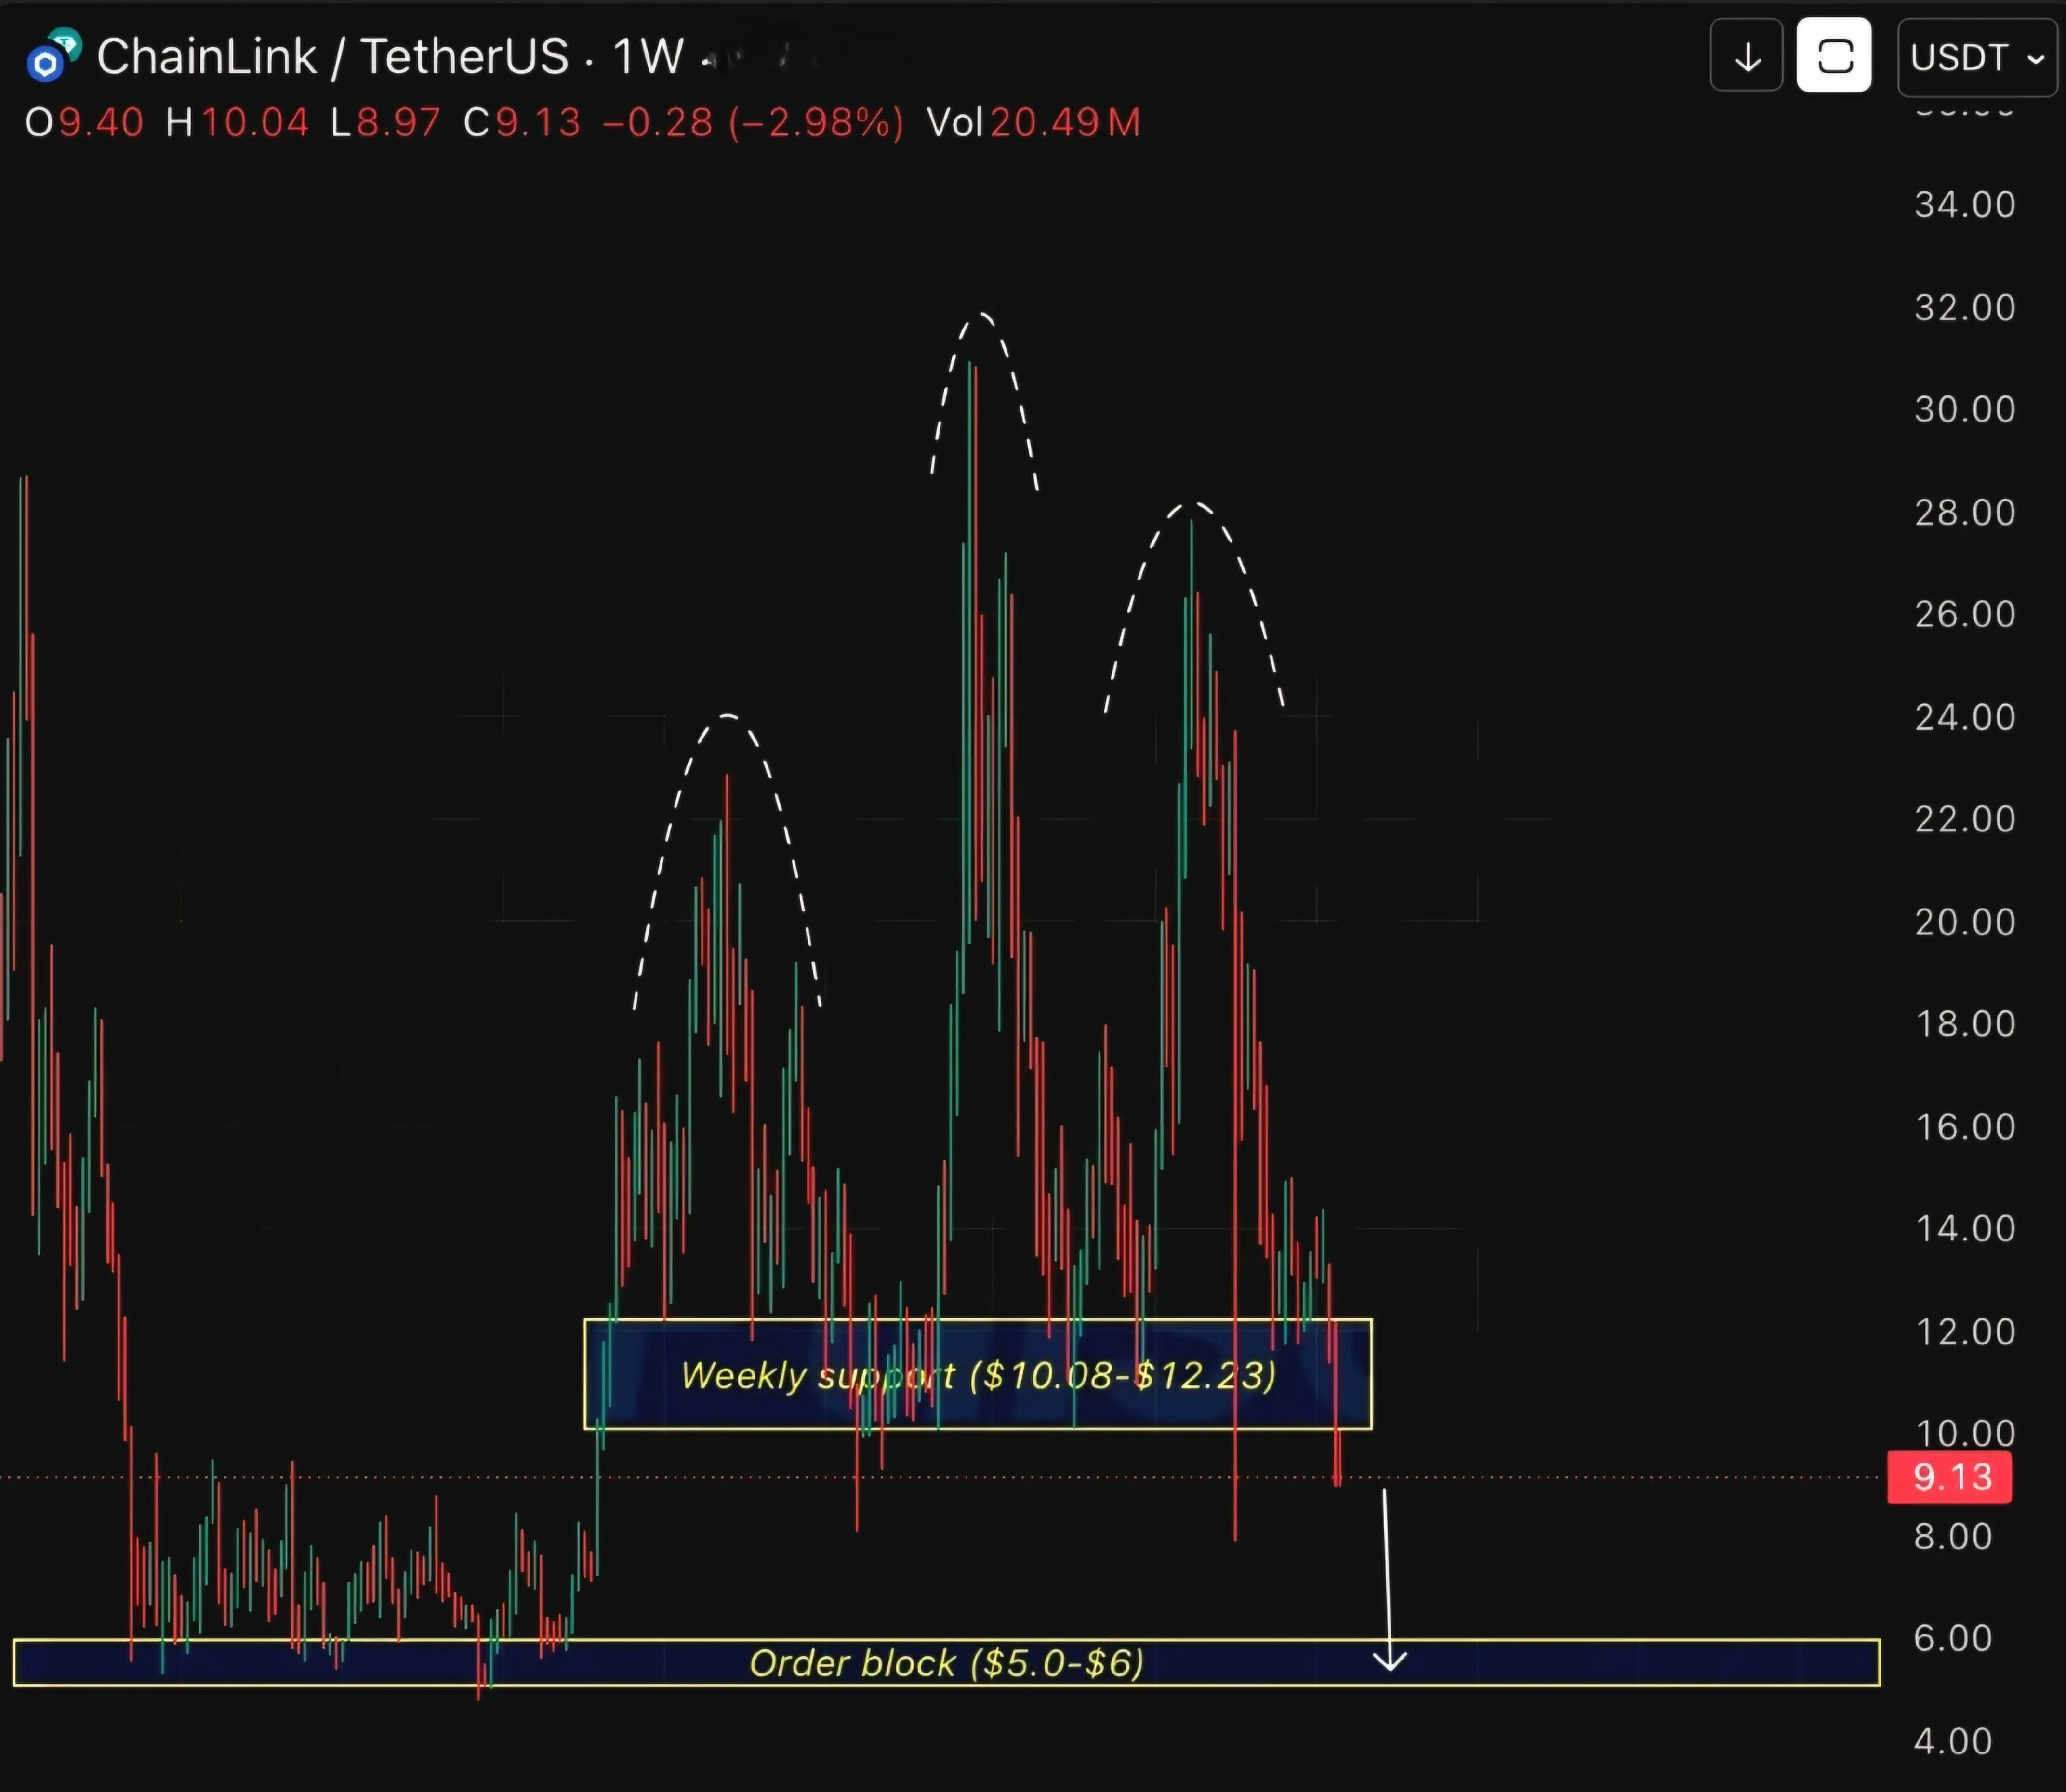
#LINKUSDT – Head and Shoulders Pattern Confirmation
On the weekly chart, $LINK stock closed a candle below the neckline of the Head and Shoulders pattern, indicating the start of a downtrend.
Below this level, there is no significant support until the 5-6 dollar level.
It is unlikely that the price will drop directly to this level; a temporary rise may occur. Take advantage of this increase to exit high-priced trades or look for selling opportunities.
Join us for more chart analyses, important news, key market events, discussions, and much more – click Follow on our profile page.
#Chainlink
LINK0,34%
- Reward
- 1
- 1
- Repost
- Share
BasheerAlgundubi:
It is unlikely that the price will drop directly to this level; a temporary rise may occur. Take advantage of this increase to exit high-priced trades or look for selling opportunities.Trending Topics
View More191.72K Popularity
49.75K Popularity
16.99K Popularity
7.66K Popularity
3.83K Popularity
Pin