


- As ETFs de Bitcoin continuam a atrair fluxos de entrada, enquanto as moedas Ethereum e XRP registam fluxos de saída ligeiros.
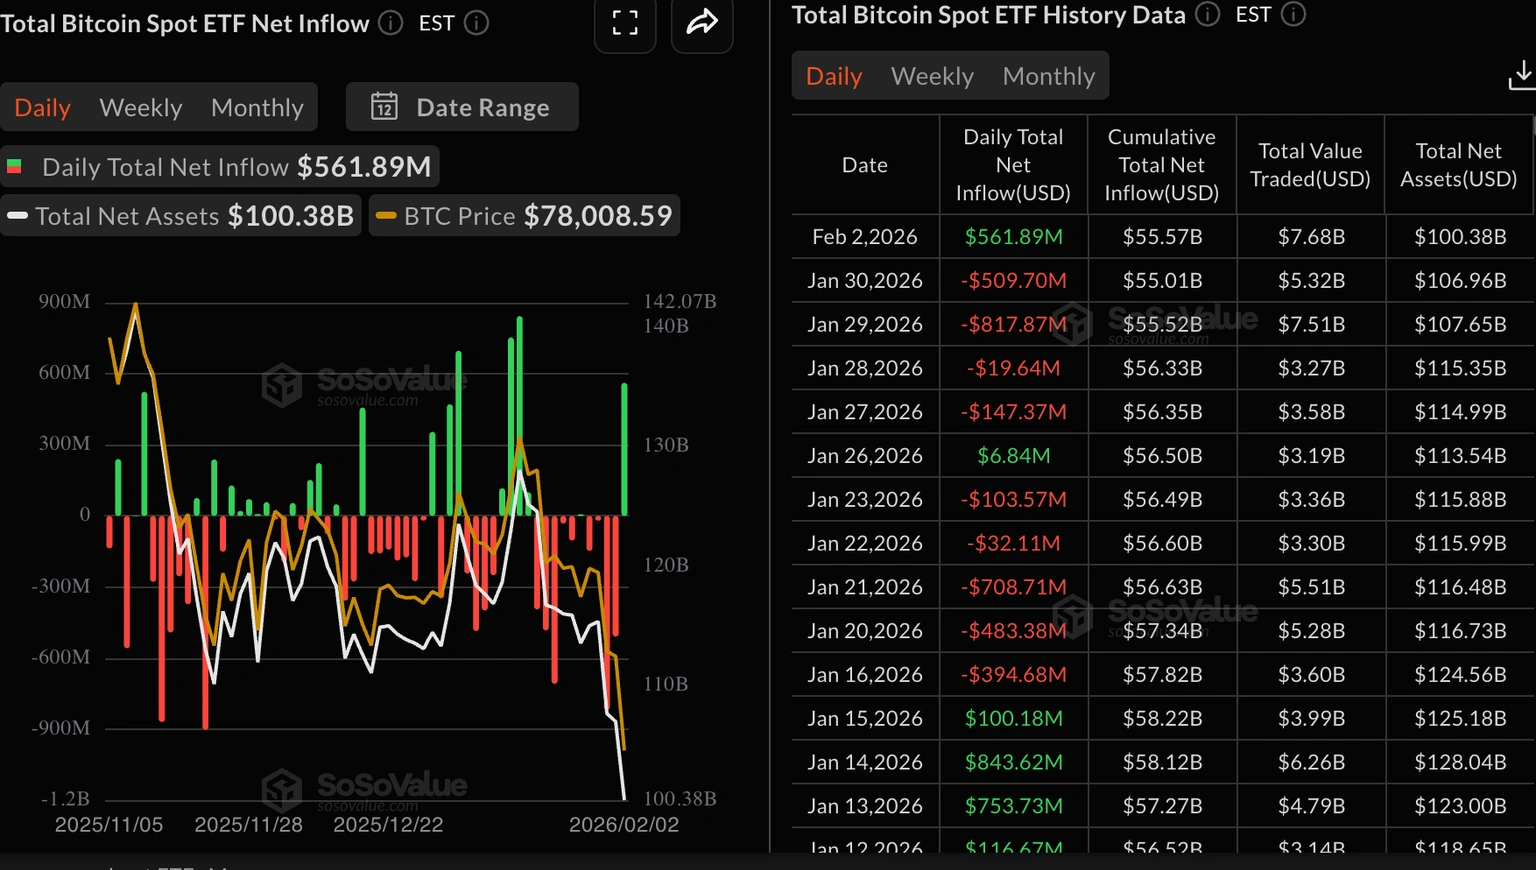
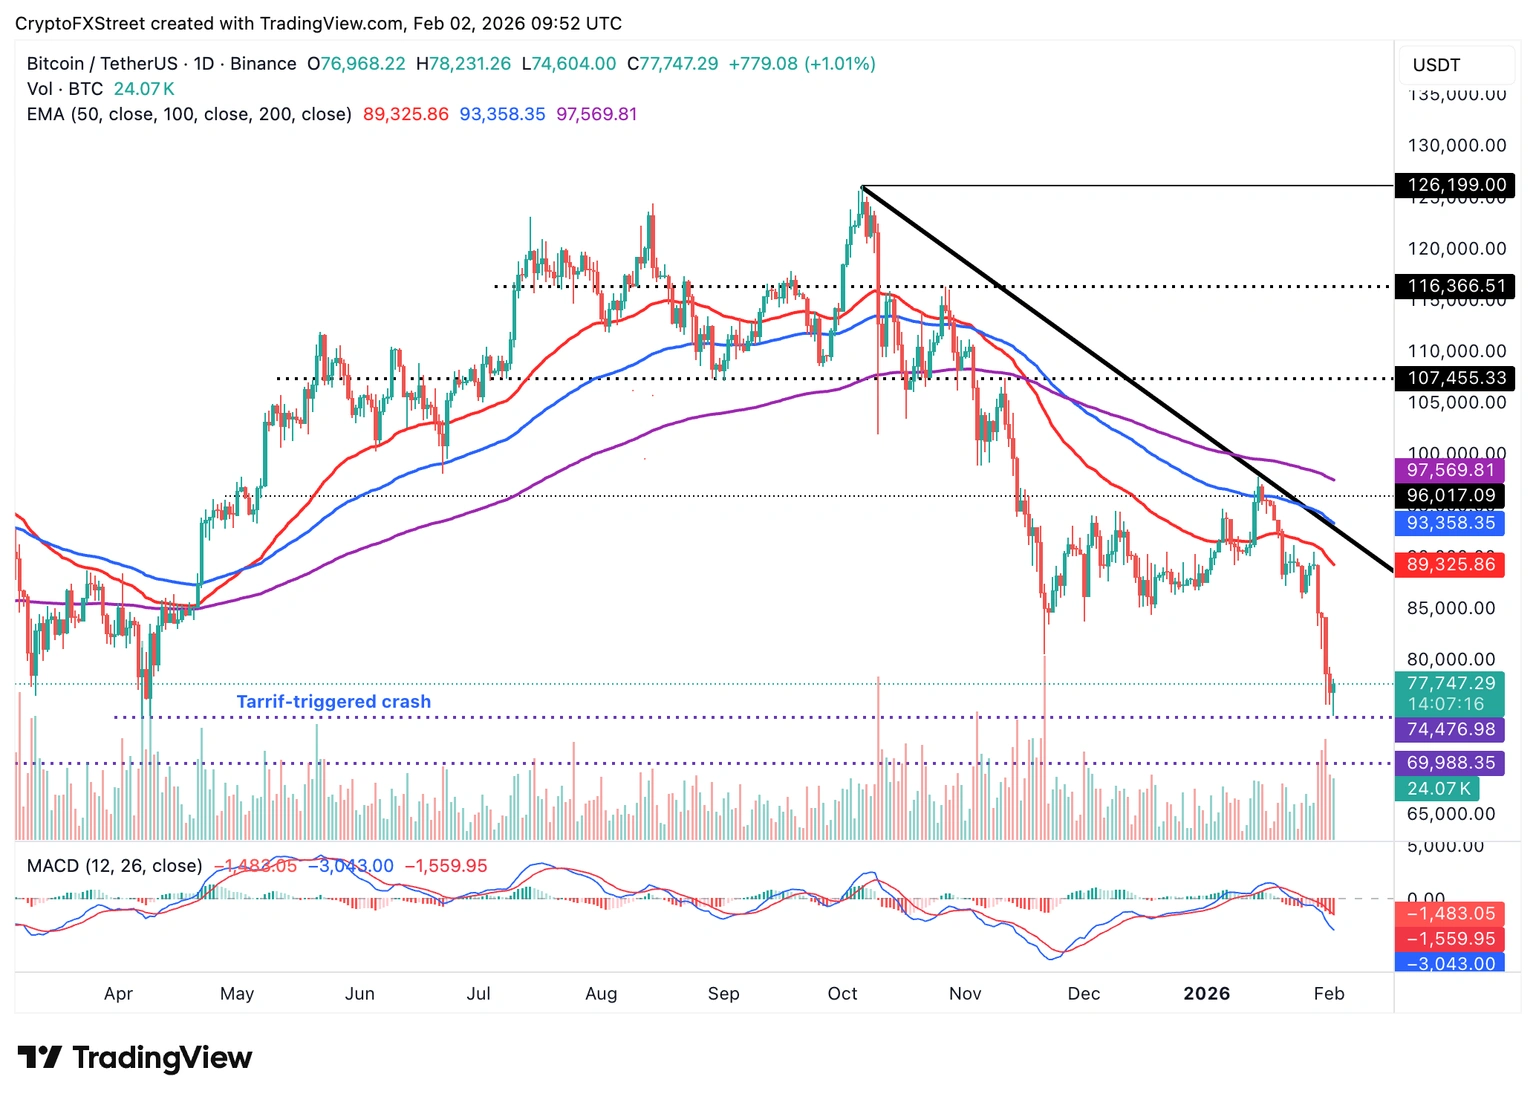
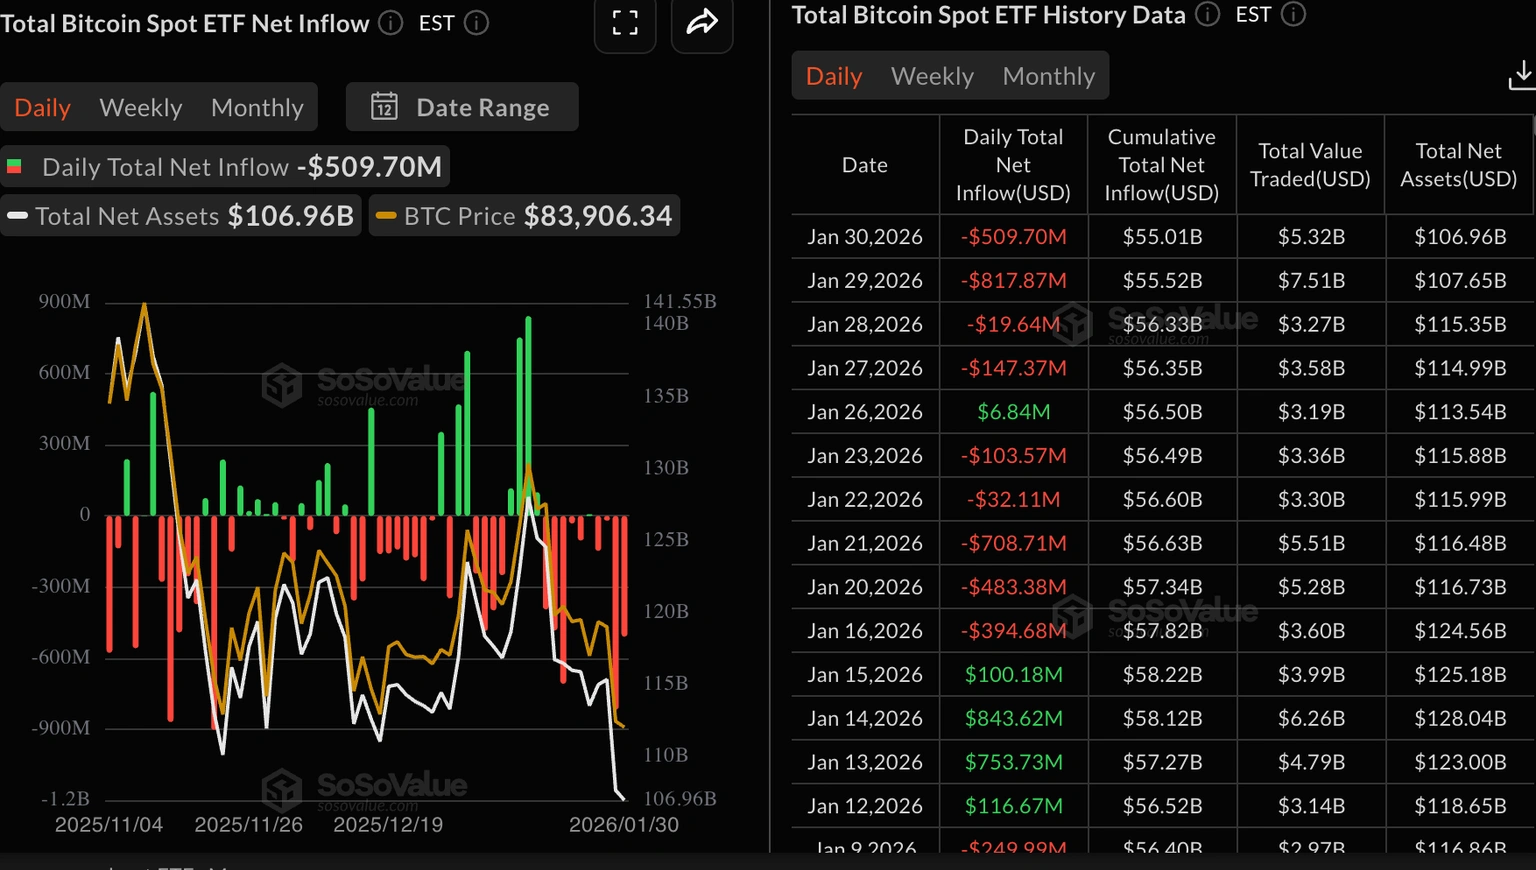
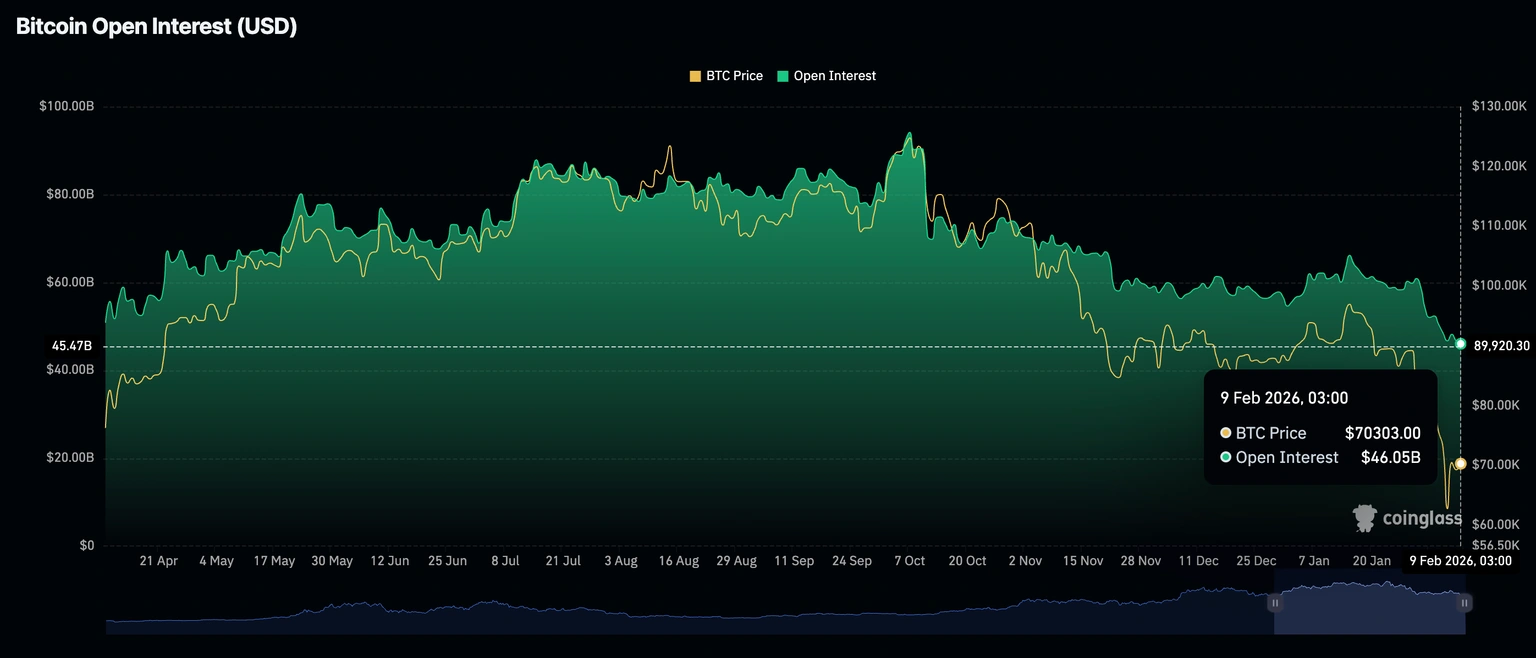
As ETFs de Bitcoin à vista listadas nos Estados Unidos registaram fluxos de caixa de cerca de 562 milhões de dólares na segunda-feira. Isto representa um retorno do interesse institucional, pondo fim a uma série de quatro dias de fluxos de saída que levaram a uma queda no desempenho do preço do Bitcoin.
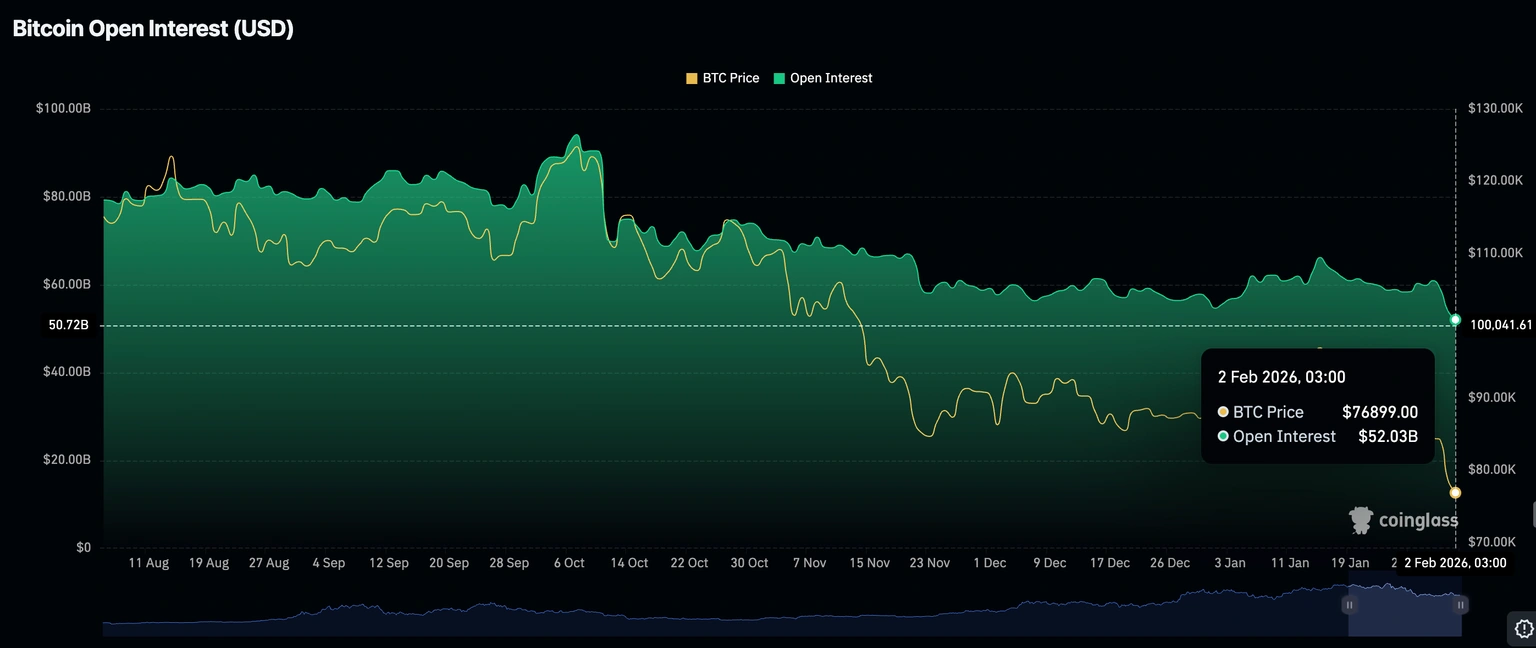
O total de fluxos de entrada atualmente é de 55,57 mil milhões de dólares, enquanto o valor dos ativos sob gestão é de 100,38 mil milhões de dólares. Os fluxos de caixa estáveis para fundos de índice cotados indicam um sentimento positivo no mercado, o que pode contribuir para apoiar a recuperação do Bitcoin.
Fluxos de ETFs de Bitcoin | Fonte: SoSoValue
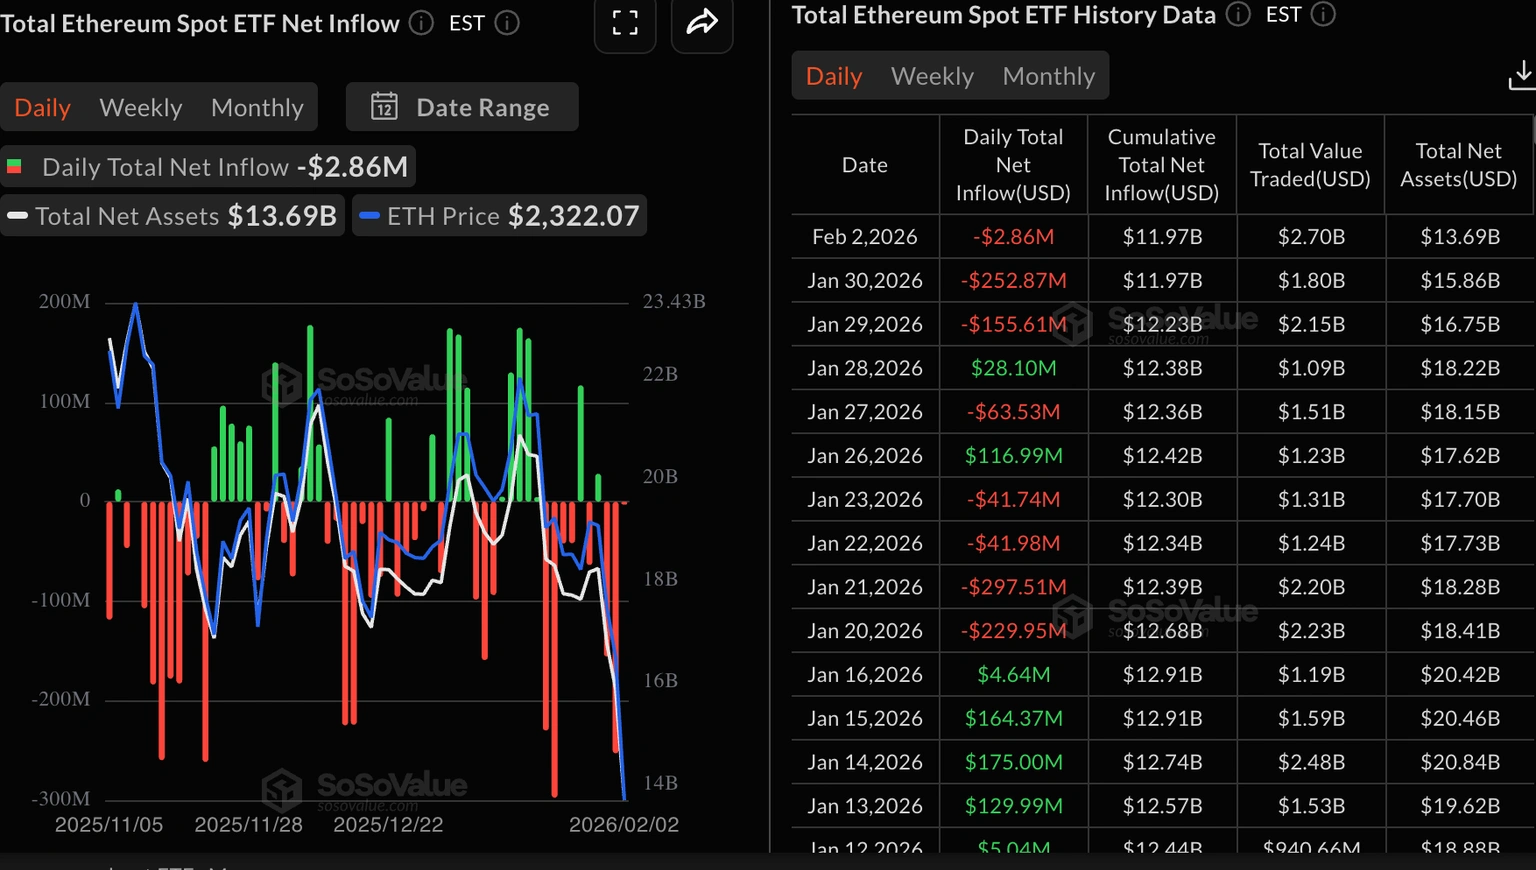
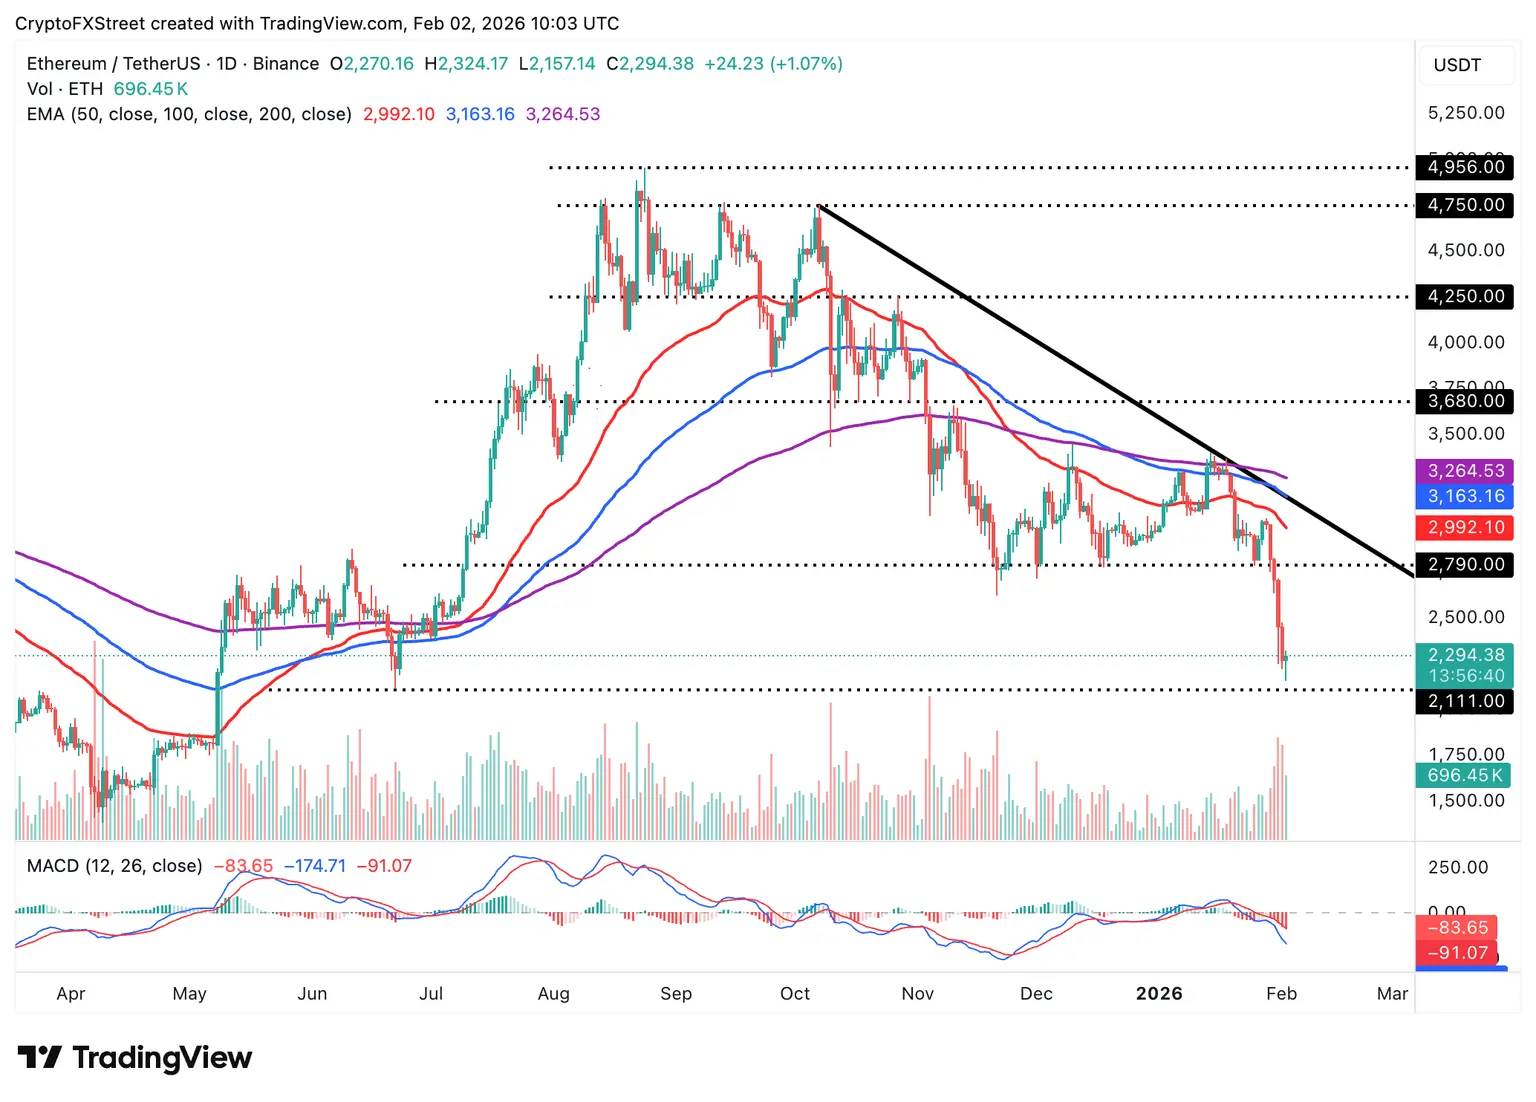
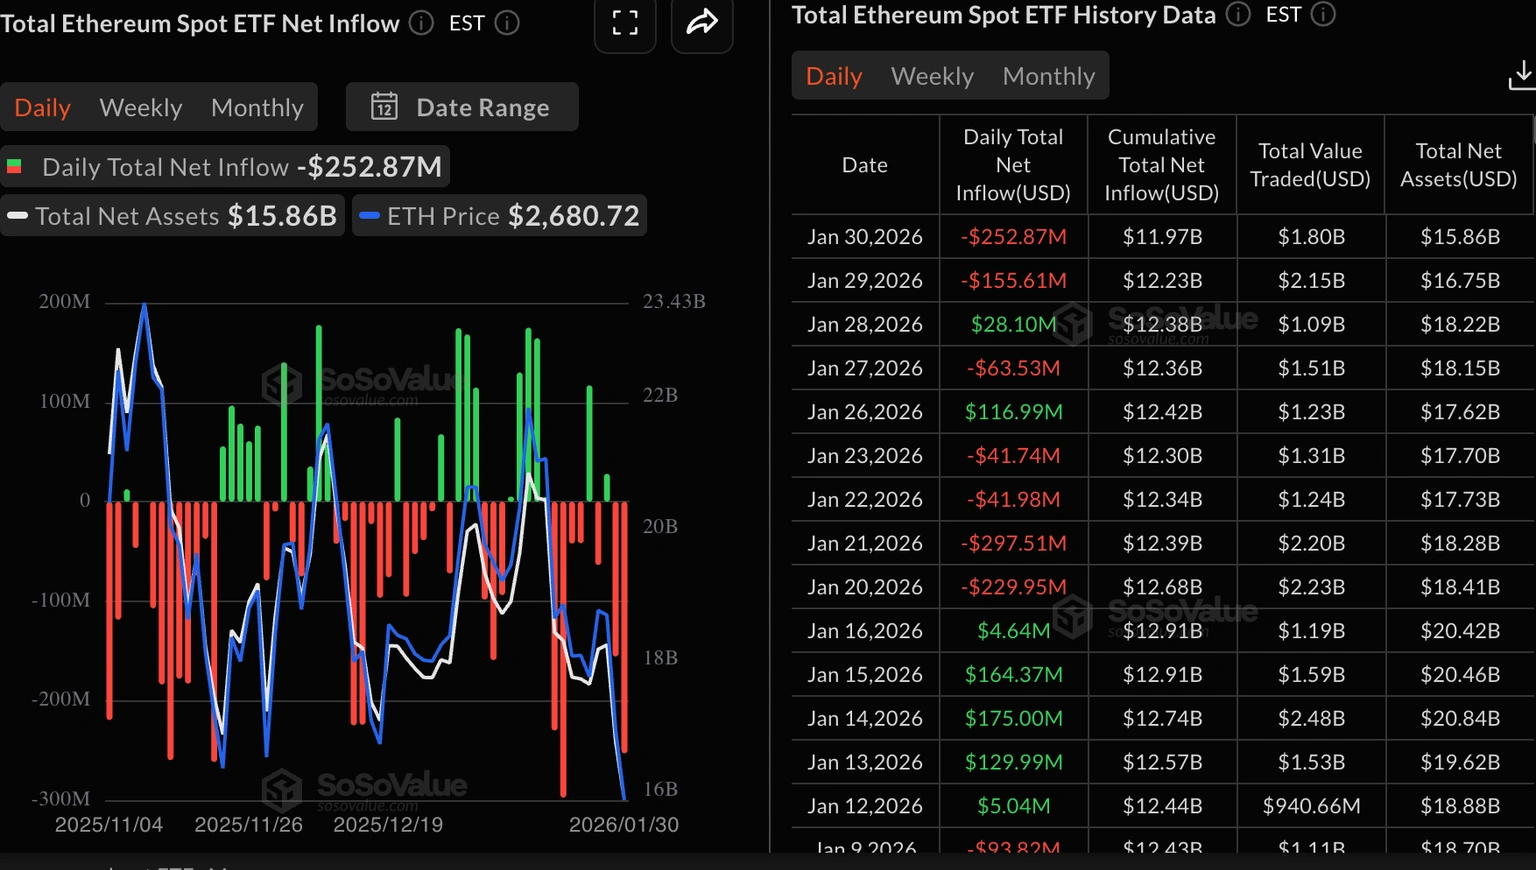
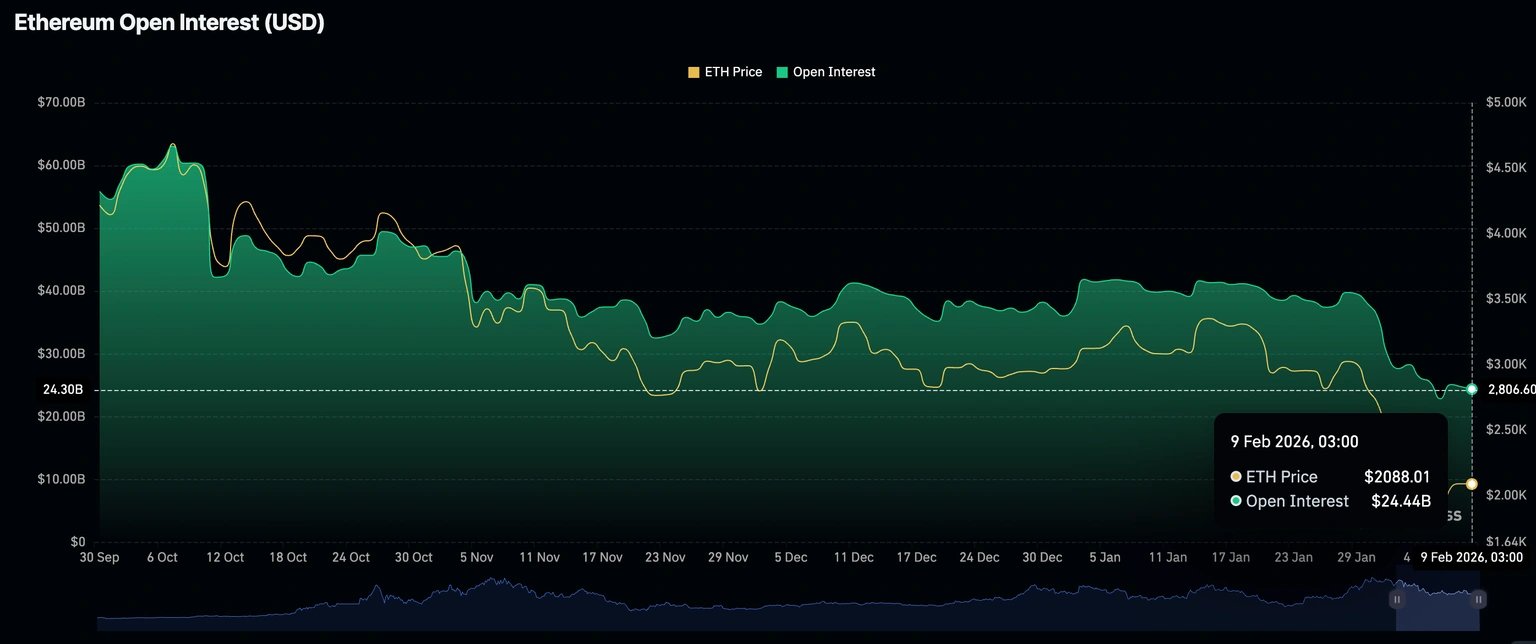
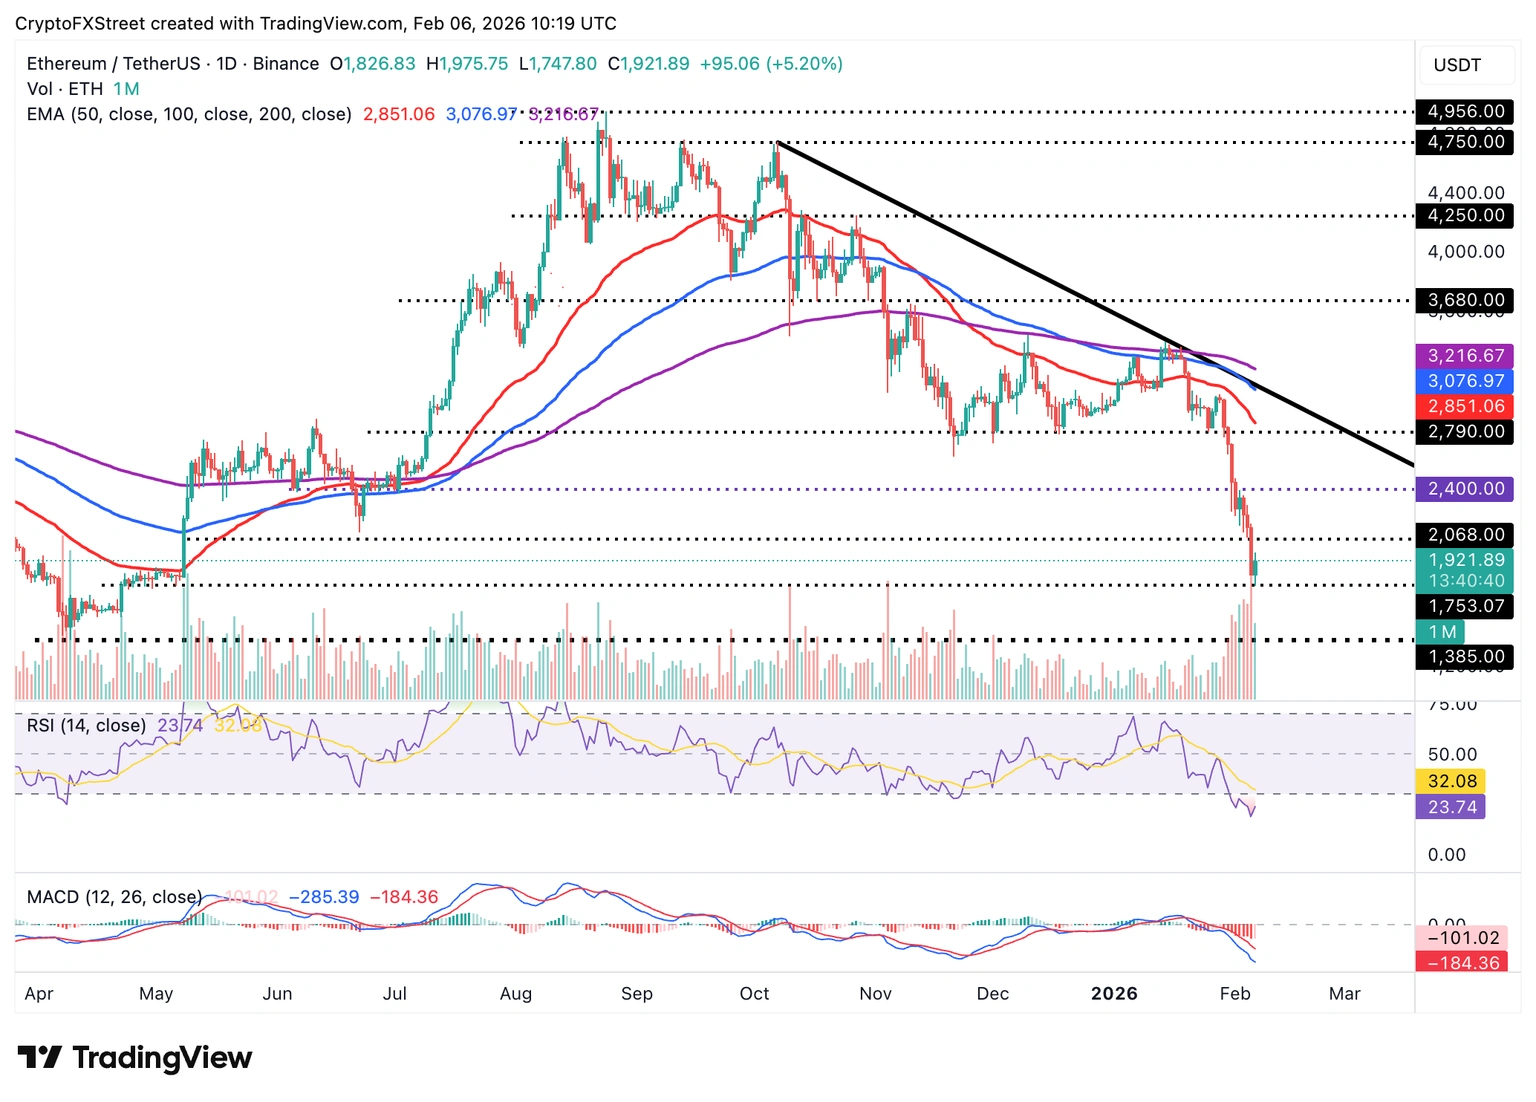
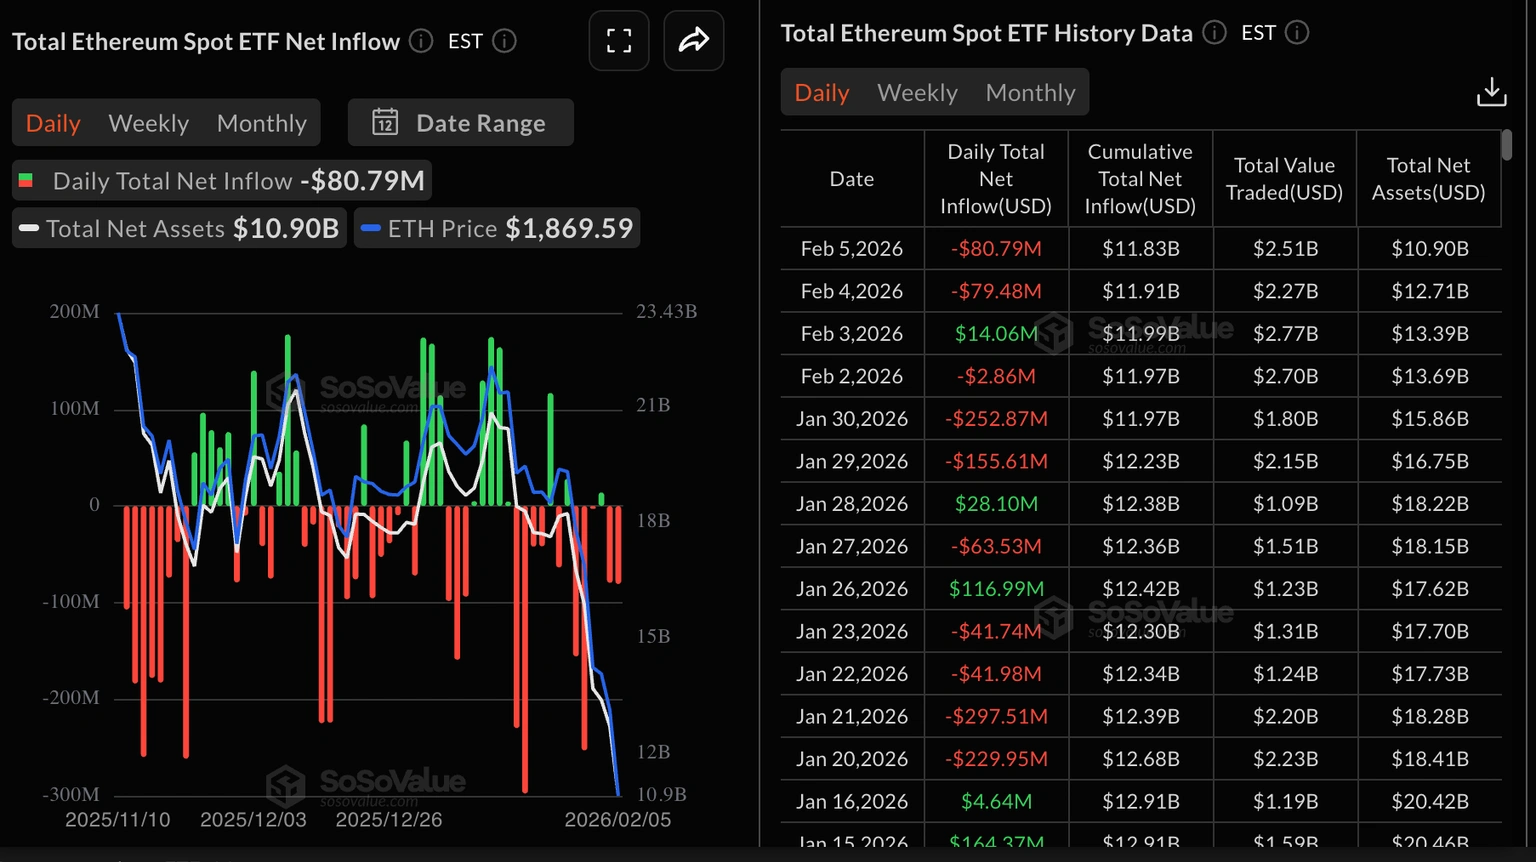
Por outro lado, os ETFs de Ethereum à vista continuam a tendência de saídas de investimento pelo terceiro dia consecutivo, com investidores a retirar cerca de 3 milhões de dólares na segunda-feira. O total de fluxos de entrada agora é de 11,97 mil milhões de dólares, com um valor médio de ativos líquidos de 13,69 mil milhões de dólares. A continuação dos fluxos de investimento de saída pode diminuir o sentimento, desacelerando o ritmo de recuperação.
Fluxos de ETFs de Ethereum | Fonte: SoSoValue
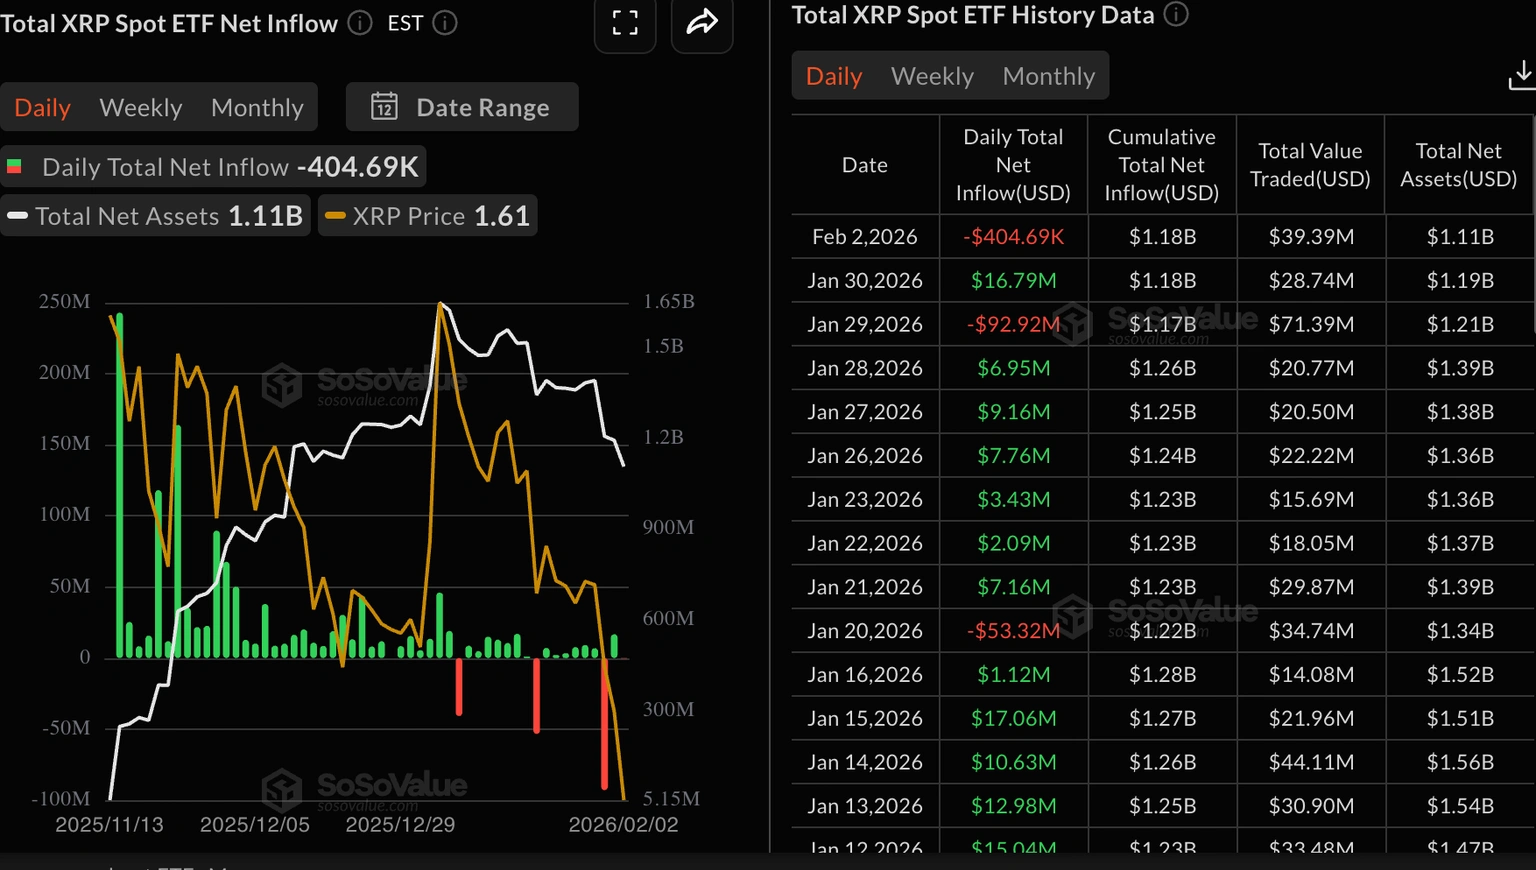
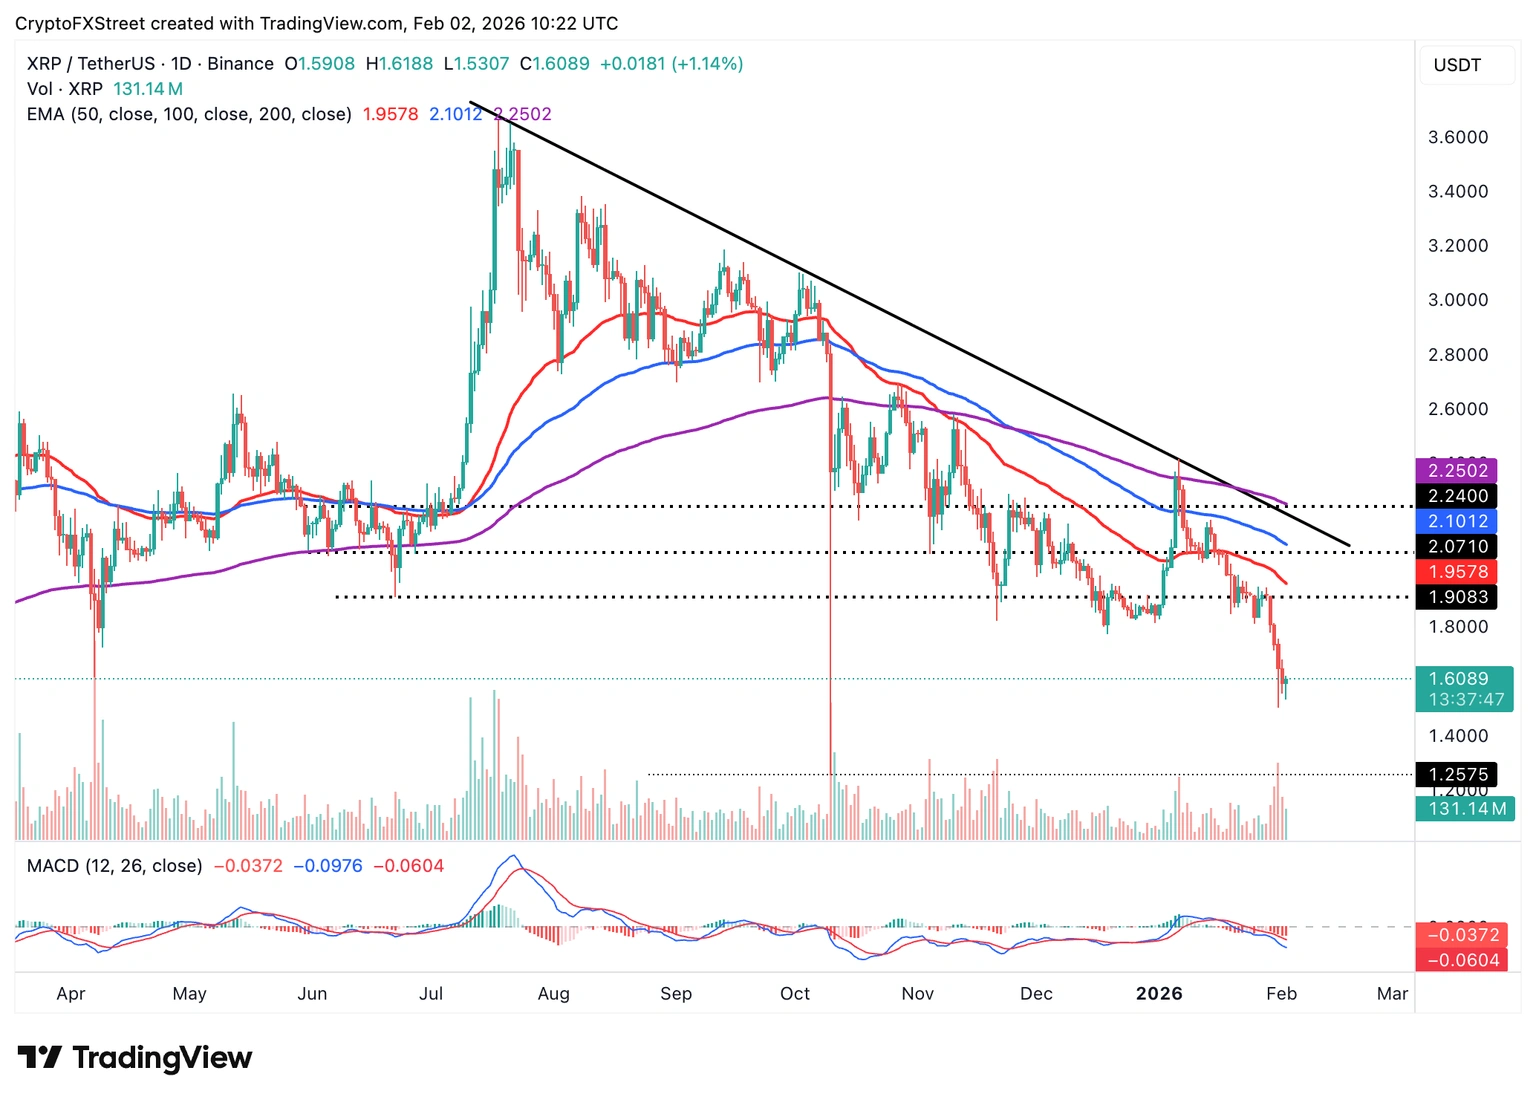
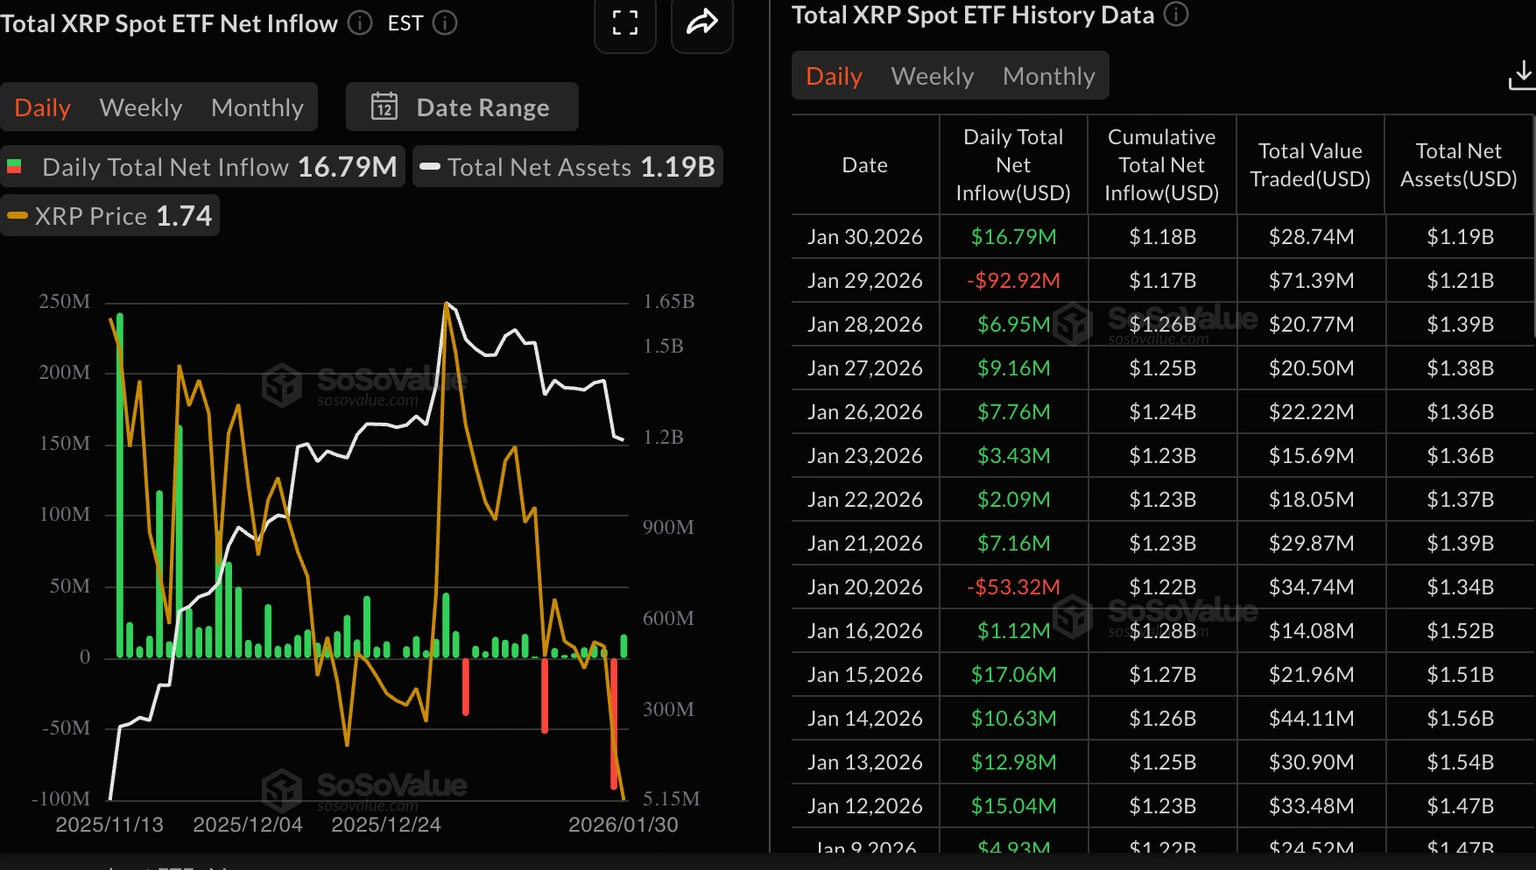
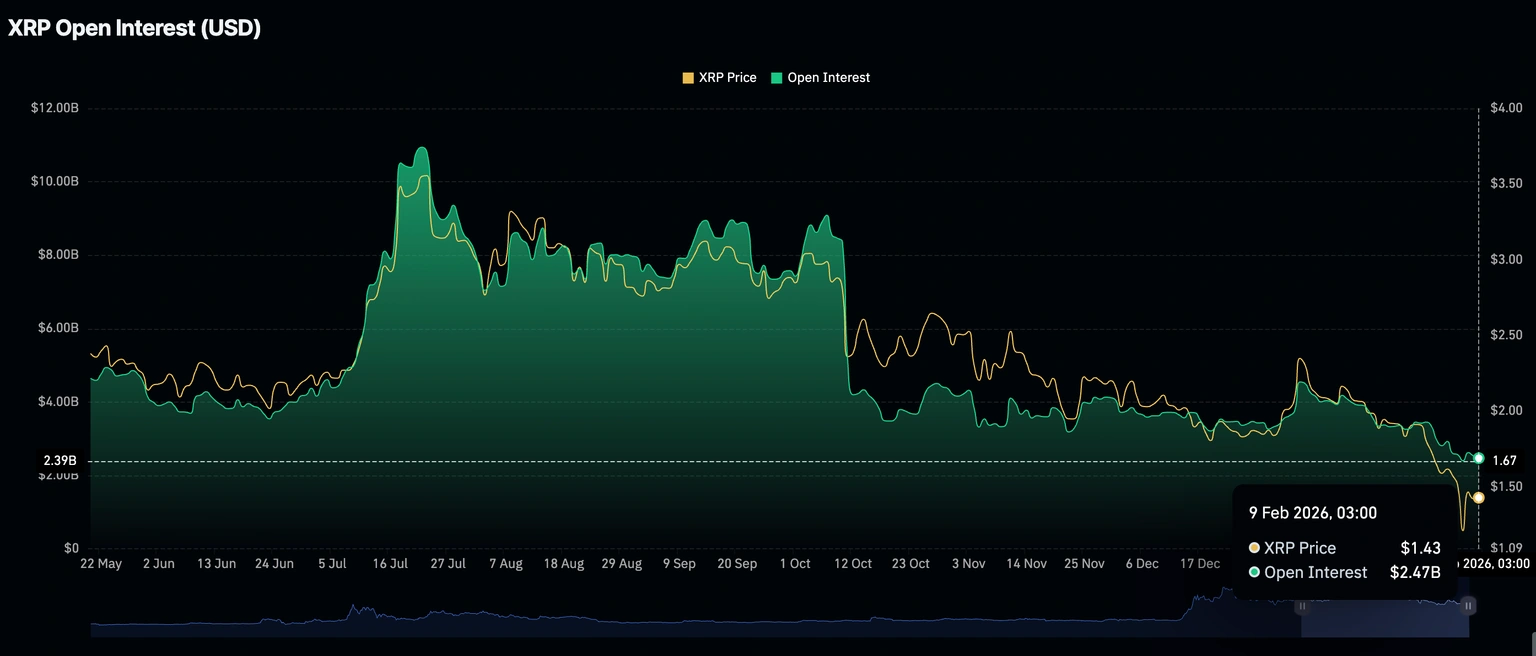
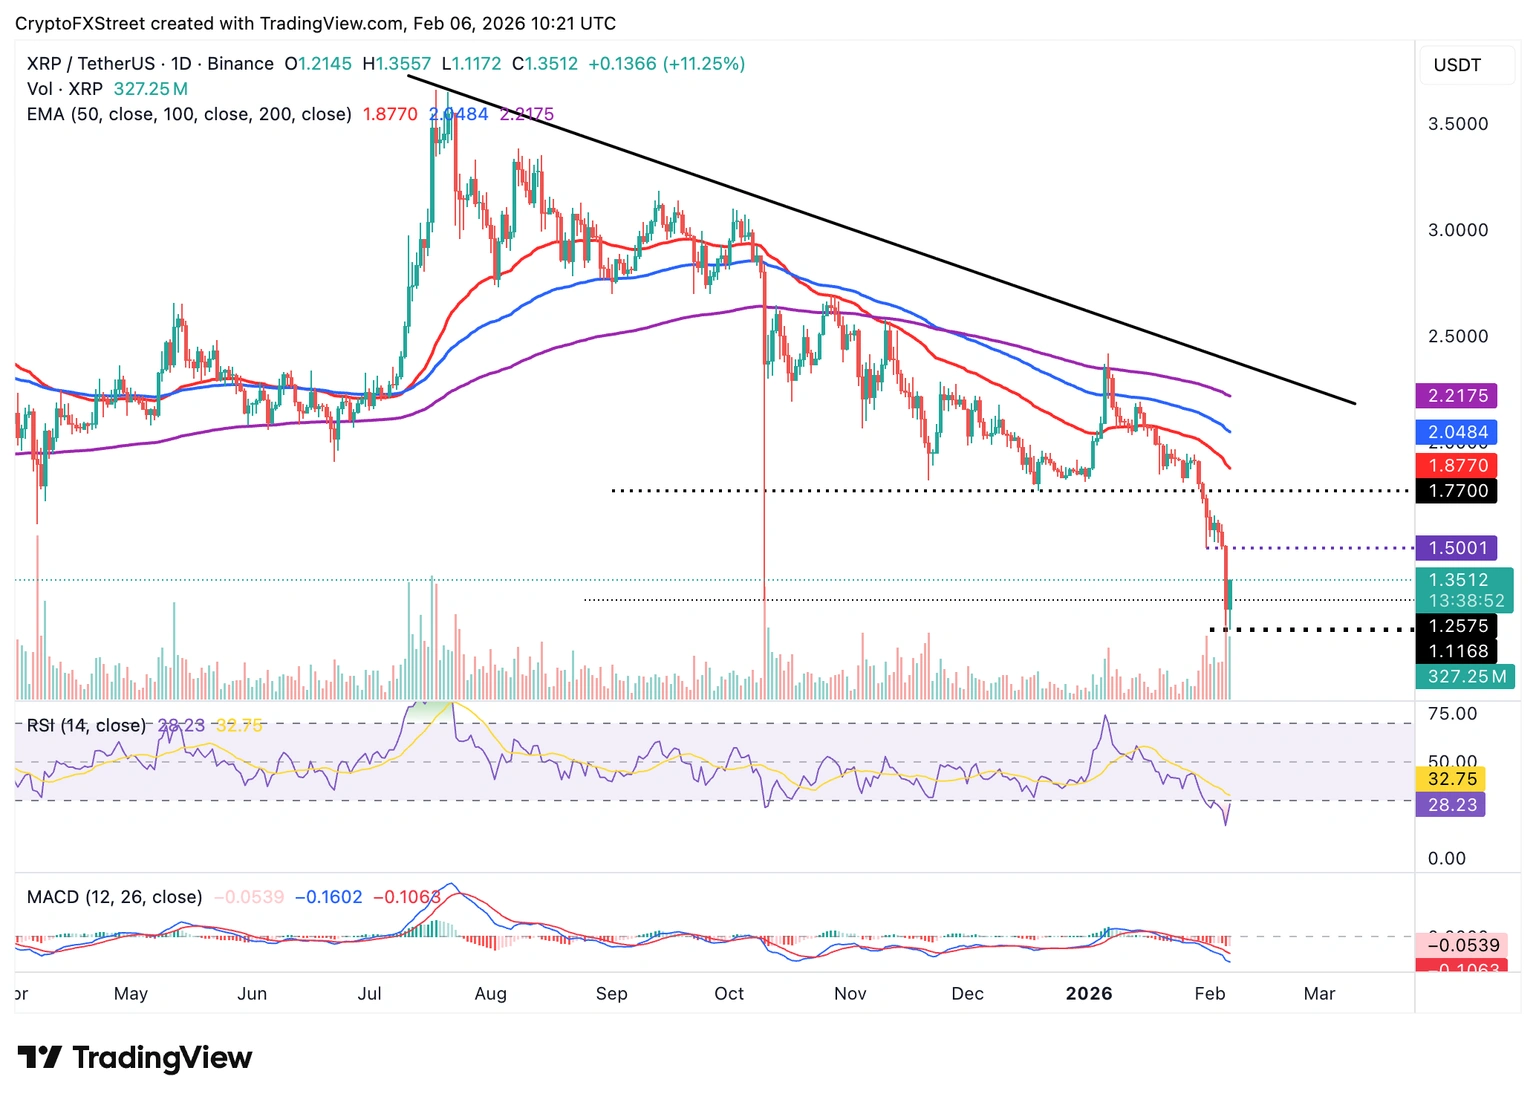
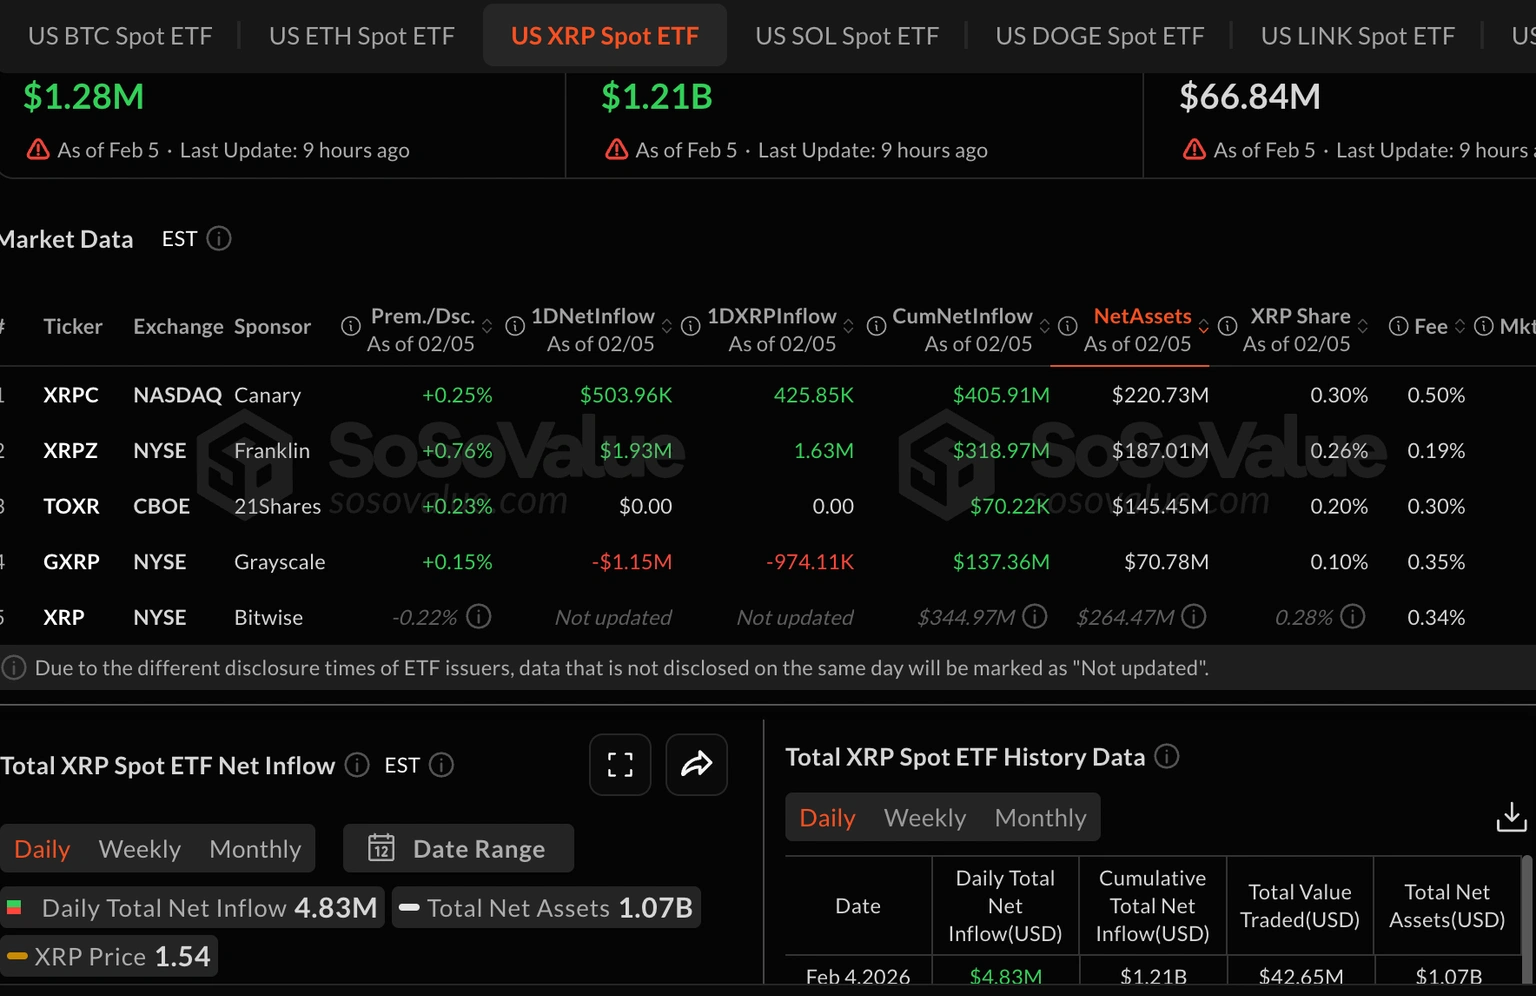
Entretanto, os ETFs de XRP registaram fluxos de saída ligeiros de cerca de 405.000 dólares na segunda-feira, após terem registado fluxos internos significativos de cerca de 17 milhões de dólares na sexta-feira. O valor total dos ETFs de XRP é de 1,18 mil milhões de dólares, enquanto o valor líquido dos ativos sob gestão é de 1,11 mil milhões de dólares, de acordo com dados da SoSoValue.
Fluxos de ETFs de XRP | Fonte: SoSoValue
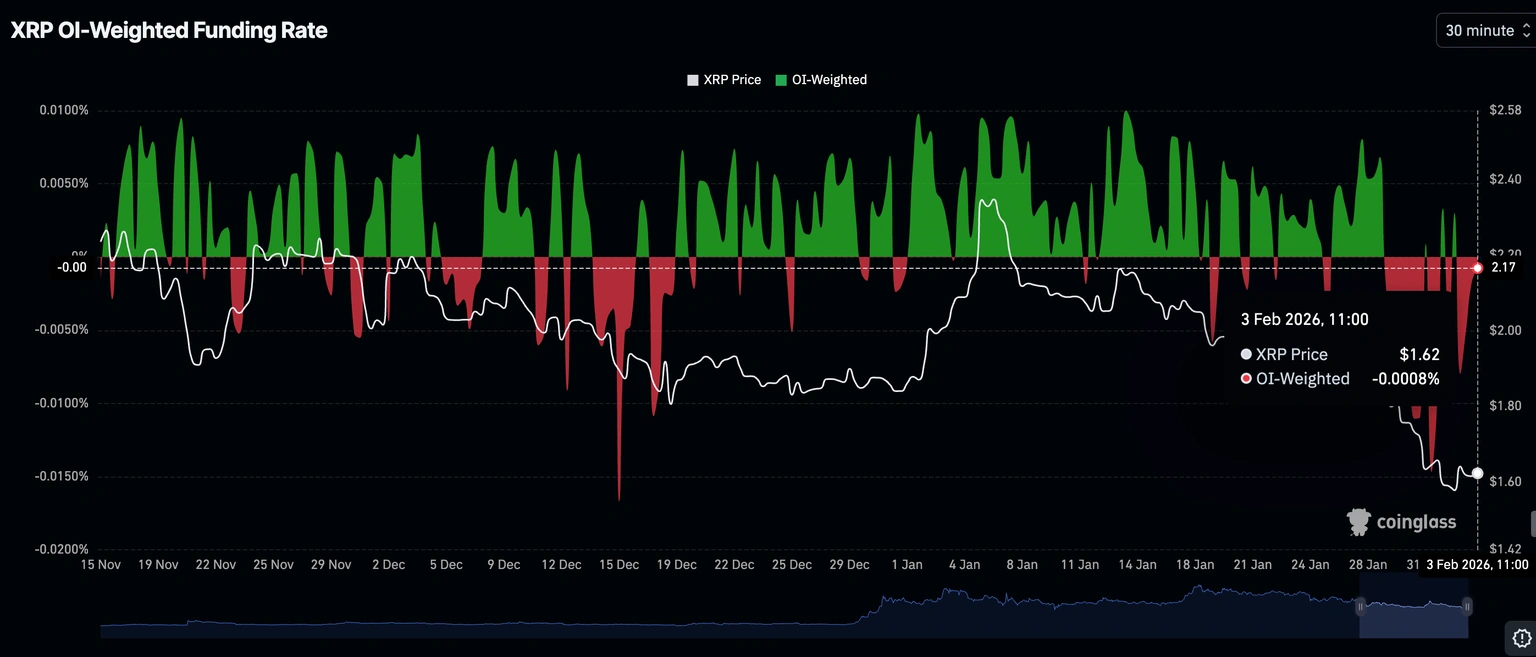
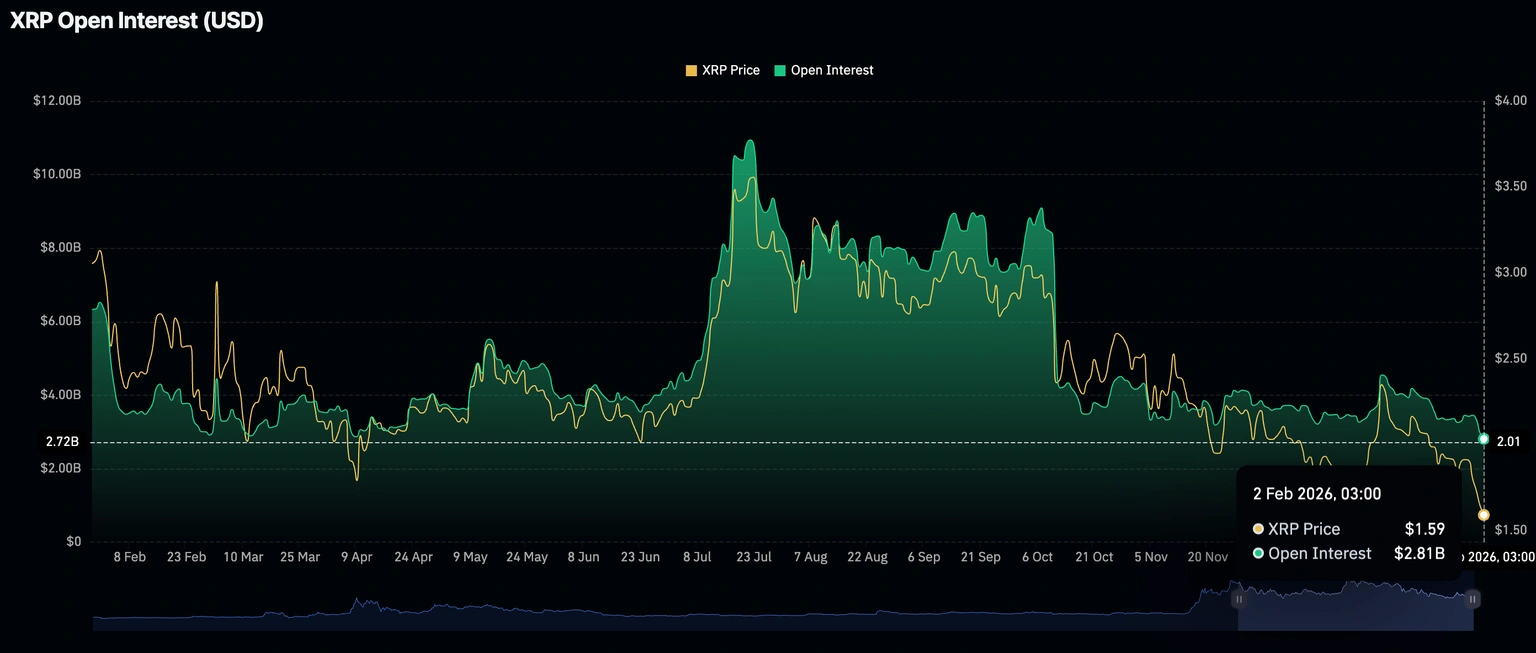
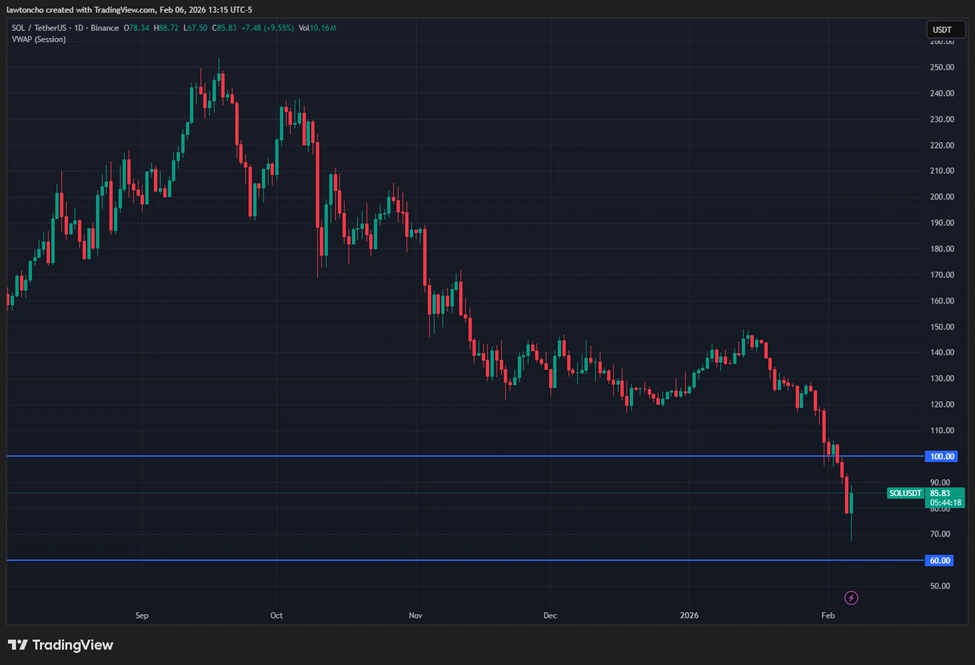
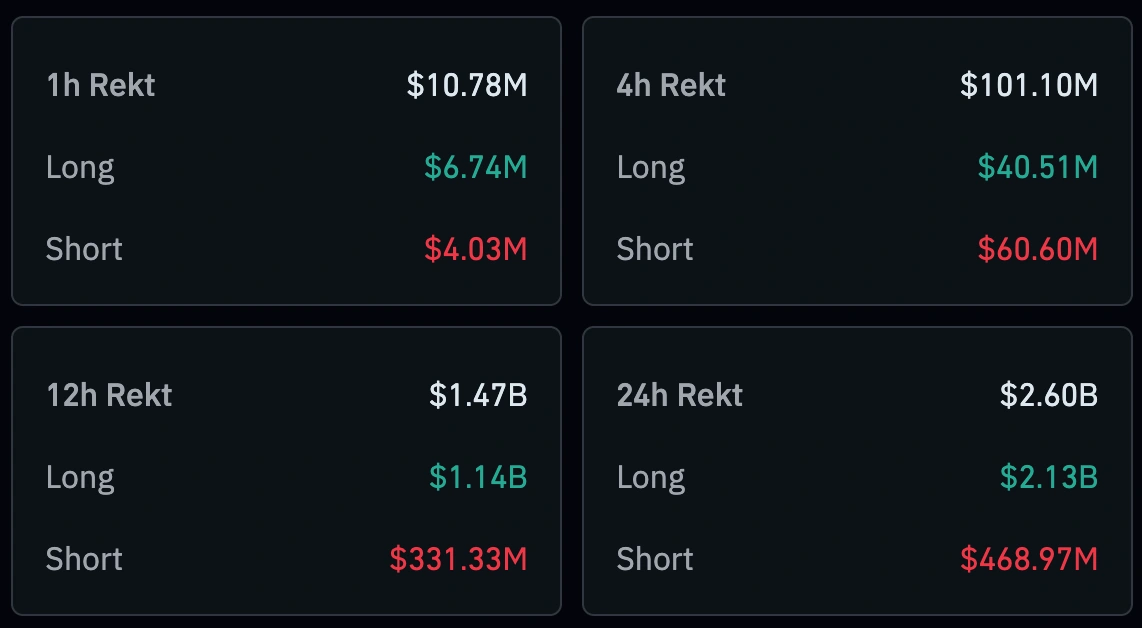
O mercado de retalho continua cauteloso, com os traders a preferirem fechar posições em vez de abrir novas. Dados do CoinGlass indicam que a taxa de financiamento ponderada pela taxa de juro aberta de XRP permanece negativa em -0,0008% na terça-feira, tendo subido de -0,0080% no dia anterior.
Para que o XRP mantenha a sua tendência de alta, a taxa de financiamento deve subir de forma constante para a zona positiva e continuar a aumentar, indicando um interesse constante por parte dos investidores individuais.
Taxa de financiamento ponderada por depósitos abertos de XRP | Fonte: CoinGlass
As ETFs de Bitcoin à vista listadas nos Estados Unidos registaram fluxos de caixa de cerca de 562 milhões de dólares na segunda-feira. Isto representa um retorno do interesse institucional, pondo fim a uma série de quatro dias de fluxos de saída que levaram a uma queda no desempenho do preço do Bitcoin.
O total de fluxos de entrada atualmente é de 55,57 mil milhões de dólares, enquanto o valor dos ativos sob gestão é de 100,38 mil milhões de dólares. Os fluxos de caixa estáveis para fundos de índice cotados indicam um sentimento positivo no mercado, o que pode contribuir para apoiar a recuperação do Bitcoin.
Fluxos de ETFs de Bitcoin | Fonte: SoSoValue
Por outro lado, os ETFs de Ethereum à vista continuam a tendência de saídas de investimento pelo terceiro dia consecutivo, com investidores a retirar cerca de 3 milhões de dólares na segunda-feira. O total de fluxos de entrada agora é de 11,97 mil milhões de dólares, com um valor médio de ativos líquidos de 13,69 mil milhões de dólares. A continuação dos fluxos de investimento de saída pode diminuir o sentimento, desacelerando o ritmo de recuperação.
Fluxos de ETFs de Ethereum | Fonte: SoSoValue
Entretanto, os ETFs de XRP registaram fluxos de saída ligeiros de cerca de 405.000 dólares na segunda-feira, após terem registado fluxos internos significativos de cerca de 17 milhões de dólares na sexta-feira. O valor total dos ETFs de XRP é de 1,18 mil milhões de dólares, enquanto o valor líquido dos ativos sob gestão é de 1,11 mil milhões de dólares, de acordo com dados da SoSoValue.
Fluxos de ETFs de XRP | Fonte: SoSoValue
O mercado de retalho continua cauteloso, com os traders a preferirem fechar posições em vez de abrir novas. Dados do CoinGlass indicam que a taxa de financiamento ponderada pela taxa de juro aberta de XRP permanece negativa em -0,0008% na terça-feira, tendo subido de -0,0080% no dia anterior.
Para que o XRP mantenha a sua tendência de alta, a taxa de financiamento deve subir de forma constante para a zona positiva e continuar a aumentar, indicando um interesse constante por parte dos investidores individuais.
Taxa de financiamento ponderada por depósitos abertos de XRP | Fonte: CoinGlass