2025 MOZ Price Prediction: Analyzing Market Trends and Potential Growth Factors
Introduction: MOZ's Market Position and Investment Value
Lumoz (MOZ), as a leading Modular Compute Layer & RaaS platform, has been providing computing power and verification services for ZK and AI applications on chains with different architectures since its inception. As of 2025, Lumoz's market capitalization has reached $386,540, with a circulating supply of approximately 1,100,000,000 tokens, and a price hovering around $0.0003514. This asset, known as the "Modular Compute Layer," is playing an increasingly crucial role in the field of blockchain-based ZK and AI applications.
This article will comprehensively analyze Lumoz's price trends from 2025 to 2030, combining historical patterns, market supply and demand, ecosystem development, and macroeconomic environment to provide investors with professional price predictions and practical investment strategies.
I. MOZ Price History Review and Current Market Status
MOZ Historical Price Evolution Trajectory
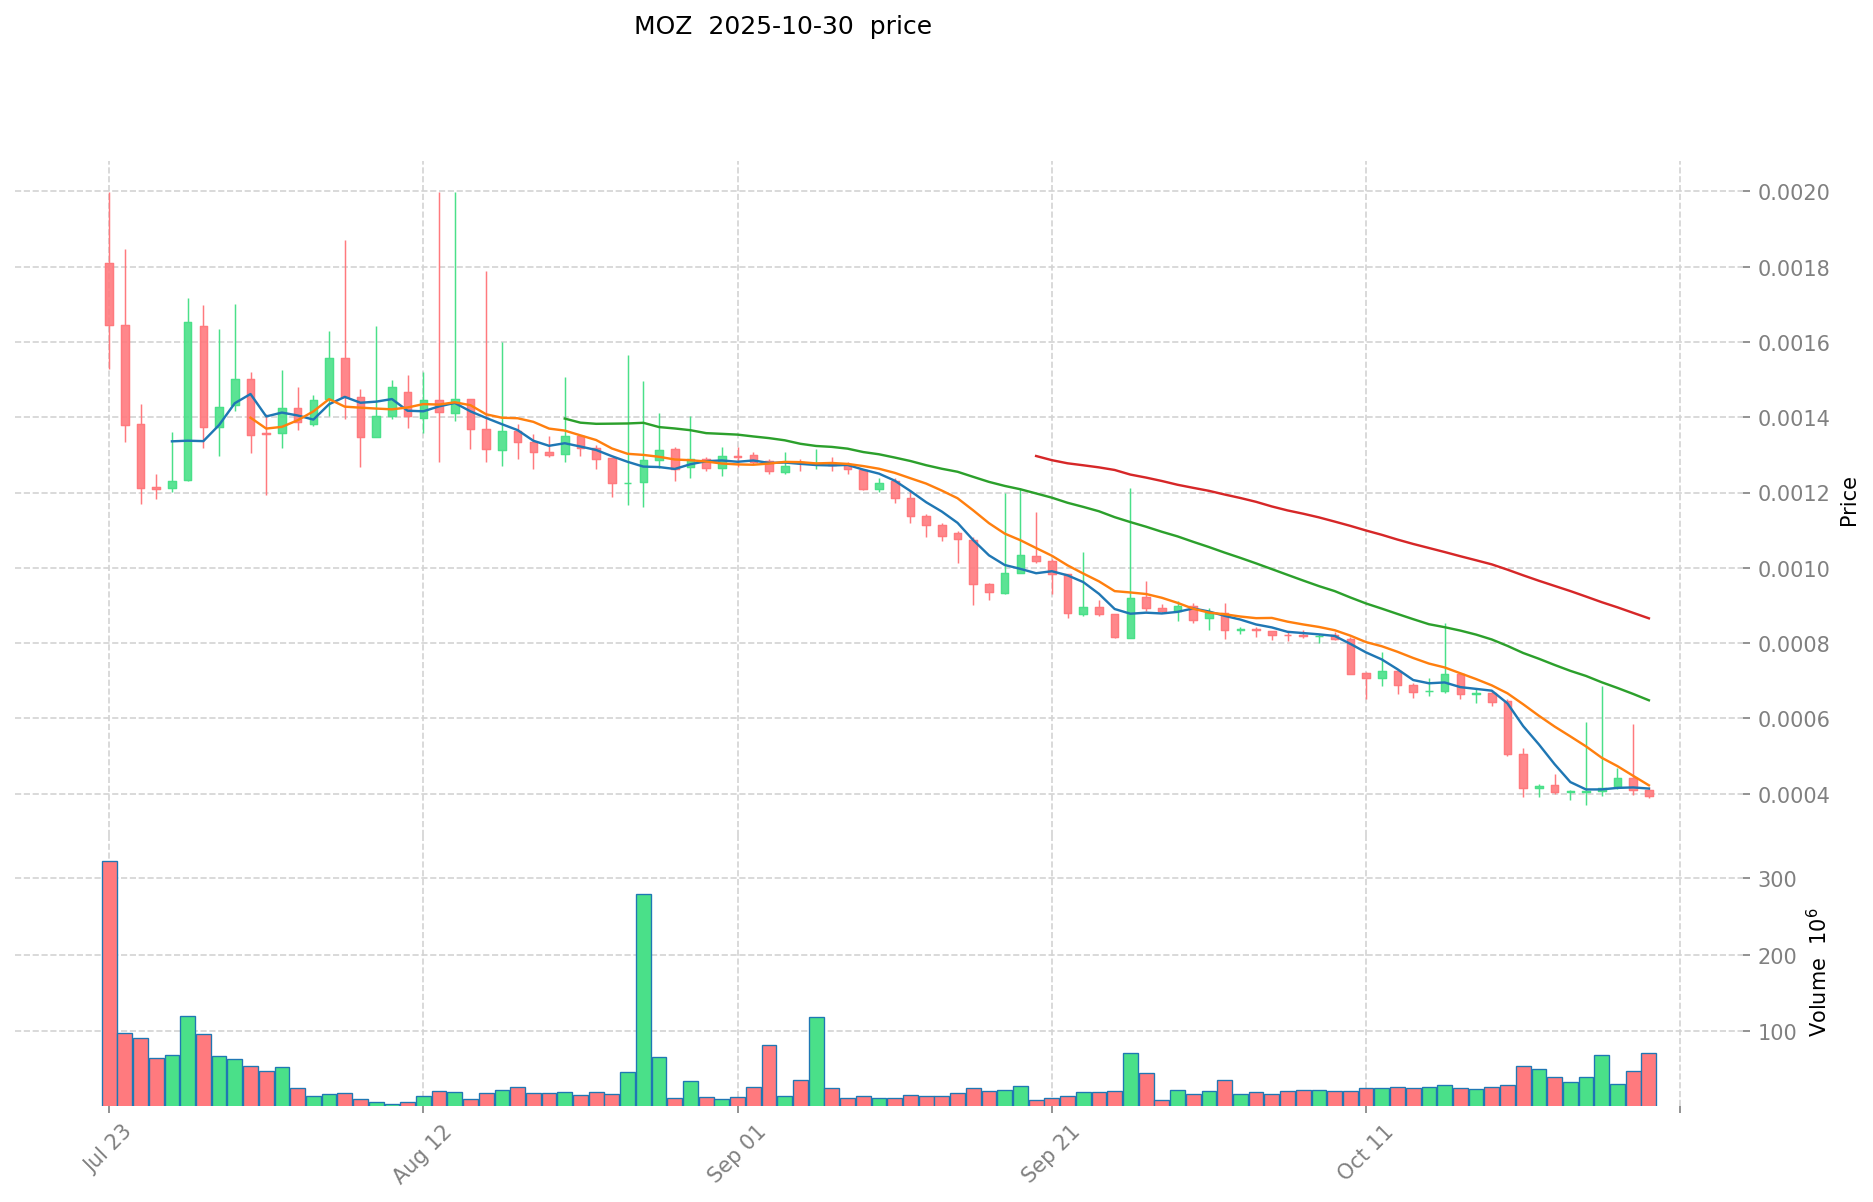
- 2024: Project launch, price reached an all-time high of $0.05748 on December 10
- 2025: Significant market downturn, price dropped to an all-time low of $0.0003258 on October 30
MOZ Current Market Situation
As of October 31, 2025, MOZ is trading at $0.0003514, experiencing a 12.03% decrease in the last 24 hours. The token's market capitalization stands at $386,540, ranking 3666th in the crypto market. MOZ has seen a substantial decline of 93.17% over the past year, reflecting a bearish trend. The 24-hour trading volume is $27,707.65, indicating moderate market activity. The current price is 99.39% below its all-time high, suggesting a prolonged bearish phase. The circulating supply is 1,100,000,000 MOZ, representing 11% of the total supply of 10,000,000,000 tokens.
Click to view the current MOZ market price
MOZ Market Sentiment Indicator
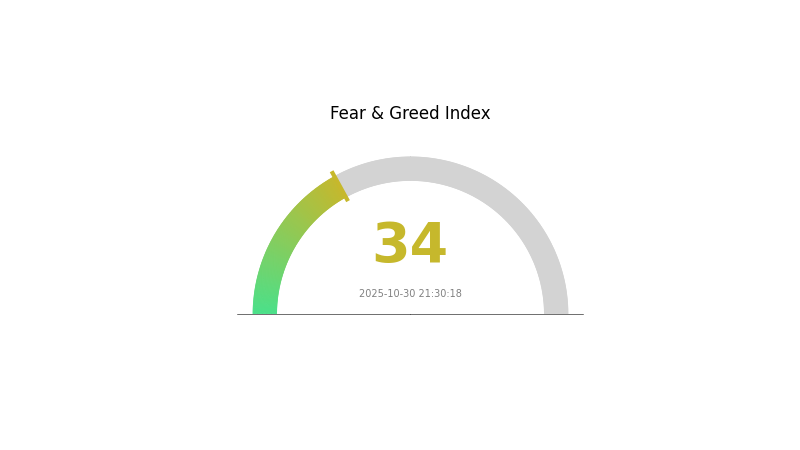
2025-10-30 Fear and Greed Index: 34 (Fear)
Click to view the current Fear & Greed Index
The crypto market is currently experiencing a period of fear, with the sentiment indicator at 34. This suggests investors are becoming cautious, potentially due to recent market volatility or negative news. During such times, some traders view it as an opportunity to buy, following the adage "be greedy when others are fearful." However, it's crucial to conduct thorough research and manage risks carefully. Keep an eye on market trends and stay informed about factors influencing crypto prices before making any investment decisions.
MOZ Holdings Distribution
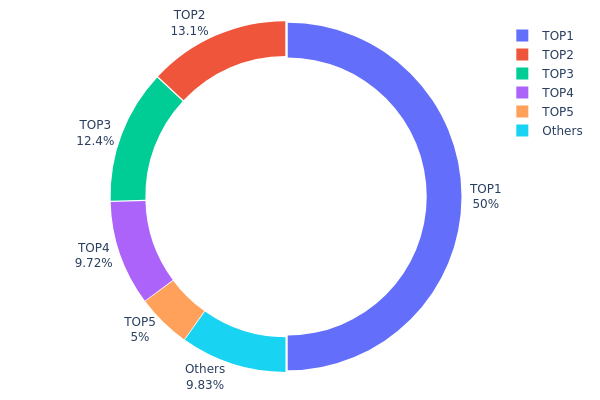
The address holdings distribution data reveals a highly concentrated ownership structure for MOZ. The top address holds 50% of the total supply, while the top 5 addresses collectively control 90.16% of MOZ tokens. This level of concentration raises concerns about market centralization and potential price manipulation risks.
Such a concentrated distribution can lead to increased volatility and susceptibility to large price swings if major holders decide to sell. It also indicates a low level of decentralization, which may impact the project's governance and decision-making processes. The presence of a single address holding half the supply suggests a significant centralized influence over the token's ecosystem.
This distribution pattern reflects a market structure with limited liquidity spread across smaller holders, potentially affecting price discovery and trading dynamics. Investors should be aware of these concentration risks when considering MOZ, as they could impact the token's long-term stability and adoption potential.
Click to view the current MOZ Holdings Distribution
| Top | Address | Holding Qty | Holding (%) |
|---|---|---|---|
| 1 | 0x7210...b45e98 | 5000000.00K | 50.00% |
| 2 | 0xf89d...5eaa40 | 1307214.85K | 13.07% |
| 3 | 0xa4f8...12a060 | 1237250.00K | 12.37% |
| 4 | 0xdc8f...4e6803 | 972500.00K | 9.72% |
| 5 | 0xd0f5...a27f31 | 500000.00K | 5.00% |
| - | Others | 983035.15K | 9.84% |
II. Key Factors Affecting MOZ's Future Price
Supply Mechanism
- Token Distribution: 100 billion MOZ tokens in total, with 66% allocated to community, ecosystem, nodes, and miners. Initial circulating supply is about 11%.
- Historical Pattern: The distribution of tokens to various stakeholders has been a key factor in price stability.
- Current Impact: The large allocation to community and ecosystem development may contribute to long-term price support.
Institutional and Whale Dynamics
- Institutional Holdings: Team and venture capital holdings play a significant role in price stability during the token issuance process.
Technical Development and Ecosystem Building
- Modular Architecture: Lumoz's core feature is a modular architecture that enables seamless integration between different applications, facilitating resource-intensive tasks.
- AI and ZK Computation: The platform supports zero-knowledge proof computation and AI services, which are paid for using MOZ tokens.
- Ecosystem Applications: MOZ tokens serve multiple functions including governance, incentives, and payments within the Lumoz ecosystem, contributing to platform development and market liquidity.
III. MOZ Price Prediction for 2025-2030
2025 Outlook
- Conservative prediction: $0.00027 - $0.00035
- Neutral prediction: $0.00035 - $0.00043
- Optimistic prediction: $0.00043 - $0.00051 (requires positive market sentiment)
2026-2028 Outlook
- Market phase expectation: Gradual growth phase
- Price range forecast:
- 2026: $0.00026 - $0.00044
- 2027: $0.00036 - $0.00051
- 2028: $0.00035 - $0.00050
- Key catalysts: Increased adoption, technological improvements, and overall crypto market recovery
2029-2030 Long-term Outlook
- Base scenario: $0.00048 - $0.00054 (assuming steady market growth)
- Optimistic scenario: $0.00054 - $0.00060 (assuming strong market performance)
- Transformative scenario: $0.00060+ (assuming breakthrough developments and mass adoption)
- 2030-12-31: MOZ $0.00058 (potential peak price)
| 年份 | 预测最高价 | 预测平均价格 | 预测最低价 | 涨跌幅 |
|---|---|---|---|---|
| 2025 | 0.00051 | 0.00035 | 0.00027 | 0 |
| 2026 | 0.00044 | 0.00043 | 0.00026 | 22 |
| 2027 | 0.00051 | 0.00044 | 0.00036 | 23 |
| 2028 | 0.0005 | 0.00047 | 0.00035 | 33 |
| 2029 | 0.0006 | 0.00048 | 0.00028 | 37 |
| 2030 | 0.00058 | 0.00054 | 0.00037 | 52 |
IV. MOZ Professional Investment Strategies and Risk Management
MOZ Investment Methodology
(1) Long-term Holding Strategy
- Suitable for: Long-term investors with high risk tolerance
- Operation suggestions:
- Accumulate MOZ tokens during market dips
- Set price targets for partial profit-taking
- Store tokens in secure wallets with private key control
(2) Active Trading Strategy
- Technical analysis tools:
- Moving Averages: Identify trend directions and potential reversals
- RSI (Relative Strength Index): Spot overbought or oversold conditions
- Key points for swing trading:
- Monitor market sentiment and news related to Lumoz
- Set stop-loss orders to limit potential losses
MOZ Risk Management Framework
(1) Asset Allocation Principles
- Conservative investors: 1-3% of crypto portfolio
- Aggressive investors: 5-10% of crypto portfolio
- Professional investors: 10-15% of crypto portfolio
(2) Risk Hedging Solutions
- Diversification: Spread investments across different crypto assets
- Stop-loss orders: Implement automatic sell orders to limit potential losses
(3) Secure Storage Solutions
- Hardware wallet recommendation: Gate web3 wallet
- Software wallet option: Official Lumoz wallet (if available)
- Security precautions: Enable two-factor authentication, use strong passwords, and regularly update software
V. MOZ Potential Risks and Challenges
MOZ Market Risks
- High volatility: MOZ price may experience significant fluctuations
- Limited liquidity: Trading volume may be low, affecting ease of entry and exit
- Competition: Other modular compute layer projects may emerge and gain market share
MOZ Regulatory Risks
- Uncertain regulatory environment: Potential changes in cryptocurrency regulations
- Cross-border restrictions: Varying legal status of MOZ in different jurisdictions
- Compliance challenges: Possible difficulties in meeting future regulatory requirements
MOZ Technical Risks
- Smart contract vulnerabilities: Potential security flaws in the Lumoz protocol
- Scalability issues: Challenges in handling increased network demand
- Interoperability concerns: Potential difficulties in integrating with other blockchain networks
VI. Conclusion and Action Recommendations
MOZ Investment Value Assessment
MOZ presents a high-risk, high-potential investment opportunity in the modular compute layer and RaaS sector. While it offers innovative technology, the project faces significant market, regulatory, and technical risks.
MOZ Investment Recommendations
✅ Beginners: Limit exposure to a small portion of portfolio, focus on learning ✅ Experienced investors: Consider a moderate allocation based on risk tolerance ✅ Institutional investors: Conduct thorough due diligence and consider strategic partnerships
MOZ Trading Participation Methods
- Spot trading: Buy and sell MOZ tokens on Gate.com
- Staking: Participate in staking programs if offered by Lumoz
- DeFi integration: Explore decentralized finance opportunities involving MOZ tokens
Cryptocurrency investments carry extremely high risks, and this article does not constitute investment advice. Investors should make decisions carefully based on their own risk tolerance and are advised to consult professional financial advisors. Never invest more than you can afford to lose.
FAQ
Can Solana reach $1000 in 2025?
Yes, Solana could potentially reach $1000 in 2025. Strong adoption, technological advancements, and favorable market conditions could drive significant price growth.
What crypto has the highest price prediction?
Bitcoin and Ethereum have the highest price predictions for 2025. Both show strong potential, but exact future prices remain uncertain in the volatile crypto market.
Can Matic reach $3?
Yes, Matic could reach $3. Increased development activity and favorable market conditions support this target. As of 2025, it remains a viable possibility.
What is the total supply of Moz coin?
The total supply of Moz coin is 1 billion tokens. This fixed supply helps maintain scarcity and potential value for the MOZ ecosystem.
Share
Content
Introduction: MOZ's Market Position and Investment Value
I. MOZ Price History Review and Current Market Status
II. Key Factors Affecting MOZ's Future Price
III. MOZ Price Prediction for 2025-2030
IV. MOZ Professional Investment Strategies and Risk Management
V. MOZ Potential Risks and Challenges
VI. Conclusion and Action Recommendations
FAQ

