2025 ONC Price Prediction: Bullish Trends and Key Factors Shaping the Future of ONC Tokens
Introduction: ONC's Market Position and Investment Value
One Cash (ONC), as an experimental project based on the Basis protocol, has been making bold innovations since its inception. As of 2025, One Cash's market capitalization has reached $90,017, with a circulating supply of approximately 1,531,947 tokens, and a price hovering around $0.05876. This asset, known as "the innovative Basis protocol experiment," is playing an increasingly crucial role in exploring new possibilities within decentralized finance.
This article will comprehensively analyze One Cash's price trends from 2025 to 2030, combining historical patterns, market supply and demand, ecosystem development, and macroeconomic factors to provide investors with professional price predictions and practical investment strategies.
I. ONC Price History Review and Current Market Status
ONC Historical Price Evolution
- 2020: Project launch, price reached all-time high of $1,634.01 on December 31
- 2025: Market volatility, price dropped to all-time low of $0.03781224 on April 28
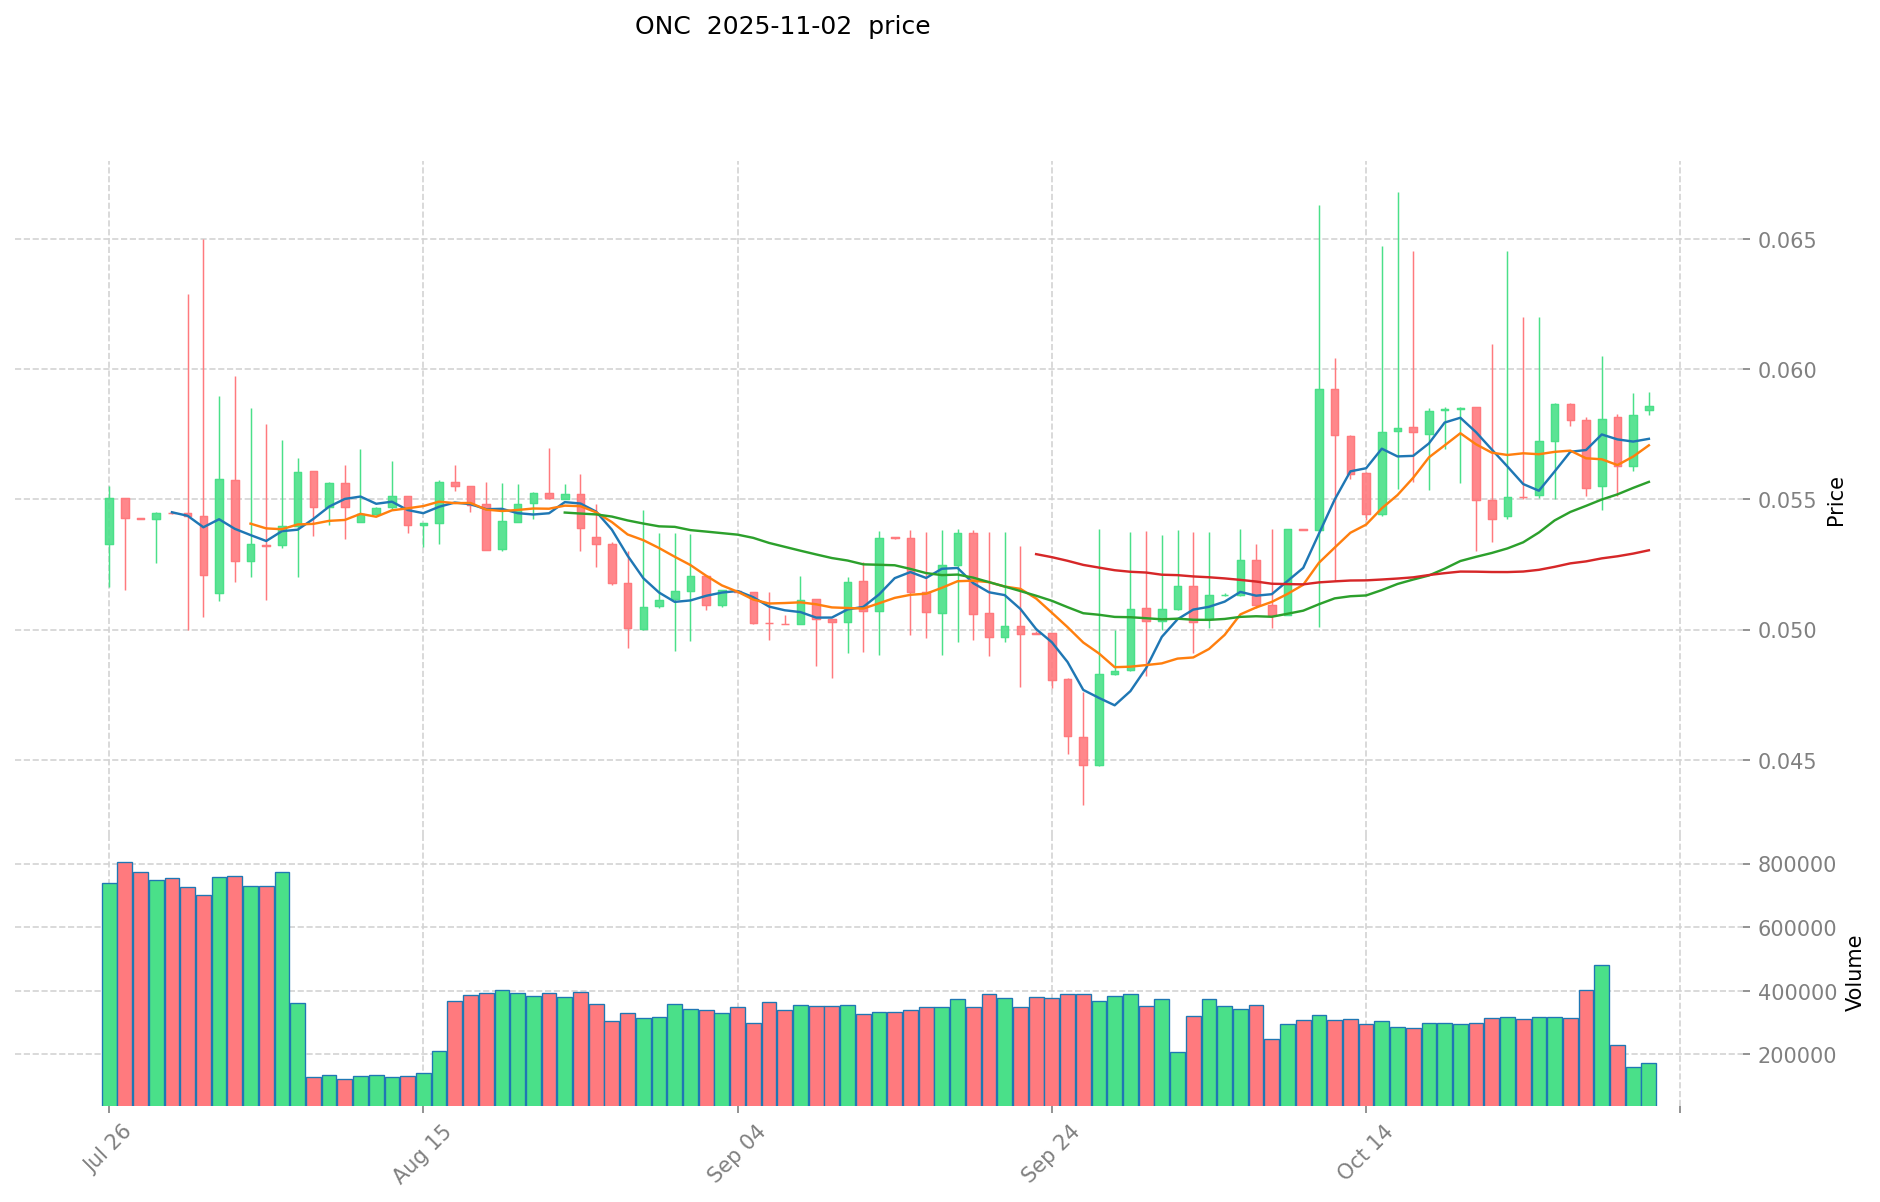
- 2025: Recovery phase, current price at $0.05876 as of November 2
ONC Current Market Situation
As of November 2, 2025, ONC is trading at $0.05876. The 24-hour trading volume stands at $10,028.55, with a market capitalization of $90,017.21. ONC has shown positive short-term performance, with a 0.31% increase in the last hour and a 0.87% gain in the past 24 hours. The 7-day and 30-day trends are also encouraging, with 2.64% and 13.74% increases respectively. However, the one-year performance shows a 4.83% decline.
The current circulating supply of ONC is 1,531,947.15 tokens, which is equal to its total and maximum supply. This indicates that all ONC tokens are in circulation, with no future inflation expected from additional token releases.
ONC's market dominance is relatively small at 0.0000022%, suggesting it is a niche project in the broader cryptocurrency market. The fully diluted valuation matches the current market cap, further confirming that all tokens are in circulation.
Click to view the current ONC market price
ONC Market Sentiment Indicator
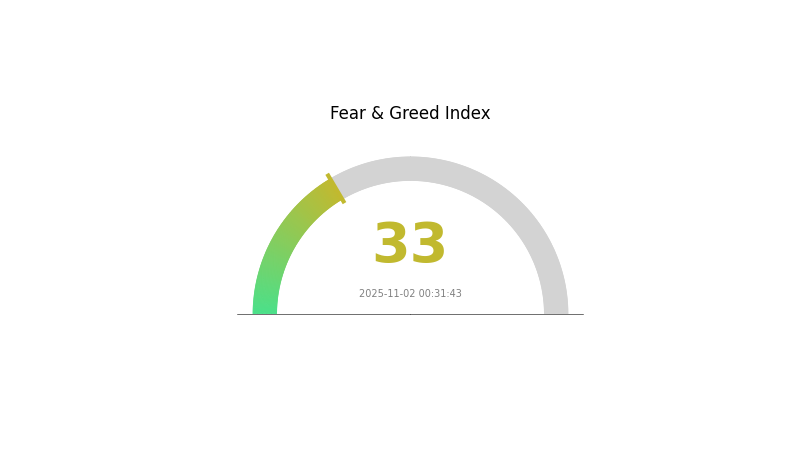
2025-11-02 Fear and Greed Index: 33 (Fear)
Click to view the current Fear & Greed Index
The cryptocurrency market is currently in a state of fear, with the Fear and Greed Index registering at 33. This indicates a cautious sentiment among investors, potentially stemming from market uncertainties or recent price fluctuations. During such periods, some traders may view this as an opportunity to accumulate assets at lower prices, adhering to the "buy the fear" strategy. However, it's crucial to conduct thorough research and consider your risk tolerance before making any investment decisions.
ONC Holdings Distribution
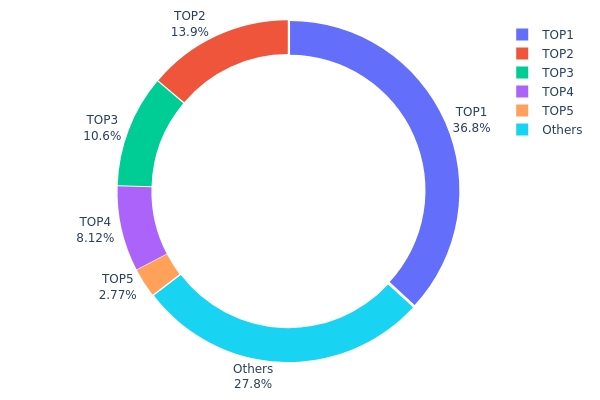
The address holdings distribution data provides crucial insights into the concentration of ONC tokens across different wallet addresses. Analysis of this data reveals a significant level of centralization in ONC holdings. The top address holds a substantial 36.84% of the total supply, while the top five addresses collectively control 72.21% of all ONC tokens.
This high concentration of tokens in a few addresses raises concerns about market stability and potential price manipulation. With such a large portion of the supply controlled by a small number of entities, there is an increased risk of significant price swings should these major holders decide to sell or accumulate more tokens. Furthermore, this concentration may impact the overall decentralization and governance of the ONC ecosystem, as these large holders could potentially exert disproportionate influence on decision-making processes.
The current distribution pattern suggests that ONC's on-chain structure may be less stable than ideal for a truly decentralized asset. While the presence of a 27.79% distribution among "Others" indicates some level of broader ownership, the dominance of the top holders remains a point of consideration for potential investors and users of the ONC network.
Click to view the current ONC Holdings Distribution
| Top | Address | Holding Qty | Holding (%) |
|---|---|---|---|
| 1 | 0x0d07...b492fe | 564.38K | 36.84% |
| 2 | 0x1c4b...bb558c | 212.33K | 13.86% |
| 3 | 0x3ba3...03f961 | 163.12K | 10.64% |
| 4 | 0xd0be...529be0 | 124.37K | 8.11% |
| 5 | 0xd6c8...87eaa0 | 42.36K | 2.76% |
| - | Others | 425.39K | 27.79% |
II. Key Factors Influencing Future ONC Price
Supply Mechanism
- Halving Mechanism: Similar to Bitcoin, ONC may have a halving mechanism that reduces mining rewards periodically, potentially increasing scarcity and price.
- Historical Pattern: Previous supply changes have typically led to price increases due to increased scarcity.
- Current Impact: The next halving event is anticipated to reduce supply and potentially drive up ONC prices.
Institutional and Whale Dynamics
- Institutional Holdings: Major financial institutions are increasingly adding ONC to their portfolios, signaling growing mainstream acceptance.
- Corporate Adoption: Several Fortune 500 companies have begun accepting ONC as payment or adding it to their balance sheets.
- Government Policies: Regulatory clarity in major economies is gradually emerging, potentially impacting institutional involvement.
Macroeconomic Environment
- Monetary Policy Impact: Central bank policies, particularly those of the Federal Reserve, continue to influence ONC's perceived value as a hedge against inflation.
- Inflation Hedge Properties: ONC has shown resilience during periods of high inflation, attracting investors seeking to preserve wealth.
- Geopolitical Factors: Global economic uncertainties and geopolitical tensions have periodically driven investors towards ONC as a safe-haven asset.
Technical Development and Ecosystem Growth
- Scalability Upgrades: Ongoing improvements to ONC's blockchain infrastructure aim to increase transaction speeds and reduce fees.
- Smart Contract Functionality: The introduction of smart contract capabilities is expanding ONC's utility in decentralized finance applications.
- Ecosystem Applications: A growing number of decentralized applications (DApps) are being built on the ONC network, enhancing its overall value proposition.
III. ONC Price Prediction for 2025-2030
2025 Outlook
- Conservative prediction: $0.04231 - $0.05876
- Neutral prediction: $0.05876 - $0.06787
- Optimistic prediction: $0.06787 - $0.07698 (requires positive market sentiment and increased adoption)
2027-2028 Outlook
- Market stage expectation: Potential growth phase with increasing volatility
- Price range forecast:
- 2027: $0.06731 - $0.10949
- 2028: $0.05337 - $0.13532
- Key catalysts: Technological advancements, wider market acceptance, and potential partnerships
2029-2030 Long-term Outlook
- Base scenario: $0.09801 - $0.11819 (assuming steady market growth and adoption)
- Optimistic scenario: $0.11819 - $0.12174 (given favorable market conditions and increased utility)
- Transformative scenario: $0.12174 - $0.13532 (under extremely favorable conditions and breakthrough innovations)
- 2030-12-31: ONC $0.11819 (101% increase from 2025 levels)
| 年份 | 预测最高价 | 预测平均价格 | 预测最低价 | 涨跌幅 |
|---|---|---|---|---|
| 2025 | 0.07698 | 0.05876 | 0.04231 | 0 |
| 2026 | 0.09434 | 0.06787 | 0.05294 | 15 |
| 2027 | 0.10949 | 0.0811 | 0.06731 | 38 |
| 2028 | 0.13532 | 0.09529 | 0.05337 | 62 |
| 2029 | 0.12107 | 0.11531 | 0.09801 | 96 |
| 2030 | 0.12174 | 0.11819 | 0.10992 | 101 |
IV. Professional Investment Strategies and Risk Management for ONC
ONC Investment Methodology
(1) Long-term Holding Strategy
- Suitable for: Risk-tolerant investors with a long-term perspective
- Operational suggestions:
- Accumulate ONC during market dips
- Set price targets for partial profit-taking
- Store in secure cold wallets for long-term holding
(2) Active Trading Strategy
- Technical analysis tools:
- Moving Averages: Use to identify trends and support/resistance levels
- Relative Strength Index (RSI): Monitor overbought/oversold conditions
- Key points for swing trading:
- Identify key support and resistance levels
- Monitor trading volume for trend confirmation
ONC Risk Management Framework
(1) Asset Allocation Principles
- Conservative investors: 1-2% of crypto portfolio
- Aggressive investors: 3-5% of crypto portfolio
- Professional investors: 5-10% of crypto portfolio
(2) Risk Hedging Solutions
- Diversification: Spread investments across multiple cryptocurrencies
- Stop-loss orders: Set automatic sell orders to limit potential losses
(3) Secure Storage Solutions
- Hot wallet recommendation: Gate Web3 wallet
- Cold storage solution: Hardware wallets for long-term storage
- Security precautions: Enable two-factor authentication, use unique passwords
V. Potential Risks and Challenges for ONC
ONC Market Risks
- High volatility: ONC price can experience significant fluctuations
- Low liquidity: Limited trading volume may lead to price slippage
- Market sentiment: Susceptible to broader cryptocurrency market trends
ONC Regulatory Risks
- Uncertain regulatory environment: Potential for new regulations affecting ONC
- Compliance challenges: Possibility of facing regulatory scrutiny
- Cross-border restrictions: Varying legal status in different jurisdictions
ONC Technical Risks
- Smart contract vulnerabilities: Potential for exploits or bugs in the protocol
- Network congestion: Ethereum network issues may affect ONC transactions
- Technology obsolescence: Risk of being outpaced by newer DeFi protocols
VI. Conclusion and Action Recommendations
ONC Investment Value Assessment
ONC presents a high-risk, high-potential investment in the experimental DeFi space. While it offers innovative features based on the Basis protocol, investors should be aware of its volatile nature and the nascent stage of the project.
ONC Investment Recommendations
✅ Beginners: Limited exposure, focus on education and understanding the risks ✅ Experienced investors: Consider small allocations as part of a diversified portfolio ✅ Institutional investors: Thorough due diligence required, potential for strategic partnerships
ONC Trading Participation Methods
- Spot trading: Buy and sell ONC on Gate.com
- Yield farming: Explore liquidity provision opportunities if available
- DeFi interactions: Engage with the One Cash ecosystem for potential rewards
Cryptocurrency investments carry extremely high risks, and this article does not constitute investment advice. Investors should make decisions carefully based on their own risk tolerance and are advised to consult professional financial advisors. Never invest more than you can afford to lose.
FAQ
Is ONCY a good stock to buy?
ONCY stock shows a strong rising trend, suggesting a good buying opportunity. Current market conditions favor this investment. Consider your financial goals before investing.
What is the price target for ONC stock?
Based on analyst forecasts, the average price target for ONC stock is $345.60, with a high estimate of $385.00.
Will Canaan stock recover?
Canaan stock shows potential for recovery. Short-term outlook is mixed, but long-term trends suggest a positive future. Current levels may present a buying opportunity.
What is the 12 month forecast for ONCY stock?
The 12-month forecast for ONCY stock is an average price target of $4.59, with a high estimate of $7.
Share
Content
Introduction: ONC's Market Position and Investment Value
I. ONC Price History Review and Current Market Status
II. Key Factors Influencing Future ONC Price
III. ONC Price Prediction for 2025-2030
IV. Professional Investment Strategies and Risk Management for ONC
V. Potential Risks and Challenges for ONC
VI. Conclusion and Action Recommendations
FAQ

