2025 TIA Price Prediction: Analyzing Market Trends and Expert Forecasts for Celestia's Native Token

2025-11-14 21:32:37
Altcoins
Blockchain
Investing In Crypto
Layer 2
Web 3.0
Article Rating : 3
0 ratings
This article provides a detailed analysis of the price trends and investment strategies for Celestia's TIA token from 2025 to 2030. It explores historical price patterns, market dynamics, technological advancements, and macroeconomic factors affecting TIA's value, offering professional insights into its potential market performance. The article is aimed at different investor types, covering long-term holding and active trading methodologies while addressing risk management. Suitable for rapid scanning, it optimizes keyword density and readability, making it accessible for both beginners and experienced investors.
2025 TIA Price Prediction: Analyzing Market Trends and Expert Forecasts for Celestia's Native Token

Introduction: TIA's Market Position and Investment Value

Celestia (TIA), as a modular blockchain network offering pluggable data availability solutions, has made significant strides since its inception. As of 2025, Celestia's market capitalization has reached $739,463,529, with a circulating supply of approximately 838,394,023 TIA tokens, and a price hovering around $0.882. This asset, often referred to as a "game-changer in blockchain scalability," is playing an increasingly crucial role in enhancing data availability and reducing transaction costs for web3 developers.

This article will provide a comprehensive analysis of Celestia's price trends from 2025 to 2030, considering historical patterns, market supply and demand, ecosystem development, and macroeconomic factors to offer professional price predictions and practical investment strategies for investors.

I. TIA Price History Review and Current Market Status

TIA Historical Price Evolution

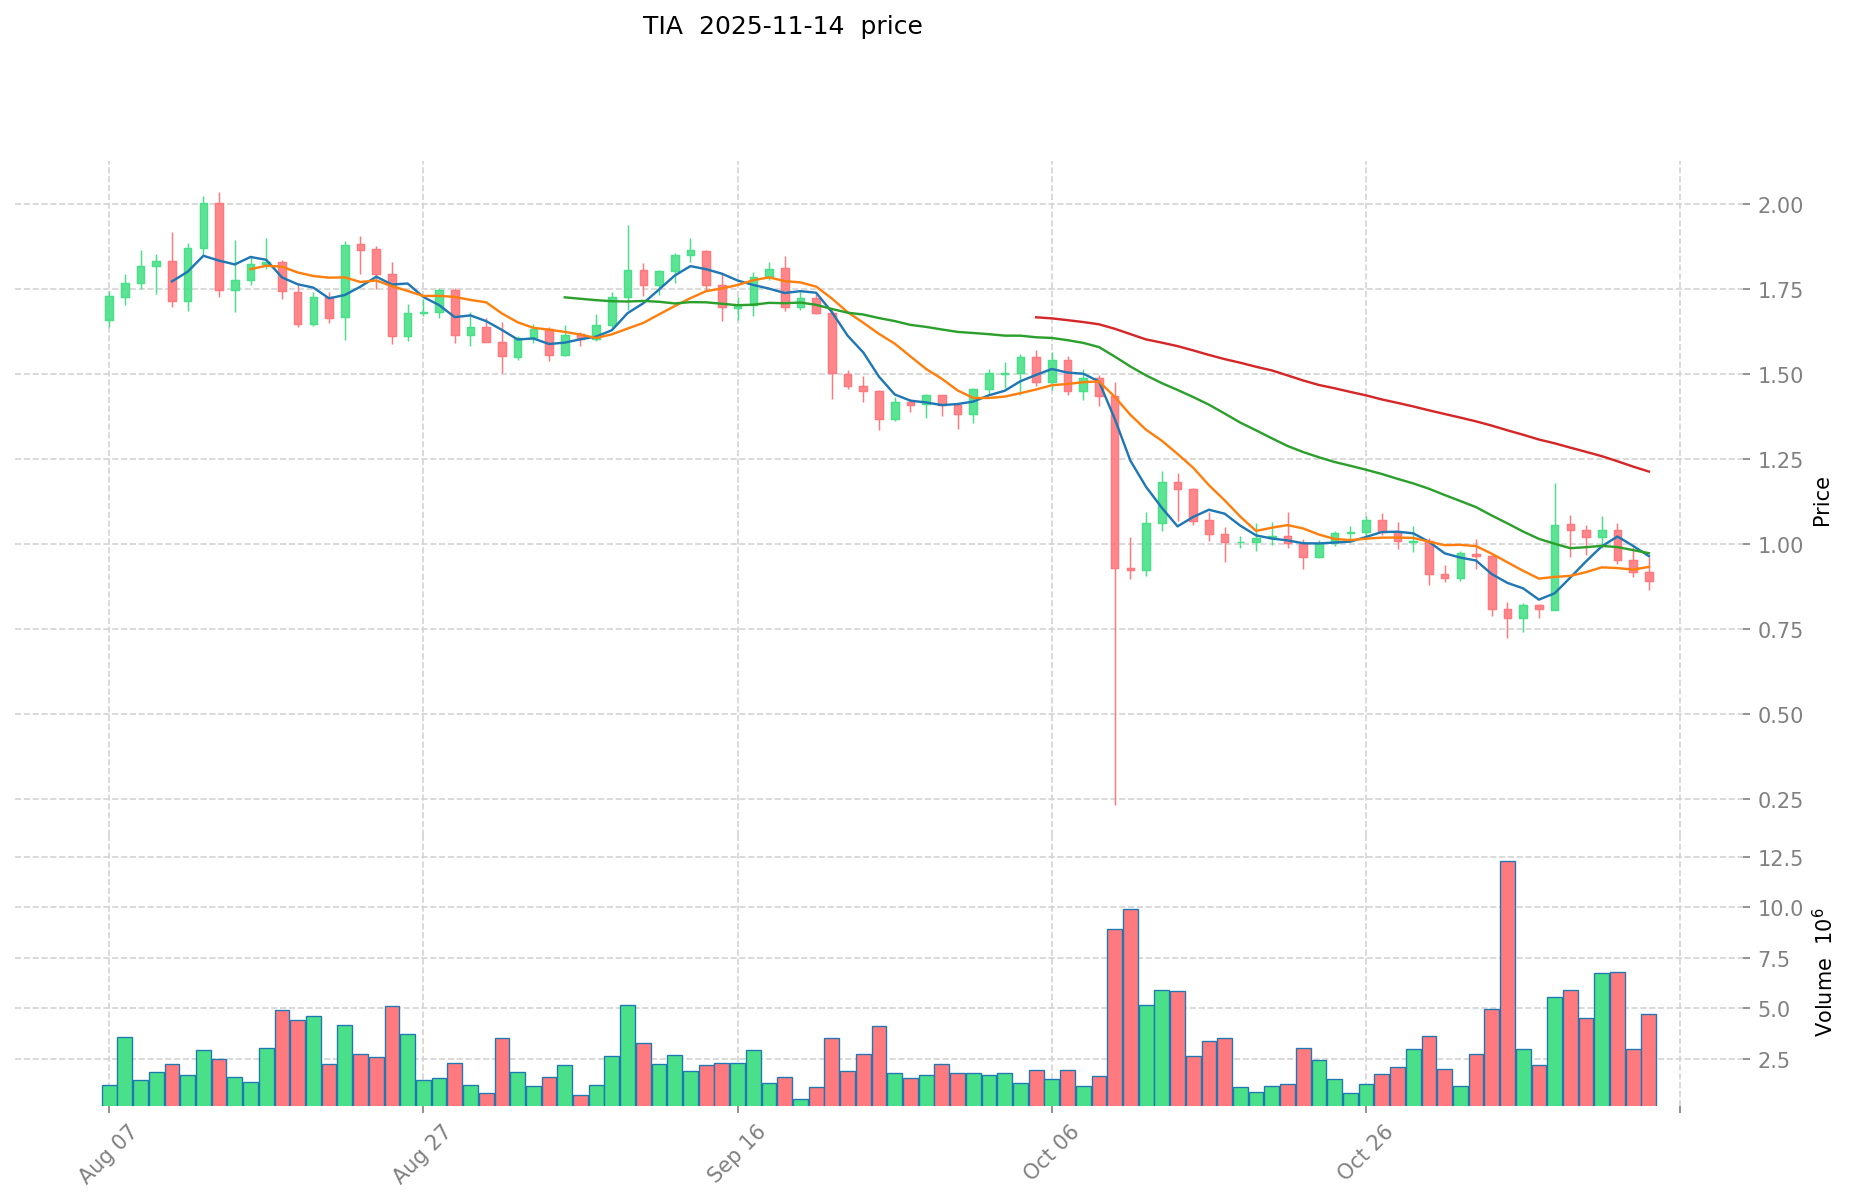
  • 2024: TIA reached its all-time high of $21.129 on February 10, marking a significant milestone for the project.
  • 2025: The market experienced a substantial correction, with TIA price declining to its all-time low of $0.2319 on October 10.

TIA Current Market Situation

As of November 15, 2025, TIA is trading at $0.882, representing a 1.31% increase in the last 24 hours. The current price is 95.83% below its all-time high and 280.34% above its all-time low. TIA's market capitalization stands at $739,463,529, ranking it 109th in the cryptocurrency market.

The trading volume in the past 24 hours has reached $3,155,647, indicating moderate market activity. TIA's circulating supply is 838,394,023.83 tokens, which is 72.78% of its total supply of 1,151,928,826.82 tokens.

Recent price trends show mixed performance across different timeframes. While TIA has seen a slight gain in the past 24 hours, it has experienced significant losses over longer periods, with a 12.62% decrease in the past week and a 17.64% decline over the last month. The most substantial drop is observed in the yearly timeframe, with an 82.47% decrease.

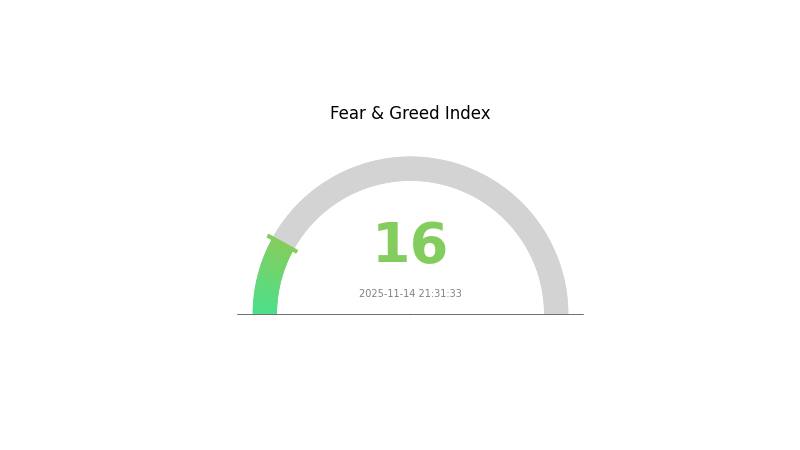
The current market sentiment for cryptocurrencies is characterized as "Extreme Fear" with a VIX index of 16, suggesting a highly cautious investor attitude in the broader crypto market.

Click to view the current TIA market price

price_image

TIA Market Sentiment Indicator

2025-11-14 Fear and Greed Index: 16 (Extreme Fear)

Click to view the current Fear & Greed Index

The crypto market is currently gripped by extreme fear, with the Fear and Greed Index plummeting to 16. This indicates a high level of pessimism among investors, potentially signaling a buying opportunity for contrarian traders. However, caution is advised as market sentiment can shift rapidly. Traders should closely monitor key indicators and news events that could impact the market. As always, it's crucial to conduct thorough research and manage risk effectively before making any investment decisions in this volatile environment. vix_image

TIA Holdings Distribution

The address holdings distribution chart for TIA reveals a relatively balanced token distribution. This data provides insights into the concentration of TIA tokens across different addresses, offering a snapshot of the token's ownership structure.

Based on the available data, TIA's distribution appears to be fairly decentralized, with no single address holding an overwhelmingly large percentage of the total supply. This suggests a reduced risk of market manipulation by any single entity. The absence of extremely large holders also indicates a more stable market structure, potentially leading to less volatile price movements.

This distribution pattern reflects positively on TIA's market characteristics, suggesting a healthy level of decentralization and on-chain structural stability. It may contribute to a more resilient market, less susceptible to sudden large-scale sell-offs or accumulations that could dramatically impact price.

Click to view the current TIA holdings distribution

address_image

Top Address Holding Qty Holding (%)

II. Key Factors Influencing TIA's Future Price

Supply Mechanism

  • Token Burning: TIA implements a token burning mechanism to reduce supply over time.
  • Historical Pattern: Previous token burns have generally led to short-term price increases.
  • Current Impact: The ongoing token burning is expected to create upward pressure on TIA's price.

Institutional and Whale Dynamics

  • Institutional Holdings: Several major crypto funds have recently increased their TIA positions.

Macroeconomic Environment

  • Inflation Hedging Properties: TIA has shown some resilience as a store of value during inflationary periods.

Technological Development and Ecosystem Building

  • Scalability Upgrade: Celestia is planning a network upgrade to improve transaction throughput.
  • Ecosystem Applications: The Celestia ecosystem is growing, with new DApps being developed on the platform.

III. TIA Price Prediction for 2025-2030

2025 Outlook

  • Conservative prediction: $0.85 - $0.90
  • Neutral prediction: $0.87 - $1.00
  • Optimistic prediction: $1.00 - $1.30 (requires positive market sentiment and project developments)

2027-2028 Outlook

  • Market stage expectation: Potential growth phase with increased adoption
  • Price range forecast:
    • 2027: $0.65 - $1.34
    • 2028: $0.70 - $1.53
  • Key catalysts: Technological advancements, partnerships, and market expansion

2030 Long-term Outlook

  • Base scenario: $1.20 - $1.80 (assuming steady growth and adoption)
  • Optimistic scenario: $1.80 - $2.30 (assuming strong market performance and project success)
  • Transformative scenario: $2.30+ (under extremely favorable market conditions and breakthrough innovations)
  • 2030-12-31: TIA $1.61 (potential year-end average price)
年份 预测最高价 预测平均价格 预测最低价 涨跌幅
2025 1.29722 0.8765 0.85021 0
2026 1.21728 1.08686 0.90209 23
2027 1.3364 1.15207 0.64516 30
2028 1.53041 1.24424 0.69677 41
2029 1.83127 1.38732 0.7769 57
2030 2.30129 1.6093 0.83683 82

IV. TIA Professional Investment Strategies and Risk Management

TIA Investment Methodology

(1) Long-term Holding Strategy

  • Suitable for: Long-term investors with high risk tolerance
  • Operation suggestions:
    • Dollar-cost averaging to accumulate TIA over time
    • Hold for at least 2-3 years to ride out market volatility
    • Store tokens in a secure non-custodial wallet

(2) Active Trading Strategy

  • Technical analysis tools:
    • Moving Averages: Use to identify trends and potential reversal points
    • RSI (Relative Strength Index): Helps determine overbought/oversold conditions
  • Key points for swing trading:
    • Set clear entry and exit points based on technical indicators
    • Use stop-loss orders to manage downside risk

TIA Risk Management Framework

(1) Asset Allocation Principles

  • Conservative investors: 1-3% of crypto portfolio
  • Aggressive investors: 5-10% of crypto portfolio
  • Professional investors: Up to 15% of crypto portfolio

(2) Risk Hedging Solutions

  • Diversification: Spread investments across multiple crypto assets
  • Stop-loss orders: Implement to limit potential losses

(3) Secure Storage Solutions

  • Hot wallet recommendation: Gate Web3 Wallet
  • Cold storage solution: Hardware wallet for long-term holdings
  • Security precautions: Enable two-factor authentication, use strong passwords

V. Potential Risks and Challenges for TIA

TIA Market Risks

  • High volatility: TIA price can experience significant fluctuations
  • Liquidity risk: Potential difficulty in selling large amounts quickly
  • Competition: Other modular blockchain projects may emerge

TIA Regulatory Risks

  • Uncertain regulatory environment: Potential for stricter regulations on crypto
  • Cross-border compliance: Varying regulations across different jurisdictions
  • Tax implications: Changing tax laws may impact TIA investments

TIA Technical Risks

  • Smart contract vulnerabilities: Potential for exploits in the protocol
  • Scalability challenges: Possible issues as network usage grows
  • Upgrade risks: Potential for bugs or issues during protocol upgrades

VI. Conclusion and Action Recommendations

TIA Investment Value Assessment

TIA presents a unique value proposition in the modular blockchain space, with potential for long-term growth. However, it faces short-term volatility and regulatory uncertainties.

TIA Investment Recommendations

✅ Beginners: Start with small positions, focus on learning and dollar-cost averaging ✅ Experienced investors: Consider a balanced approach with both long-term holdings and active trading ✅ Institutional investors: Conduct thorough due diligence and consider TIA as part of a diversified crypto portfolio

TIA Trading Participation Methods

  • Spot trading: Buy and sell TIA on Gate.com's spot market
  • Staking: Participate in TIA staking programs for potential passive income
  • DeFi integration: Explore DeFi protocols that support TIA for additional yield opportunities

Cryptocurrency investments carry extremely high risks, and this article does not constitute investment advice. Investors should make decisions carefully based on their own risk tolerance and are advised to consult professional financial advisors. Never invest more than you can afford to lose.

FAQ

Is TIA a good investment?

Yes, TIA shows strong potential. Its innovative blockchain technology and growing adoption suggest it could be a profitable long-term investment in the Web3 space.

Can TIA reach $1000?

While ambitious, TIA reaching $1000 is possible in the long term with significant adoption and market growth. However, it would require substantial increases in market cap and demand.

How high can celestia go?

Celestia could potentially reach $50-$100 in the next bull run, driven by its innovative data availability solution and growing adoption in the blockchain ecosystem.

Does Celestia, Tia have a future?

Yes, Celestia (TIA) has a promising future. As a modular blockchain network, it addresses scalability issues and offers innovative data availability solutions, positioning it well for long-term growth in the evolving Web3 ecosystem.

* The information is not intended to be and does not constitute financial advice or any other recommendation of any sort offered or endorsed by Gate.
Related Articles
2025 SUI Price Prediction: Analyzing Potential Growth and Market Trends for the Sui Network Token

2025 SUI Price Prediction: Analyzing Potential Growth and Market Trends for the Sui Network Token

This article delves into the price prediction and market analysis of the Sui (SUI) network token, a key player in Layer 1 blockchain technology. It evaluates SUI's market position, historical price trends, and future projections while offering professional investment strategies and risk management techniques. The content caters to investors looking for insights into SUI's growth potential, considering factors like technological upgrades, macroeconomic influences, and ecosystem expansion. Structured into sections, it covers current market status, future price forecasts, investment methodologies, and potential risks, providing a comprehensive guide for both beginners and experienced investors.
2025-10-15 03:09:37
Is Layer3 (L3) a Good Investment?: Analyzing the Potential Returns and Risks of the Emerging Blockchain Protocol

Is Layer3 (L3) a Good Investment?: Analyzing the Potential Returns and Risks of the Emerging Blockchain Protocol

The article explores whether Layer3 (L3) is a solid investment by analyzing its market status, historical price trends, technological features, and future outlook. It examines L3's investment value, including token economics and market performance, to determine potential returns and risks for investors. Key sections address price history, project development, and investment strategies, discussing both opportunities and challenges such as high volatility and regulatory uncertainties. Ideal for cryptocurrency investors seeking insights into L3's potential, it concludes with a balanced view of its long-term investment viability and offers practical advice for managing investment risks.
2025-10-03 12:24:31
2025 ELF Price Prediction: Analyzing Market Trends and Potential Growth Factors for aelf

2025 ELF Price Prediction: Analyzing Market Trends and Potential Growth Factors for aelf

The article "2025 ELF Price Prediction: Analyzing Market Trends and Potential Growth Factors for aelf" offers an in-depth examination of aelf's price trends and investment strategies through 2030. It highlights ELF's market position, historical price movements, current status, and future projections, emphasizing factors like technical upgrades and adoption trends influencing its price. Aimed at investors of all levels, the article addresses concerns such as market sentiment, regulatory, and technical risks. With strategic investment methodologies and risk management tips, it serves as a guide for investing in ELF via Gate.
2025-10-20 02:15:15
Is Astar Token (ASTR) a good investment?: Analyzing the potential and risks of this Polkadot parachain project

Is Astar Token (ASTR) a good investment?: Analyzing the potential and risks of this Polkadot parachain project

This article evaluates whether Astar Token (ASTR) is a viable investment by analyzing its market position, historical price trends, and core features within the Polkadot parachain project. It addresses potential risks such as market volatility, competitive landscape, and Web3 adoption hurdles. Structured into sections detailing ASTR's price history, ecosystem development, economic model, and risk factors, the article outlines investment strategies and forecasts for various timeframes. Suitable for crypto investors seeking insights into ASTR's long-term growth potential and strategic opportunities, highlighting key factors like interoperability and strategic partnerships.
2025-11-16 10:22:47
Is Kaia (KAIA) a good investment?: Analyzing the Potential and Risks of This Emerging Cryptocurrency

Is Kaia (KAIA) a good investment?: Analyzing the Potential and Risks of This Emerging Cryptocurrency

The article provides a detailed analysis of Kaia (KAIA) as a potential investment, focusing on its market performance, technological strengths, ecosystem dynamics, and long-term prospects. It addresses the investment community’s need for insights into KAIA’s price history, technological advancements, and risk factors, making it suitable for both novice and experienced investors. Structurally, the article begins with an overview of KAIA's market status, followed by a project review, ecosystem applications, token economics, and investment risks. It concludes with expert forecasts and investment strategies, ensuring high keyword density for phrases like "KAIA investment" and "market performance" to enhance readability and search visibility.
2025-11-15 03:23:46
Is Near (NEAR) a good investment?: Analyzing the potential of this blockchain platform in the crypto market

Is Near (NEAR) a good investment?: Analyzing the potential of this blockchain platform in the crypto market

The article explores NEAR Protocol's investment potential, focusing on historical price performance, technical analysis, and future trends. It assesses NEAR's unique features like sharding technology, user-friendly systems, and ecosystem developments, while discussing investment risks and opportunities in the Layer 1 blockchain space. Targeting investors keen on blockchain platforms, the article offers insights on price dynamics, competitive analysis, and strategic investment strategies. With a comprehensive review of NEAR's fundamentals, readers gain a concise understanding of its market positioning and investment outlook.
2025-11-14 13:22:44
Recommended for You
How do exchange inflows and outflows affect Dogecoin DOGE price movements in 2026

How do exchange inflows and outflows affect Dogecoin DOGE price movements in 2026

This article examines how exchange inflows and outflows drive Dogecoin price volatility in 2026 through multiple mechanisms. It analyzes the critical relationship between capital flows and DOGE price movements, highlighting how positive net inflows create buying pressure that amplifies volatility. The piece explores institutional whale accumulation strategies, with major exchange holdings at Gate controlling capital velocity and reducing circulating supply. It addresses derivatives market risks, noting that $143 billion in open interest concentration creates potential correction vulnerabilities. The article also examines long-term staking mechanisms that remove tokens from liquid circulation, fundamentally altering supply dynamics. Understanding these interconnected factors—exchange flows, institutional positioning, leverage concentration, and staking behavior—provides essential insights for comprehending DOGE's 2026 price trajectory and market structure evolution.
2026-01-09 10:29:11
What are on-chain data metrics revealing about SHIB whale movements and active address distribution in 2026?

What are on-chain data metrics revealing about SHIB whale movements and active address distribution in 2026?

This comprehensive analysis explores critical on-chain data metrics revealing SHIB whale movements and network activity across Ethereum and Shibarium in 2026. The article examines how major token holders control over 62% of circulating supply, with whale transaction volumes surging 111% week-on-week, driving a 32% price increase and 131% trading volume spike to $321.9 million. Beyond price action, the network demonstrates robust fundamentals: 272 million active addresses and 1.57 billion total transactions signal strong ecosystem adoption. Additionally, Shibarium's deflationary fee mechanism automatically burns SHIB through transactions, with January 1st witnessing a 10,731% burn spike. This content equips investors with essential insights into distinguishing genuine network health signals from price volatility, using on-chain indicators like whale transactions and active address growth as predictive tools for identifying market sentiment shifts through Gate and blockchain analytics.
2026-01-09 10:26:19
How do active addresses, transaction volume, and whale movements reveal on-chain data insights for crypto markets in 2026?

How do active addresses, transaction volume, and whale movements reveal on-chain data insights for crypto markets in 2026?

This comprehensive guide reveals how on-chain metrics—active addresses, transaction volume, and whale movements—unlock critical crypto market insights for 2026. Cardano's surge to 30,000+ daily active addresses demonstrates accelerating network adoption beyond price speculation. Transaction dynamics of 92,000 daily transactions illustrate that volume alone doesn't guarantee bullish conditions; instead, whale accumulation patterns during strategic dips signal institutional conviction and potential recovery phases. Rising on-chain fees, TVL growth to $423.5 million, and staking participation confirm ecosystem maturity. By monitoring these metrics through platforms like Gate, Glassnode, and CryptoQuant, traders can identify market inflection points and position ahead of price movements. On-chain data provides leading indicators for distinguishing genuine adoption from market manipulation, essential for navigating 2026's volatile landscape.
2026-01-09 10:23:43
What are the major security risks and vulnerabilities in Cardano (ADA) smart contracts and network attacks?

What are the major security risks and vulnerabilities in Cardano (ADA) smart contracts and network attacks?

This article provides a comprehensive analysis of Cardano's critical security vulnerabilities spanning three key areas. It examines deserialization flaws in smart contract validation that triggered a November 2025 chain split, revealing gaps in formal verification claims. The article details significant network security incidents where 479,111 active addresses were compromised through coordinated hacking and social engineering attacks within a single month. Additionally, it explores systemic risks from Cardano's centralized infrastructure dependencies, including exchange custody concentration, stablecoin liquidity constraints limited to Wanchain bridge access, and dramatic DeFi TVL collapse from $693 million to $182 million. The analysis demonstrates how interconnected vulnerabilities—combined with ADA's 70% price decline—create ecosystem fragility where single institutional failures could trigger cascading collapses. Designed for investors, developers, and risk managers, this resource identifies practical se
2026-01-09 10:21:36
Who Is Adrian Portelli and How Did He Get Rich

Who Is Adrian Portelli and How Did He Get Rich

Search interest around Adrian Portelli has grown sharply in the UK as global audiences follow high profile entrepreneurs who blend real estate, media exposure, and aggressive wealth building strategies. Known widely as Mr Lambo, Adrian Portelli is an Australian billionaire entrepreneur and property investor whose lifestyle, business ventures, and legal battles frequently dominate headlines. From record breaking purchases on The Block to the rise of LMCT+, Portelli represents a modern form of celebrity entrepreneurship where branding, risk taking, and scale drive wealth accumulation. For investors, his story offers insight into leverage, cash flow businesses, and the fine balance between innovation and regulation.
2026-01-09 10:21:30
What Is Cryptocurrency Competitive Benchmarking and How Does It Impact Market Share in 2026?

What Is Cryptocurrency Competitive Benchmarking and How Does It Impact Market Share in 2026?

Cryptocurrency competitive benchmarking evaluates market positioning through key metrics including market capitalization, transaction volume, network activity, and developer engagement. In 2026, Bitcoin, Ethereum, and BNB command approximately 65% combined market share, demonstrating investor confidence in established protocols. This article explores how Layer-2 solutions and DeFi integration serve as critical competitive differentiators, enabling platforms to reduce transaction costs and enhance user experiences. As institutional capital accelerates crypto adoption through regulated channels like Gate, altcoins gain significant ground alongside dominant players. The analysis examines how institutional-grade infrastructure and technological differentiation reshape market dynamics, with Bitcoin evolving from market hegemon to portfolio anchor. Understanding these competitive benchmarking mechanisms is essential for investors, enterprises, and traders seeking to identify high-potential projects and optimize inv
2026-01-09 10:17:39