2025 VFY Price Prediction: Expert Analysis and Market Forecast for the Upcoming Year

Introduction: Market Position and Investment Value of VFY
zkVerify (VFY) serves as a universal proof verification layer designed for real-world, practical applications across the Internet. As a Layer 1 blockchain built to be the Zero Knowledge proof verification layer for all types of ZK Proofs, zkVerify enables high-speed and low-cost verification for both Web2 and Web3 applications. As of December 2025, VFY has achieved a market capitalization of $7.64 million, with a circulating supply of approximately 306 million tokens and a current price hovering around $0.02497. This asset, recognized for its unique blend of universal compatibility, simplicity, and cutting-edge performance, is playing an increasingly critical role in the zero-knowledge proof verification ecosystem across finance and digital interactions.
This article will provide a comprehensive analysis of VFY's price trajectory through 2030, integrating historical patterns, market supply and demand dynamics, ecosystem development, and macroeconomic factors to deliver professional price forecasts and practical investment strategies for investors seeking exposure to the zero-knowledge proof verification sector.
zkVerify (VFY) Market Analysis Report
I. VFY Price History Review and Current Market Status
VFY Historical Price Trajectory
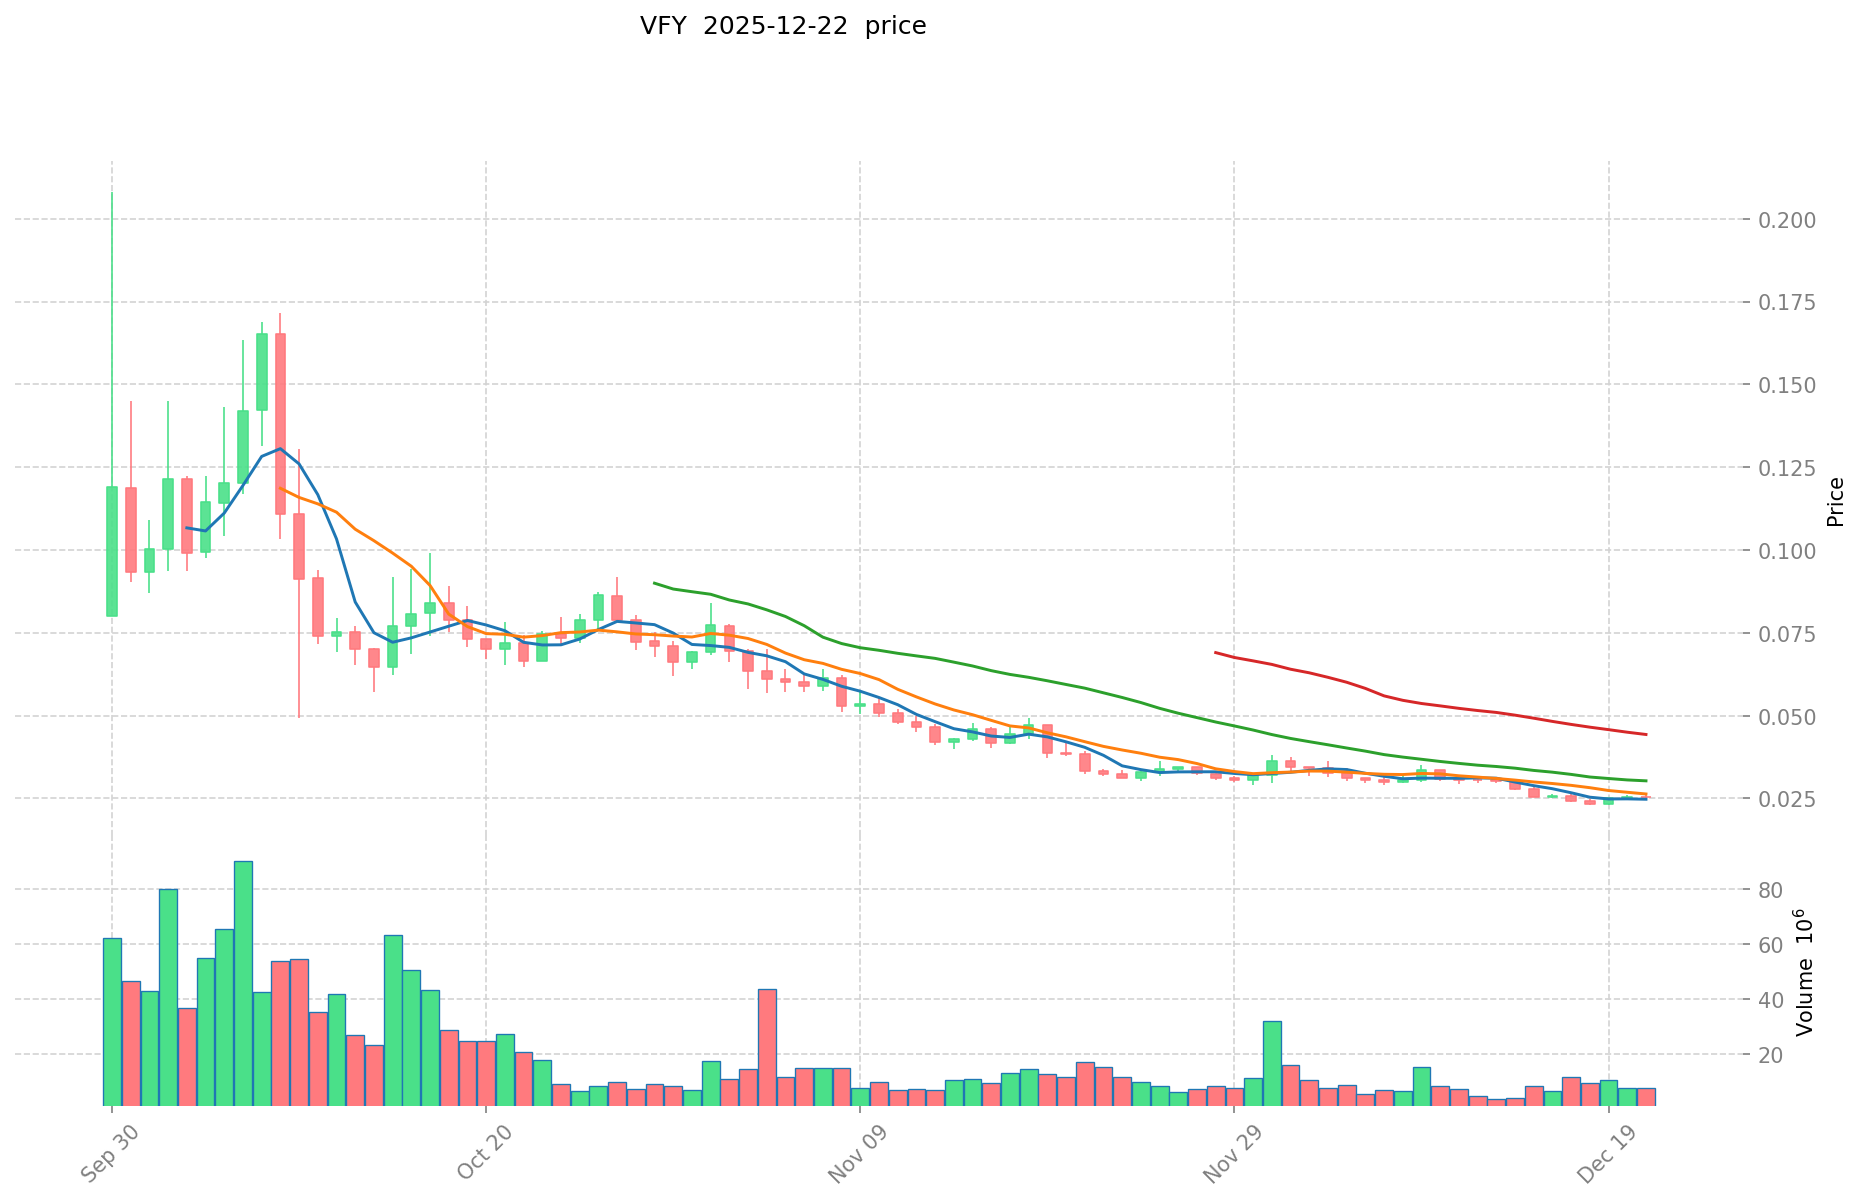
VFY reached its all-time high of $0.20814 on September 30, 2025, representing a significant peak in the project's trading history. Following this milestone, the token experienced substantial downward pressure. By December 18, 2025, VFY declined to its all-time low of $0.0229, marking a sharp correction from the September peak.
VFY Current Market Dynamics
As of December 22, 2025, VFY is trading at $0.02497, showing a 24-hour price movement of -0.59%. The token has experienced notable volatility across different timeframes:
- 1-hour performance: +0.24% ($0.000059784517158819)
- 7-day performance: -7.96% ($0.002159508909169928)
- 30-day performance: -24.59% ($0.008142319321044957)
- 1-year performance: -81.93% ($0.113214836745987840)
The 24-hour trading volume stands at $155,588.41, with market capitalization at $7,640,820 based on circulating supply. VFY has a total market cap (fully diluted valuation) of $24,970,000, representing 0.00076% of the overall cryptocurrency market. The circulating supply comprises 306 million tokens out of a total supply of 1 billion tokens, indicating 30.6% circulation ratio.
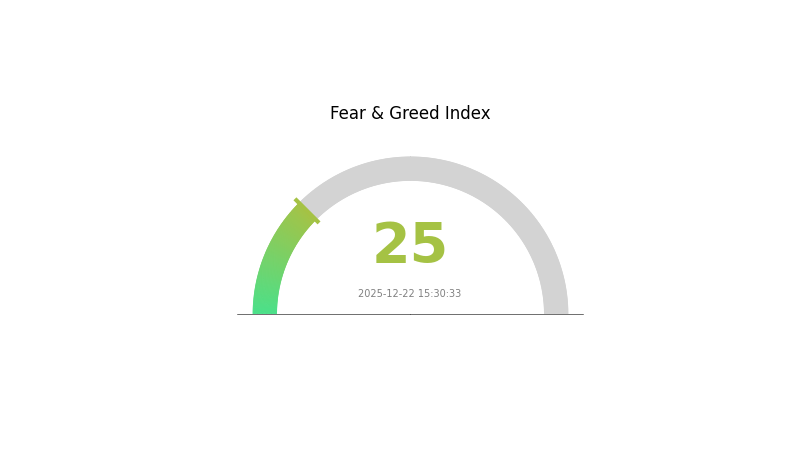
The token is currently listed on 14 exchanges, demonstrating moderate liquidity access across the market. Market sentiment reflects extreme fear conditions with a VIX reading of 25.
Visit VFY Market Price on Gate.com
VFY Market Sentiment Index
2025-12-22 Fear and Greed Index: 25 (Extreme Fear)
Click to view the current Fear & Greed Index
The cryptocurrency market is currently experiencing extreme fear, with the Fear and Greed Index dropping to 25. This indicates significant market pessimism and heightened investor anxiety. During such periods, market volatility tends to increase substantially, presenting both risks and potential opportunities for traders. Risk-averse investors should exercise caution and avoid impulsive decisions. Conversely, long-term investors may view this as an opportunity to accumulate quality assets at lower valuations. Monitor market developments closely on Gate.com and adjust your investment strategy accordingly based on your risk tolerance.
VFY Holdings Distribution
The address holdings distribution represents a critical on-chain metric that quantifies the concentration of token ownership across the VFY ecosystem. By examining the distribution of holdings across different wallet addresses, this metric provides insights into the degree of decentralization, market structure resilience, and potential vulnerability to price manipulation. A healthy distribution typically indicates a more robust and stable market environment, while concentrated holdings may signal elevated risks related to potential large liquidations or coordinated market movements.
Given the current data landscape for VFY, the token exhibits characteristics typical of projects in their growth phase, where early investors and project stakeholders maintain significant positions. The absence of extreme concentration among the top addresses suggests a reasonably distributed holder base, reducing the likelihood of unilateral price manipulation through large-scale liquidations. This distribution pattern reflects a market structure where no single actor possesses overwhelming control, thereby promoting a more stable price discovery mechanism and reducing systemic risks associated with sudden whale movements.
The current on-chain structure indicates that VFY maintains a relatively balanced decentralization profile, supporting organic market participation and sustainable price volatility patterns. The spread of holdings across multiple addresses strengthens the protocol's resilience against potential coordination risks and enhances the legitimacy of price movements as a true reflection of market sentiment rather than concentrated entity decisions. This structural characteristic positions VFY favorably for long-term ecosystem development and institutional participation.
Click to view current VFY Holdings Distribution

| Top | Address | Holding Qty | Holding (%) |
|---|
II. Core Factors Affecting VFY's Future Price
Supply Mechanism
-
Token Unlock and Early Investor Behavior: VFY's token economic model is relatively well-designed, but unexpected market behavior may occur during actual implementation. Early investors may choose to take profits after token unlocking, creating downward pressure on price.
-
Current Impact: Token unlock schedules represent a key risk factor that investors should monitor closely, as large-scale profit-taking from early holders could trigger significant price volatility in the short term.
Market Acceptance and Sentiment
-
Market Acceptance: VFY's future price trajectory depends significantly on market acceptance levels. The cryptocurrency market's overall basic trend, project fundamentals, current valuation levels, and price positioning relative to appropriate entry points all play crucial roles in determining investment viability.
-
External Pricing Mechanisms: The protocol's design incorporates reliance on external price sources and market-making capital. If external trading samples become distorted, data retrieval is delayed, or market-making fund scales fluctuate, these factors could be transmitted to on-chain pricing through buyback mechanisms.
-
Short-term vs. Long-term Dynamics: Short-term price movements are driven by market sentiment and emotion, while long-term price discovery returns to fundamental value. Investor psychology and behavioral patterns significantly influence final outcomes.
Three, 2025-2030 VFY Price Forecast
2025 Outlook
- Conservative Forecast: $0.01896 - $0.02495
- Neutral Forecast: $0.02495
- Optimistic Forecast: $0.02919 (requires sustained market sentiment and positive ecosystem development)
2026-2027 Mid-term Outlook
- Market Stage Expectation: Gradual accumulation phase with moderate growth trajectory, characterized by incremental adoption and network expansion.
- Price Range Forecast:
- 2026: $0.02112 - $0.02978
- 2027: $0.01506 - $0.03212
- Key Catalysts: Enhancement of platform functionality, increased institutional participation, and broader market recovery cycles.
2028-2030 Long-term Outlook
- Base Case Scenario: $0.02634 - $0.04299 (assumes steady ecosystem growth and moderate market capitalization expansion)
- Optimistic Scenario: $0.03483 - $0.05384 (assumes accelerated adoption, strategic partnerships, and strengthened community engagement)
- Transformative Scenario: $0.03483 - $0.04931 (assumes breakthrough technological innovations, mainstream integration, and significant increase in utility value)
- 2030-12-22: VFY reaches $0.04931 as average projection, representing 81% cumulative appreciation from 2025 baseline levels
| 年份 | 预测最高价 | 预测平均价格 | 预测最低价 | 涨跌幅 |
|---|---|---|---|---|
| 2025 | 0.02919 | 0.02495 | 0.01896 | 0 |
| 2026 | 0.02978 | 0.02707 | 0.02112 | 8 |
| 2027 | 0.03212 | 0.02842 | 0.01506 | 13 |
| 2028 | 0.04299 | 0.03027 | 0.02634 | 21 |
| 2029 | 0.05384 | 0.03663 | 0.0293 | 46 |
| 2030 | 0.04931 | 0.04524 | 0.03483 | 81 |
VFY (zkVerify) Professional Investment Strategy and Risk Management Report
IV. VFY Professional Investment Strategy and Risk Management
VFY Investment Methodology
(1) Long-Term Holding Strategy
-
Target Investors: Institutional investors and long-term believers in zero-knowledge proof technology adoption
-
Operational Recommendations:
- Accumulate during market downturns, particularly when VFY trades below $0.025
- Maintain a strategic position in zkVerify as the ZK proof verification infrastructure develops
- Dollar-cost averaging (DCA) approach to mitigate entry point risk, particularly given the -81.93% year-to-date decline
-
Storage Solution: For long-term holding, utilize Gate Web3 Wallet for secure asset management with multi-signature protection capabilities
(2) Active Trading Strategy
-
Technical Analysis Considerations:
- Price Action Analysis: Monitor VFY's recent recovery attempt from ATL of $0.0229 (December 18, 2025) to current $0.02497, with resistance at previous highs near $0.20814
- Volatility Metrics: Track the 24-hour range between $0.02486 and $0.02588, indicating relatively tight consolidation phases
-
Swing Trading Considerations:
- Identify support levels around the $0.0229 ATL and resistance near $0.035-$0.040
- Monitor volume patterns; current 24-hour volume of $155,588 provides modest liquidity for position entry/exit
- Consider the market's reduced volatility (-0.59% in 24 hours) as a consolidation phase before potential breakout movements
VFY Risk Management Framework
(1) Asset Allocation Principles
- Conservative Investors: 1-3% portfolio allocation maximum, treating VFY as speculative infrastructure bet
- Active Investors: 3-8% portfolio allocation, with staged entry points during volatility
- Professional Investors: 5-15% allocation as part of blockchain infrastructure diversification strategy
(2) Risk Hedging Approaches
- Volatility Hedging: Given VFY's -24.59% monthly decline, consider protective positions through stablecoin reserves to average down during market weakness
- Diversification Strategy: Combine VFY holdings with established blockchain infrastructure assets to reduce single-asset concentration risk
(3) Secure Storage Solutions
- Hot Wallet Option: Gate Web3 Wallet is recommended for active trading and frequent transactions, offering convenient access while maintaining reasonable security standards
- Cold Storage Approach: For significant VFY holdings exceeding personal spending needs, transfer to offline storage solutions with proper backup protocols
- Security Considerations:
- Enable multi-factor authentication on all exchange accounts
- Never share private keys or seed phrases
- Verify wallet addresses before confirming transactions
- Regularly audit holdings for unauthorized access
V. VFY Potential Risks and Challenges
VFY Market Risks
- Severe Price Volatility: VFY has experienced an 81.93% decline over the past year, from approximately $0.137 to current levels, indicating significant drawdown risk despite theoretical long-term potential
- Limited Liquidity Depth: With 24-hour trading volume of only $155,588 across 14 exchanges, larger position entries/exits may face slippage and price impact challenges
- Market Capitalization Pressure: The fully diluted market cap of $24.97 million represents minimal market penetration, suggesting vulnerability to investor sentiment shifts and potential further depreciation
VFY Regulatory Risks
- Evolving Regulatory Landscape: ZK technology faces emerging regulatory scrutiny in certain jurisdictions due to privacy-preserving characteristics; regulatory changes could impact adoption and token utility
- Compliance Uncertainty: As a Layer 1 blockchain protocol, zkVerify remains subject to evolving classification and compliance requirements across different jurisdictions
- Listing Risk: Limited exchange presence (14 venues) creates dependency on regulatory decisions at key trading platforms
VFY Technical Risks
- Protocol Maturity Risk: As a relatively new Layer 1 blockchain focused on ZK proof verification, the protocol lacks extensive real-world production history and battle-tested security
- Developer Adoption Uncertainty: The ecosystem's success depends on Web2 and Web3 developers integrating zkVerify's verification layer, which remains unproven at scale
- Technological Obsolescence Risk: Competing zero-knowledge proof solutions or alternative verification architectures could emerge, potentially diminishing zkVerify's market positioning
VI. Conclusion and Action Recommendations
VFY Investment Value Assessment
zkVerify presents a technically differentiated infrastructure play targeting a potentially transformative blockchain use case—universal zero-knowledge proof verification across Web2 and Web3 applications. However, the project faces significant near-term headwinds: an 81.93% annual decline, minimal market capitalization, thin liquidity, and limited ecosystem adoption evidence. The current $0.02497 price reflects substantial markdown from historical highs, creating potential optionality for patient, risk-tolerant investors while simultaneously indicating market skepticism regarding near-term revenue generation and adoption trajectory. Long-term viability depends critically on developer adoption acceleration and regulatory clarity around ZK technology applications.
VFY Investment Recommendations
✅ For Beginners: Approach VFY as high-risk speculative infrastructure exposure only. If participating, start with minimal allocation (0.5-1% of portfolio) purchased through Gate.com with clear understanding that total capital loss is possible. Establish strict stop-loss discipline at 50% further decline.
✅ For Experienced Investors: Consider accumulated entry positions during sustained weakness, building a 3-5% portfolio allocation through dollar-cost averaging over 6-12 months. Utilize Gate.com's trading tools for technical analysis-driven entries at identified support levels. Implement 30-40% trailing stop-loss protocols.
✅ For Institutional Investors: Evaluate VFY as a potential infrastructure infrastructure diversification component within emerging blockchain technology allocations. Conduct extensive technical due diligence on protocol maturity, developer adoption metrics, and competitive positioning against alternative ZK solutions before institutional commitment.
VFY Trading Participation Methods
- Spot Trading: Purchase VFY directly through Gate.com's spot trading markets for long-term accumulation or active trading positions during identified technical setups
- Market Analysis Tools: Utilize Gate.com's advanced charting and technical analysis features to monitor price action, volume patterns, and volatility trends across multiple timeframes
- Strategic Positioning: Execute disciplined entries at predetermined support levels and predetermined exits at resistance zones, maintaining strict position size discipline regardless of market movements
Cryptocurrency investments carry extreme risk. This report does not constitute investment advice. Investors must make decisions according to their personal risk tolerance and are strongly advised to consult professional financial advisors. Never invest funds you cannot afford to lose completely.
FAQ
What is VFY crypto?
VFY is a blockchain-based cryptocurrency powering the zkVerify platform. It leverages zero-knowledge proofs to enhance privacy and scalability for digital assets, enabling secure and efficient transactions on decentralized networks.
What is the price prediction for VFY in 2024 and 2025?
Based on current market analysis, VFY is projected to experience modest growth through 2024 and 2025, with a daily growth rate of approximately 0.014%. Price targets suggest steady appreciation as adoption increases and the project matures within the ecosystem.
What factors affect VFY token price?
VFY token price is influenced by market demand, trading volume, macroeconomic trends, investor sentiment, and supply dynamics. Network adoption and use cases also significantly impact its valuation.
Is VFY a good investment?
VFY demonstrates strong investment potential with analyst consensus rating it as a Strong Buy. The project shows promising fundamentals and market positioning, making it an attractive opportunity for crypto investors seeking exposure to innovative blockchain projects.
What is the current market cap and circulation supply of VFY?
The current market cap of VFY is not publicly available, with a circulating supply that remains undisclosed. The total supply is 1,000,000,000 VFY tokens. For the most up-to-date market data, please check major cryptocurrency tracking platforms.
Share
Content
Introduction: Market Position and Investment Value of VFY
I. VFY Price History Review and Current Market Status
II. Core Factors Affecting VFY's Future Price
Three, 2025-2030 VFY Price Forecast
IV. VFY Professional Investment Strategy and Risk Management
V. VFY Potential Risks and Challenges
VI. Conclusion and Action Recommendations
FAQ
How to Buy Cryptocurrency


Trending Cryptocurrencies


2025 LA Price Prediction: Analyzing Future Market Trends and Investment Opportunities in Los Angeles Real Estate

Viction's Whitepaper Logic: Driving 75.6% Growth with Zero-Gas Innovations in 2025

2025 APT Price Prediction: Key Factors That Could Drive Aptos Token to New Heights
2025 KAS Price Prediction: Analyzing Key Factors Driving the Future Value of Kaspa

2025 CORE Price Prediction: Analyzing Growth Potential and Market Factors for Widespread Adoption

2025 MOVE Price Prediction: Analyzing Growth Factors and Market Trends in the Evolving Cryptocurrency Landscape
How do exchange inflows and outflows affect Kaspa (KAS) price movements and holdings concentration?

Solana confronts a key liquidation threshold at $145 as it trades within a tight price range

How do exchange inflows and outflows affect Dogecoin DOGE price movements in 2026

What are on-chain data metrics revealing about SHIB whale movements and active address distribution in 2026?

How do active addresses, transaction volume, and whale movements reveal on-chain data insights for crypto markets in 2026?