GCOIN vs GRT: Analyzing the Key Differences Between Two Prominent Blockchain Projects
Introduction: GCOIN vs GRT Investment Comparison
In the cryptocurrency market, the comparison between Galaxy Fight Club (GCOIN) vs The Graph (GRT) has been an unavoidable topic for investors. The two not only show significant differences in market cap ranking, application scenarios, and price performance but also represent different positioning in crypto assets.
Galaxy Fight Club (GCOIN): Since its launch, it has gained market recognition for its cross-IP PvP play-to-earn game project.
The Graph (GRT): Launched in 2020, it has been hailed as a decentralized protocol for indexing and querying blockchain data, and is one of the cryptocurrencies with high global trading volume and market capitalization.
This article will provide a comprehensive analysis of the investment value comparison between GCOIN and GRT, focusing on historical price trends, supply mechanisms, institutional adoption, technological ecosystems, and future predictions, attempting to answer the question investors care about most:
"Which is the better buy right now?"
I. Price History Comparison and Current Market Status
GCOIN (Galaxy Fight Club) and GRT (The Graph) Historical Price Trends
- 2021: GRT reached its all-time high of $2.84 in February due to strong market enthusiasm for blockchain indexing solutions.
- 2022: GCOIN experienced significant price volatility, dropping from its all-time high of $2.16 to under $0.01 by the end of the year.
- Comparative analysis: During the recent bear market cycle, GCOIN fell from $2.16 to a low of $0.00107154, while GRT declined from $2.84 to $0.04626017, showing both tokens were heavily impacted by market conditions.
Current Market Situation (2025-11-02)
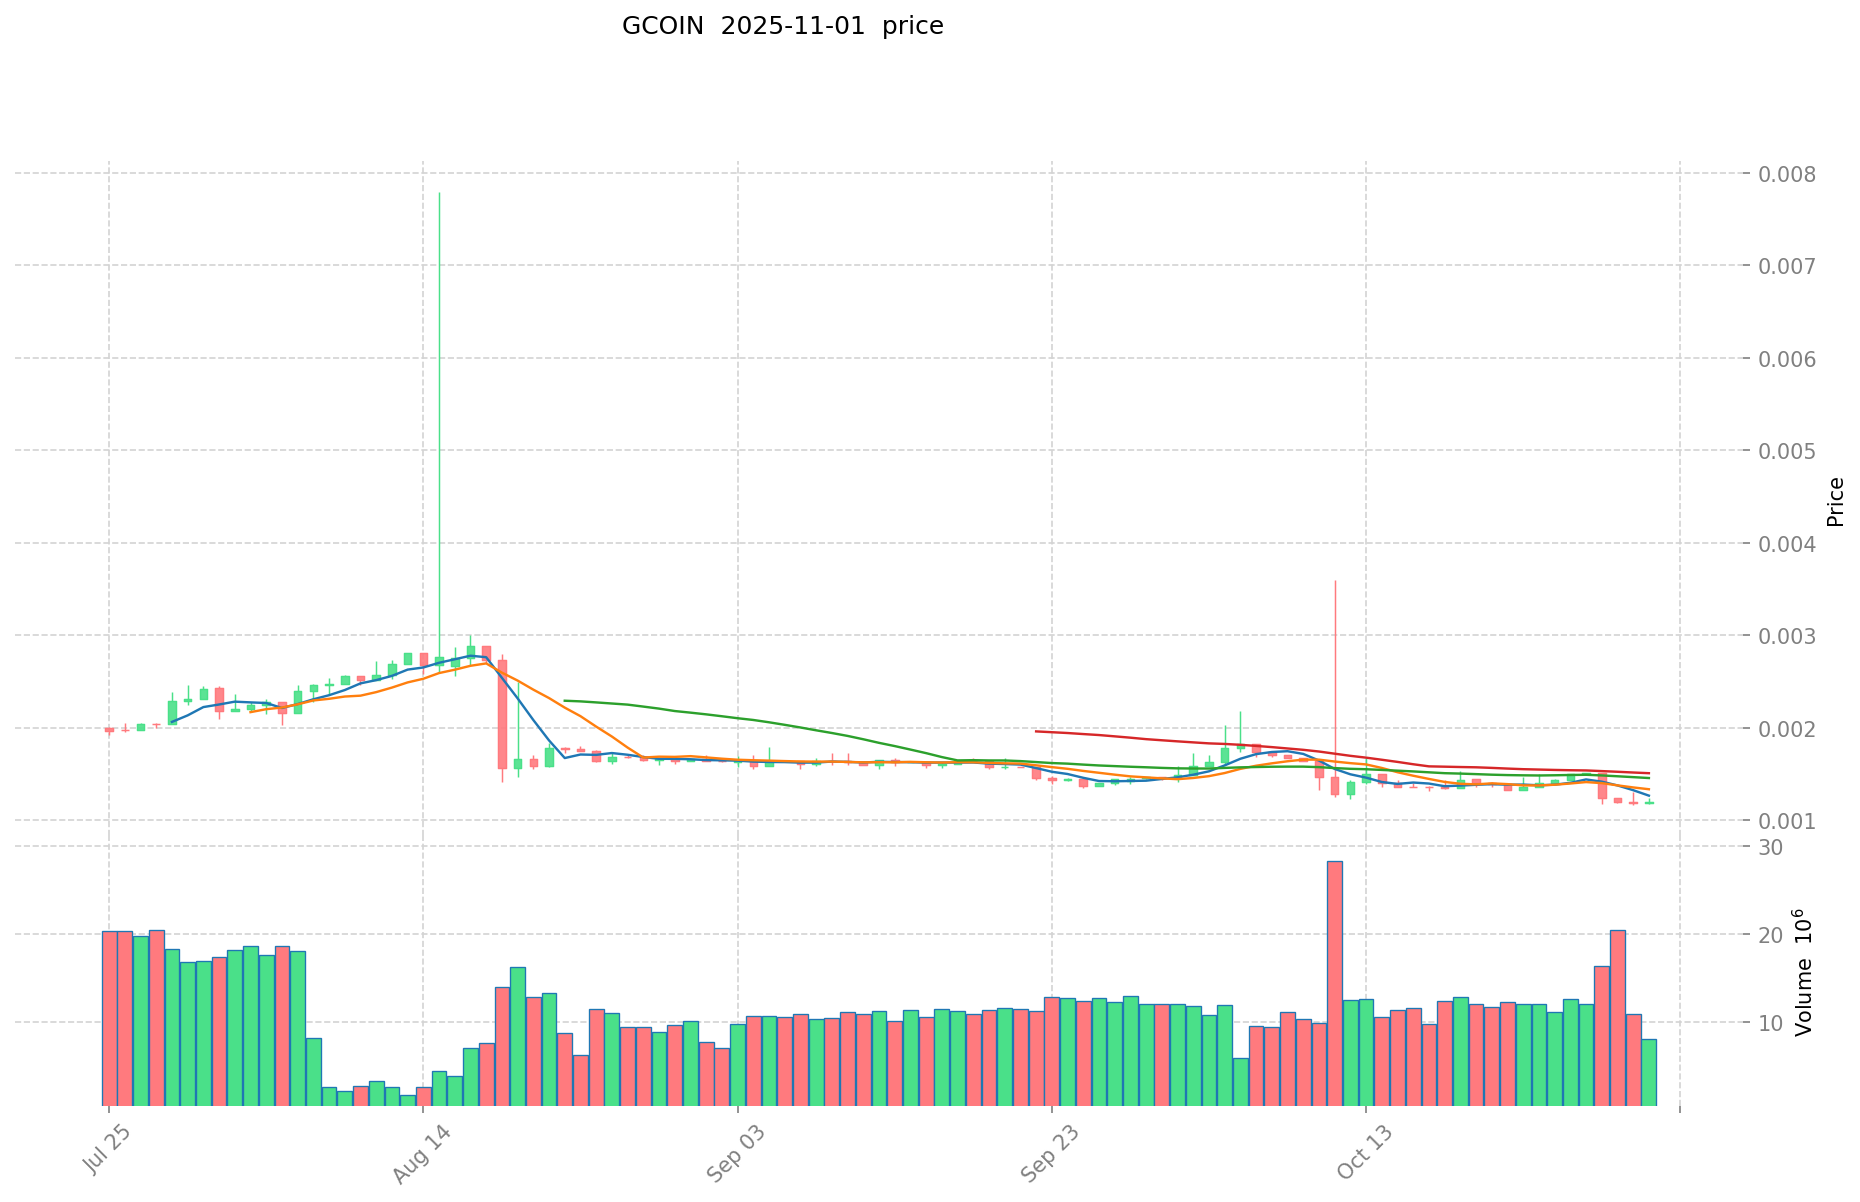
- GCOIN current price: $0.001204
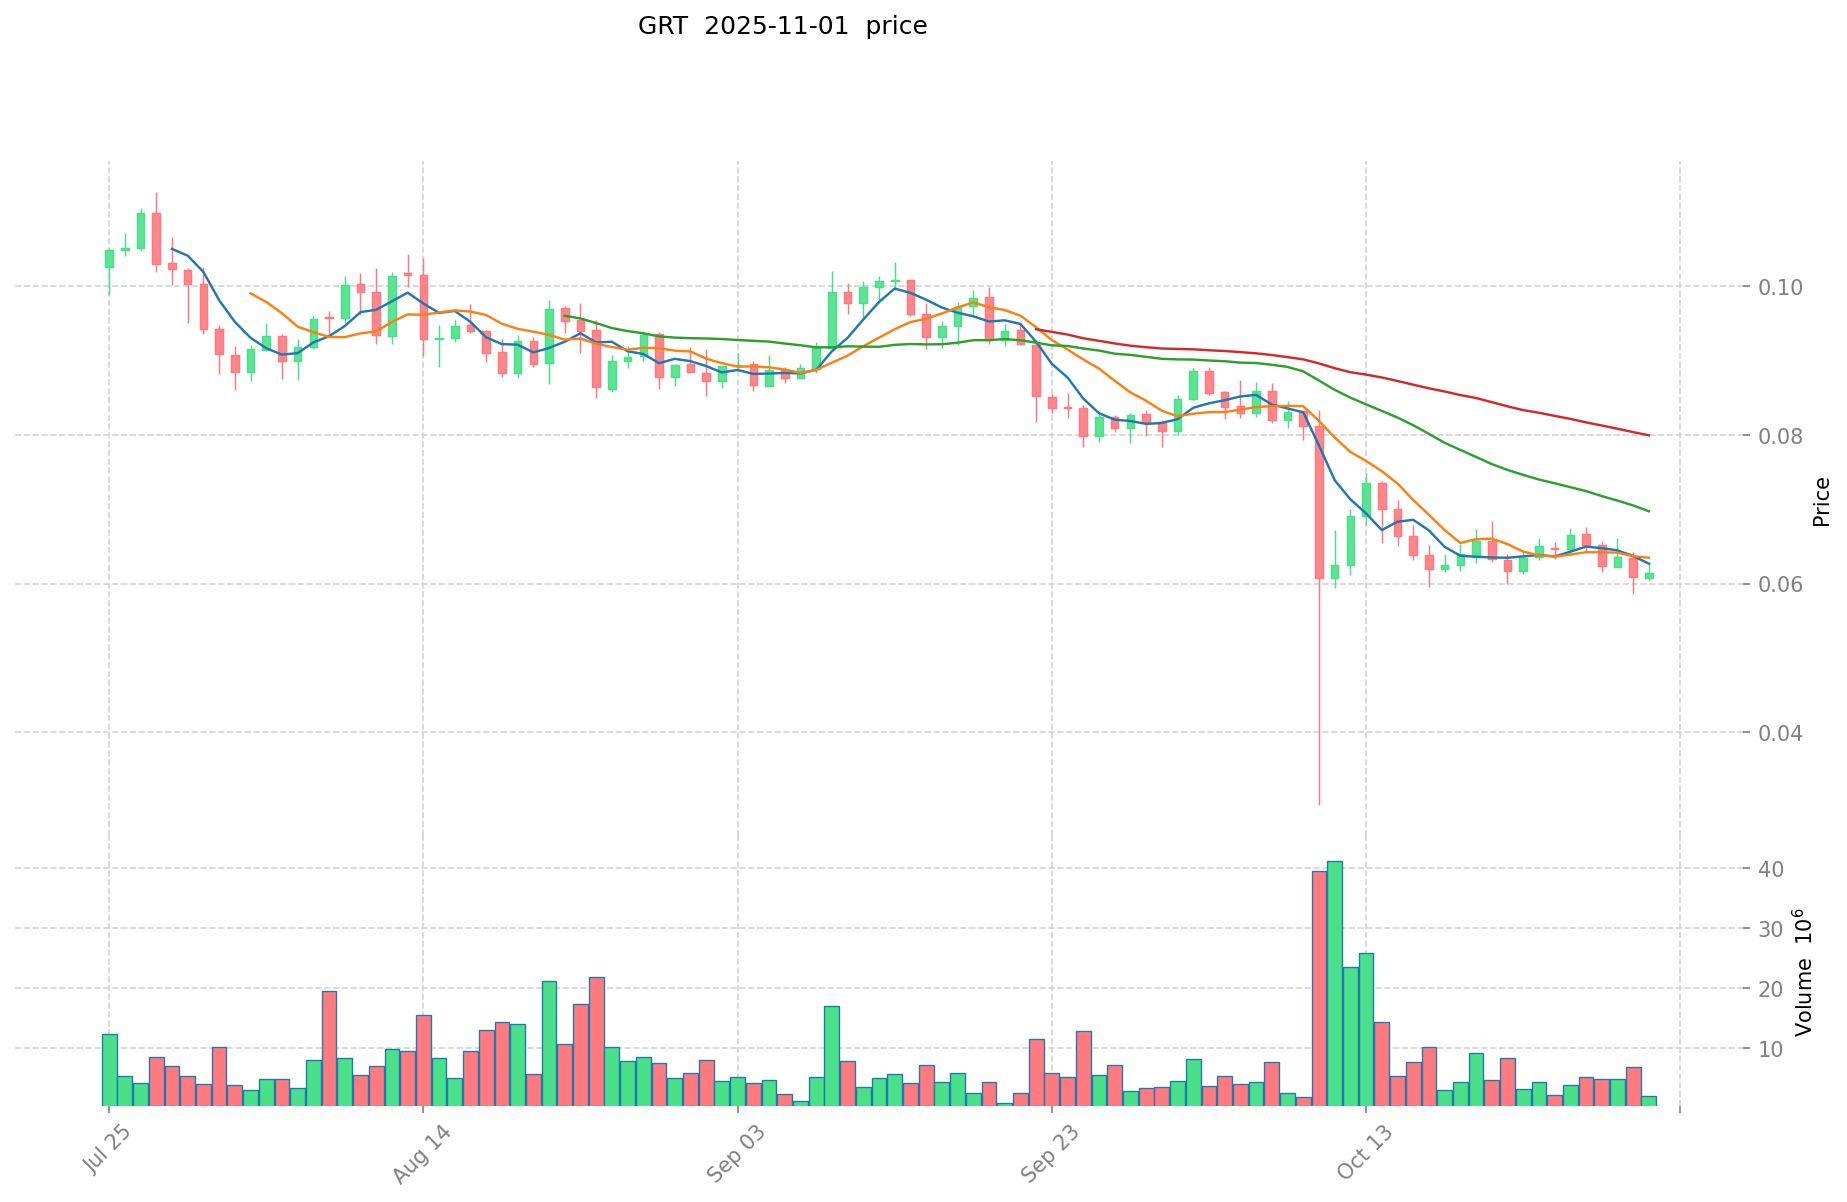
- GRT current price: $0.06374
- 24-hour trading volume: $10,158.32 (GCOIN) vs $475,211.35 (GRT)
- Market Sentiment Index (Fear & Greed Index): 33 (Fear)
Click to view real-time prices:
- Check GCOIN current price Market Price
- Check GRT current price Market Price
Investment Value Drivers: GCOIN vs GRT
Ecosystem Development and Value Creation
- GCOIN: Value primarily determined by the ecosystem's development and continuous value creation
- GRT: Ecosystem elements gain value as the project continues to build and mature
- 📌 Historical Pattern: Projects that consistently build and enhance their ecosystems see sustainable value growth over time
Technical Innovation and Integration
- Advanced Technologies: Integration of cutting-edge technologies like LSTM and neural networks enhances investment value
- Cross-Chain Compatibility: Seamless integration with major blockchains including BNB, Base, and Solana increases utility and adoption potential
- Decision Support Systems: Technical implementations that improve trading decision accuracy (reported ~35% improvement) create competitive advantages
Market Recognition and Regulatory Compliance
- Regulatory Acceptance: Projects with clear regulatory compliance attract more institutional investors
- Security Measures: Enhanced security protocols increase investor confidence and platform stability
- Market Trust: Projects with stronger market recognition tend to maintain better value stability during market downturns
Real-World Applications and Usability
- GCOIN: Currently trading at approximately 0.001461 USD
- User Experience: Systems designed for both beginners and experienced users expand the potential user base
- Long-term Development: Projects focused on gradual, thoughtful development often demonstrate more sustainable value growth
III. 2025-2030 Price Prediction: GCOIN vs GRT
Short-term Prediction (2025)
- GCOIN: Conservative $0.000821236 - $0.0012077 | Optimistic $0.0012077 - $0.001739088
- GRT: Conservative $0.061983 - $0.0639 | Optimistic $0.0639 - $0.072207
Mid-term Prediction (2027)
- GCOIN may enter a growth phase, with prices expected in the range of $0.0008528741169 - $0.002173992847
- GRT may enter a consolidation phase, with prices expected in the range of $0.0531497835 - $0.1040538015
- Key drivers: Institutional capital inflow, ETF developments, ecosystem growth
Long-term Prediction (2030)
- GCOIN: Base scenario $0.002567882724077 - $0.002978743959929 | Optimistic scenario $0.002978743959929
- GRT: Base scenario $0.125616809026293 - $0.165814187914707 | Optimistic scenario $0.165814187914707
Disclaimer: This analysis is for informational purposes only and should not be considered as financial advice. Cryptocurrency markets are highly volatile and unpredictable. Always conduct your own research before making any investment decisions.
GCOIN:
| 年份 | 预测最高价 | 预测平均价格 | 预测最低价 | 涨跌幅 |
|---|---|---|---|---|
| 2025 | 0.001739088 | 0.0012077 | 0.000821236 | 0 |
| 2026 | 0.00187121038 | 0.001473394 | 0.00107557762 | 22 |
| 2027 | 0.002173992847 | 0.00167230219 | 0.0008528741169 | 38 |
| 2028 | 0.00226931407183 | 0.0019231475185 | 0.00157698096517 | 59 |
| 2029 | 0.003039534652989 | 0.002096230795165 | 0.001362550016857 | 74 |
| 2030 | 0.002978743959929 | 0.002567882724077 | 0.002259736797187 | 113 |
GRT:
| 年份 | 预测最高价 | 预测平均价格 | 预测最低价 | 涨跌幅 |
|---|---|---|---|---|
| 2025 | 0.072207 | 0.0639 | 0.061983 | 0 |
| 2026 | 0.0816642 | 0.0680535 | 0.05172066 | 6 |
| 2027 | 0.1040538015 | 0.07485885 | 0.0531497835 | 17 |
| 2028 | 0.1225551662775 | 0.08945632575 | 0.048306415905 | 40 |
| 2029 | 0.145227872038837 | 0.10600574601375 | 0.078444252050175 | 66 |
| 2030 | 0.165814187914707 | 0.125616809026293 | 0.092956438679457 | 97 |
IV. Investment Strategy Comparison: GCOIN vs GRT
Long-term vs Short-term Investment Strategies
- GCOIN: Suitable for investors focused on gaming ecosystems and play-to-earn potential
- GRT: Suitable for investors seeking blockchain infrastructure and data indexing exposure
Risk Management and Asset Allocation
- Conservative investors: GCOIN: 10% vs GRT: 90%
- Aggressive investors: GCOIN: 30% vs GRT: 70%
- Hedging tools: Stablecoin allocation, options, cross-currency portfolios
V. Potential Risk Comparison
Market Risks
- GCOIN: High volatility due to smaller market cap and gaming sector dependence
- GRT: Vulnerability to overall blockchain market trends and adoption rates
Technical Risks
- GCOIN: Scalability, network stability in gaming environment
- GRT: Data indexing accuracy, potential vulnerabilities in query systems
Regulatory Risks
- Global regulatory policies may impact both differently, with GRT potentially facing more scrutiny due to its infrastructure role
VI. Conclusion: Which Is the Better Buy?
📌 Investment Value Summary:
- GCOIN advantages: Niche market in gaming, potential for rapid growth in play-to-earn sector
- GRT advantages: Established position in blockchain infrastructure, wider adoption across various chains
✅ Investment Advice:
- Novice investors: Consider a small allocation to GRT as part of a diversified crypto portfolio
- Experienced investors: Balanced approach with higher allocation to GRT, smaller speculative position in GCOIN
- Institutional investors: Focus on GRT for its established market position and infrastructure role
⚠️ Risk Warning: Cryptocurrency markets are highly volatile. This article does not constitute investment advice. None
VII. FAQ
Q1: What are the main differences between GCOIN and GRT? A: GCOIN is focused on the gaming and play-to-earn sector, while GRT is a decentralized protocol for indexing and querying blockchain data. GRT has a larger market cap and trading volume compared to GCOIN.
Q2: Which token has performed better historically? A: GRT has shown better historical performance, reaching an all-time high of $2.84 in February 2021. GCOIN experienced significant volatility, dropping from its all-time high of $2.16 to under $0.01 by the end of 2022.
Q3: What are the price predictions for GCOIN and GRT by 2030? A: For GCOIN, the base scenario predicts a range of $0.002567882724077 - $0.002978743959929. For GRT, the base scenario predicts a range of $0.125616809026293 - $0.165814187914707.
Q4: How should investors allocate their portfolio between GCOIN and GRT? A: Conservative investors might consider allocating 10% to GCOIN and 90% to GRT, while aggressive investors might allocate 30% to GCOIN and 70% to GRT.
Q5: What are the main risks associated with investing in GCOIN and GRT? A: GCOIN faces high volatility due to its smaller market cap and dependence on the gaming sector. GRT is vulnerable to overall blockchain market trends and adoption rates. Both face potential regulatory risks, with GRT possibly facing more scrutiny due to its infrastructure role.
Q6: Which token is better suited for long-term investment? A: GRT may be better suited for long-term investment due to its established position in blockchain infrastructure and wider adoption across various chains. However, investors should conduct their own research and consider their risk tolerance before making any investment decisions.
Share
Content
Introduction: GCOIN vs GRT Investment Comparison
I. Price History Comparison and Current Market Status
Investment Value Drivers: GCOIN vs GRT
III. 2025-2030 Price Prediction: GCOIN vs GRT
IV. Investment Strategy Comparison: GCOIN vs GRT
V. Potential Risk Comparison
VI. Conclusion: Which Is the Better Buy?
VII. FAQ

