PROPS vs SNX: A Comprehensive Comparison of Two Leading Decentralized Protocols in the Crypto Ecosystem

Introduction: PROPS vs SNX Investment Comparison
In the cryptocurrency market, comparisons between PROPS and SNX have become an inevitable topic for investors. The two not only show significant differences in market capitalization ranking, application scenarios, and price performance, but also represent different positioning of crypto assets. PROPS (PROPS): Since its launch in 2023, it has gained market recognition by offering tokenized real estate investment opportunities with fractional ownership starting at $100, allowing users to earn rental yields on high-quality real estate assets in Southeast Asia. SNX (SNX): Since its inception in 2018, it has been recognized as a protocol for building decentralized synthetic asset platforms, supporting a variety of comprehensive assets including fiat currencies pegged to the US dollar, precious metals, indexes, and other cryptocurrencies. This article will comprehensively analyze the investment value comparison between PROPS and SNX from multiple dimensions including historical price trends, supply mechanisms, market positioning, and technical ecosystem, while attempting to answer the most pressing question investors face:
"Which is the better buy right now?"
Comparative Analysis Report: Propbase (PROPS) and Synthetix (SNX)
I. Price History Comparison and Current Market Status
Propbase (PROPS) and Synthetix (SNX) Historical Price Trends
Propbase (PROPS):
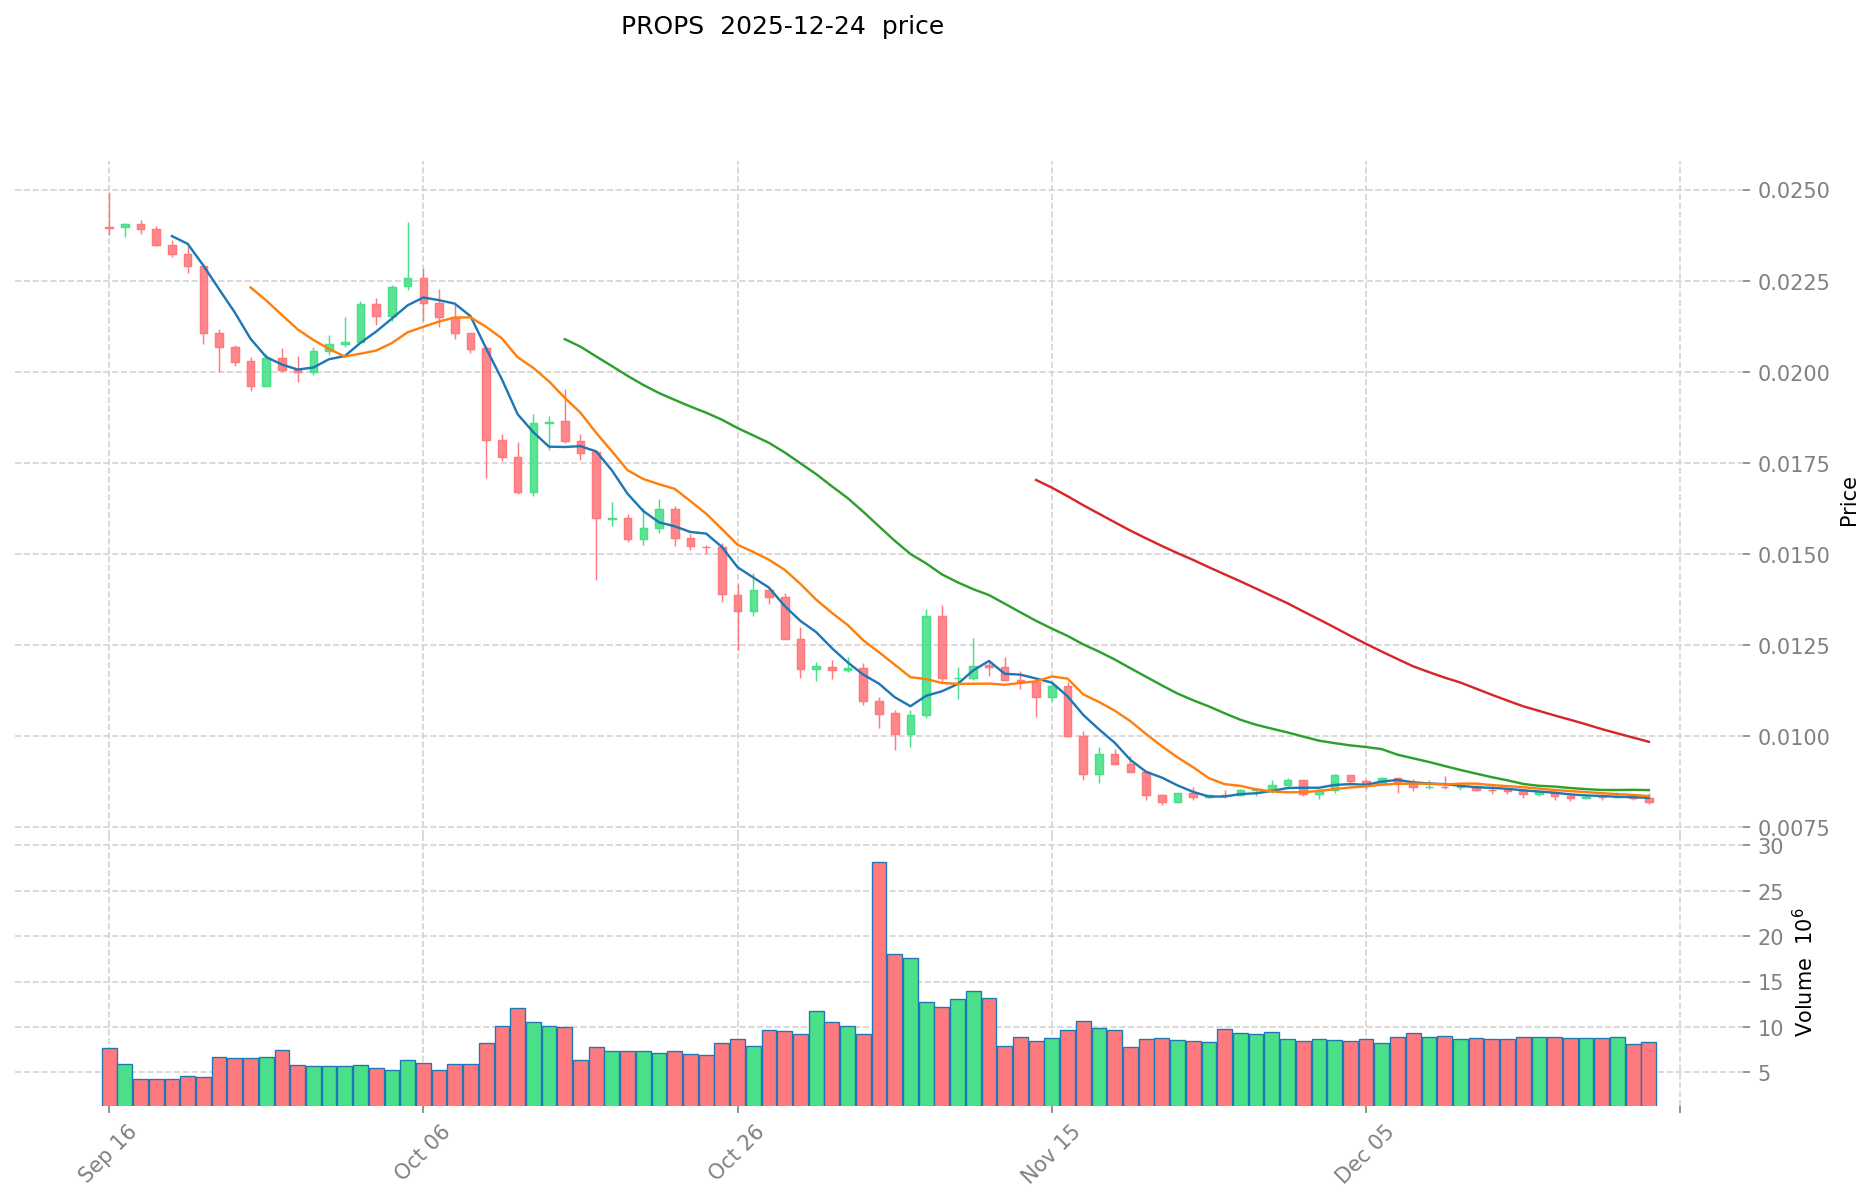
- All-Time High (ATH): $0.1873 on April 30, 2024
- All-Time Low (ATL): $0.008086 on December 24, 2025
- Price Decline from ATH to ATL: 95.68% loss
Synthetix (SNX):
- All-Time High (ATH): $28.53 on February 14, 2021
- All-Time Low (ATL): $0.0347864 on January 6, 2019
- 1-Year Performance: -79.62% decline
Comparative Analysis: PROPS has experienced a severe contraction since its 2024 peak, with a dramatic 95.68% depreciation bringing the token to near its historical lows. In contrast, SNX has undergone a prolonged bear market since its 2021 peak, though it has recovered somewhat from its 2019 lows. Both tokens reflect the broader market weakness observed in late 2025, with both assets trading significantly below their historical highs.
Current Market Status (December 24, 2025)
Price Information:
- PROPS Current Price: $0.008098
- SNX Current Price: $0.425
- Price Ratio: SNX is approximately 52.5x higher than PROPS
24-Hour Trading Volume:
- PROPS: $68,967.99
- SNX: $1,696,465.03
- Volume Comparison: SNX trading volume exceeds PROPS by approximately 24.6x
Market Capitalization:
- PROPS Total Market Cap: $9,717,600.00
- PROPS Circulating Market Cap: $3,697,962.06
- SNX Total Market Cap: $146,153,186.29
- SNX Circulating Market Cap: $145,973,142.22
Market Sentiment Index (Fear & Greed Index):
- Current Reading: 24 (Extreme Fear)
- Status: Market is experiencing extreme fear sentiment, indicating heightened risk aversion among investors
View Current Market Prices:
II. Price Performance Analysis
Short-Term Price Movements
24-Hour Changes:
- PROPS: -2.49% (down $0.000207)
- SNX: +1.63% (up $0.006816)
7-Day Performance:
- PROPS: -4.43%
- SNX: -0.65%
30-Day Performance:
- PROPS: -3.39%
- SNX: -27.95%
One-Year Performance:
- PROPS: -91.23%
- SNX: -79.62%
Price Range Analysis
24-Hour Trading Range:
- PROPS: $0.008086 - $0.008447
- SNX: $0.4100 - $0.4439
Circulating Supply Ratios:
- PROPS: 38.05% of maximum supply (456.65M / 1.2B tokens)
- SNX: 99.88% of maximum supply (343.47M / 343.89M tokens)
III. Project Overview and Functionality
Propbase (PROPS)
Project Description: Propbase is a tokenized real estate investment marketplace based in Southeast Asia. The platform enables fractional ownership of high-quality real estate assets starting from as little as $100, allowing investors to earn rental yield and trade properties on-chain.
Utility Token Function: PROPS serves as the native utility token and functions as:
- Unified settlement method for all smart contract interactions
- Transaction fee currency for all property trades
- Access requirement for new property listings
Blockchain:
- Built on Aptos blockchain
- Contract Address: 0x6dba1728c73363be1bdd4d504844c40fbb893e368ccbeff1d1bd83497dbc756d
Synthetix (SNX)
Project Description: Synthetix (formerly Havven) is a decentralized finance (DeFi) protocol designed for building decentralized and trustless networks. The platform enables trading of synthetic assets that track real-world asset prices without requiring direct asset ownership.
Supported Synthetic Assets:
- Fiat currencies (US dollar-pegged)
- Precious metals
- Indices
- Cryptocurrencies
Token Utility:
- Collateral for synthetic asset creation through staking
- Fee distribution mechanism for network participants
- Governance participation
Blockchain Deployment:
- Primary deployment: Ethereum (ETH)
- Secondary deployment: Optimism (OPETH)
IV. Market Position and Exchange Listing
Propbase (PROPS):
- Market Ranking: #1,724
- Active Exchange Listings: 7
- Token Holders: 6,332
- Market Dominance: 0.00030%
- Publish Date: November 9, 2023
- Initial Price: $0.0032
Synthetix (SNX):
- Market Ranking: #260
- Active Exchange Listings: 50
- Token Holders: 86,205
- Market Dominance: 0.0046%
- Publish Date: May 15, 2017
- Initial Price: $0.9
V. Trading Activity and Liquidity
PROPS Trading Distribution: Primary trading pairs are PROPS/USDT across multiple centralized exchanges including major platforms with varying liquidity profiles.
SNX Trading Distribution: SNX maintains significantly higher liquidity with presence on 50+ exchanges, including major centralized and decentralized trading venues on both Ethereum and Optimism networks.
Market Emotion Assessment: Current market sentiment reflects extreme fear conditions, with the Fear & Greed Index at 24 points, suggesting heightened market uncertainty and potential risk aversion among participants in both asset classes.
VI. Key Differentiators
| Factor | PROPS | SNX |
|---|---|---|
| Market Cap | $9.72M | $146.15M |
| Exchange Listings | 7 | 50 |
| Token Holders | 6,332 | 86,205 |
| YTD Performance | -91.23% | -79.62% |
| ATH to Current | -95.68% | -98.51% |
| Blockchain | Aptos | Ethereum/Optimism |
| Primary Use Case | Real Estate Tokenization | DeFi Derivatives |
VII. Risk Considerations
Both PROPS and SNX exhibit significant price volatility and have experienced substantial declines from their historical highs. PROPS, as a newer project with limited exchange presence and holder base, presents higher concentration risk. SNX's prolonged bear market performance reflects broader challenges in the DeFi derivatives sector. Market sentiment indicators suggest heightened systemic risk across cryptocurrency markets.
Report Generated: December 24, 2025 Data Source: Gate Market Data Disclaimer: This report is for informational purposes only and does not constitute investment advice. Cryptocurrency investments carry substantial risk, and investors should conduct thorough due diligence before making trading decisions.

Cryptocurrency Asset Investment Analysis Report: Core Factors Influencing PROPS and SNX Investment Value
I. Executive Summary
Based on available reference materials, this report examines the investment value of PROPS and SNX tokens. The core investment factors for these assets are primarily influenced by market demand, project development prospects, and community activity levels. It should be noted that both tokens exhibit significant price volatility, requiring cautious investment approach.
II. Core Factors Influencing PROPS vs SNX Investment Value
Market Demand and Price Volatility
- General Characteristics: Virtual asset values are subject to market factor influences, presenting inherent volatility risks for both tokens.
- Investor Considerations: Investment decisions should account for price fluctuation exposure and market sentiment shifts.
Community Activity and Project Development Prospects
- Primary Value Drivers: Community engagement levels and project advancement directly impact token valuations.
- Market Sensitivity: Tokens with higher community activity demonstrate relatively stronger market resilience during correction periods.
Strategic Partnerships and Ecosystem Development
- PROPS: Investment value is supported by potential growth and development opportunities in the digital entertainment domain through strategic collaborations.
- SNX: Market performance depends on its utility within the synthetic assets and derivatives trading ecosystem.
III. Current Market Environment Context
Bitcoin and Stablecoin Reserve Dynamics
Stablecoin reserves on major cryptocurrency exchanges have reached historic levels, with Binance's reserves surpassing $44.5 billion as of December 31. This liquidity environment creates conditions for potential asset price movements.
Emerging Ecosystem Opportunities
Recent fundraising activities demonstrate continued capital deployment in cryptocurrency infrastructure:
- Swarm Network: Completed $13 million financing round on August 27, 2025, with participation from institutional investors including Sui, Ghaf Capital, Brinc, y2z Ventures, and Zerostage.
IV. Risk Considerations
Virtual property value fluctuations present material risks to cryptocurrency investments. Price volatility can be substantial and rapid, particularly for tokens with smaller market capitalizations or limited trading liquidity.
- Volatility Risk: Both PROPS and SNX exhibit significant price movement potential.
- Market Sentiment Risk: Community activity and media attention can create sharp corrections following periods of appreciation.
- Liquidity Risk: Trading depth and order book conditions may impact execution prices during volatile periods.
V. Disclaimer
This report presents factual information from available sources and does not constitute investment advice. Cryptocurrency assets carry substantial risk, including potential loss of principal. Investors must conduct independent due diligence and consult with qualified financial advisors before making investment decisions. Past performance does not guarantee future results.
Report Date: December 24, 2025
Data Sources: CoinGlass, Gate.com, Cointelegraph Markets Pro, CryptoQuant
III. 2025-2030 Price Forecast: PROPS vs SNX
Short-term Forecast (2025)
- PROPS: Conservative $0.005262 - $0.008095 | Optimistic $0.011657
- SNX: Conservative $0.257220 - $0.428700 | Optimistic $0.514440
Mid-term Forecast (2027-2028)
- PROPS may enter a growth phase with increased adoption, projected price range $0.008814 - $0.015451
- SNX may experience moderate expansion driven by protocol enhancements, projected price range $0.311378 - $0.683022
- Key drivers: Institutional capital inflow, derivative product launches, ecosystem development acceleration
Long-term Forecast (2029-2030)
- PROPS: Base case $0.014288 - $0.015363 | Optimistic scenario $0.021146 - $0.022738
- SNX: Base case $0.600726 - $0.720036 | Optimistic scenario $0.763238 - $0.904797
Disclaimer: These forecasts are based on historical data analysis and should not be considered financial advice. Cryptocurrency markets are highly volatile and unpredictable. Investors should conduct independent research and assess their risk tolerance before making investment decisions.
PROPS:
| 年份 | 预测最高价 | 预测平均价格 | 预测最低价 | 涨跌幅 |
|---|---|---|---|---|
| 2025 | 0.0116568 | 0.008095 | 0.00526175 | 0 |
| 2026 | 0.01086349 | 0.0098759 | 0.005629263 | 21 |
| 2027 | 0.01545084555 | 0.010369695 | 0.00881424075 | 28 |
| 2028 | 0.0178161729795 | 0.012910270275 | 0.00839167567875 | 59 |
| 2029 | 0.02273756800833 | 0.01536322162725 | 0.014287796113342 | 89 |
| 2030 | 0.021145938247746 | 0.01905039481779 | 0.017526363232366 | 135 |
SNX:
| 年份 | 预测最高价 | 预测平均价格 | 预测最低价 | 涨跌幅 |
|---|---|---|---|---|
| 2025 | 0.51444 | 0.4287 | 0.25722 | 0 |
| 2026 | 0.5328741 | 0.47157 | 0.3536775 | 10 |
| 2027 | 0.683021988 | 0.50222205 | 0.311377671 | 17 |
| 2028 | 0.84744948717 | 0.592622019 | 0.50372871615 | 38 |
| 2029 | 0.7632378982701 | 0.720035753085 | 0.6912343229616 | 67 |
| 2030 | 0.904796927326611 | 0.74163682567755 | 0.600725828798815 | 73 |
Comparative Investment Analysis Report: PROPS vs SNX
I. Investment Strategy Comparison: PROPS vs SNX
Long-Term vs Short-Term Investment Strategies
PROPS: Suitable for investors focused on emerging tokenized real estate opportunities and Southeast Asian market expansion. Long-term strategy emphasizes accumulation during current extreme fear conditions, targeting investors with high risk tolerance seeking exposure to real asset tokenization innovation. Short-term trading is constrained by limited liquidity (7 exchange listings, $68,968 daily volume).
SNX: Suitable for investors seeking established DeFi derivatives exposure with deeper market liquidity. Long-term strategy benefits from protocol maturation and synthetic asset ecosystem development. Short-term traders can leverage superior liquidity ($1.7M daily volume, 50 exchange listings) for more flexible entry and exit opportunities.
Risk Management and Asset Allocation
Conservative Investors:
- PROPS: 5-10% allocation maximum (due to 95.68% drawdown from ATH and market concentration risk)
- SNX: 15-25% allocation (established protocol with broader institutional adoption)
- Recommended hedge: 60-70% stablecoin reserves, 5-10% Bitcoin diversification
Aggressive Investors:
- PROPS: 20-35% allocation (speculative recovery play on depressed valuation)
- SNX: 25-40% allocation (higher liquidity supports larger position sizing)
- Hedge tools: Cross-exchange arbitrage opportunities, stablecoin pairs for volatility protection, derivatives positions on major exchanges
II. Comparative Risk Analysis
Market Risk
PROPS: Extreme concentration risk with only 6,332 token holders and 38.05% circulating supply. Market capitalization of $9.72M indicates highly illiquid asset vulnerable to sudden price movements. 91.23% year-to-date decline reflects severe liquidity crises and potential project viability concerns. Fear & Greed Index at 24 (Extreme Fear) amplifies downside vulnerability for smaller-cap assets.
SNX: Lower concentration risk with 86,205 token holders and 99.88% circulating supply released. Market cap of $146.15M provides substantially greater liquidity resilience. However, 79.62% year-to-date decline demonstrates sector-wide DeFi derivatives weakness despite superior structural positioning compared to PROPS.
Technical Risk
PROPS: Built on Aptos blockchain—a Layer 1 network with lower adoption compared to Ethereum. Limited transaction volume history and network maturity create execution risk. Smart contract security audit frequency and coverage remain unstated in available materials.
SNX: Deployed across Ethereum (primary) and Optimism (secondary), providing dual-chain redundancy and access to established liquidity pools. Ethereum's mature security infrastructure and extensive audit history reduce technical risk. Optimism deployment enables lower-cost transactions but introduces additional smart contract complexity.
Liquidity Risk
PROPS: 7 active exchange listings create execution slippage risk for position sizing above $50,000-$100,000. Limited order book depth may result in 5-15% price impact for institutional-sized transactions. Recovery during market rallies may lag SNX due to connectivity constraints.
SNX: 50+ exchange listings including major centralized (Binance, Coinbase, Kraken) and decentralized venues (Uniswap, Curve) provide superior execution. Institutional-sized positions can be executed with minimal slippage, supporting professional portfolio management.
Regulatory Risk
PROPS: Tokenized real estate presents emerging regulatory classification challenges. Southeast Asian jurisdictions (primary market focus) have evolving digital asset frameworks. Securities law application to fractional real estate ownership remains ambiguous in multiple target markets, creating policy implementation risk.
SNX: Synthetic derivatives trading faces consistent regulatory scrutiny across major jurisdictions. EU Markets in Crypto-Assets Regulation (MiCA) and US regulatory clarification efforts may impose trading restrictions or capital requirements on protocol operations. Established regulatory dialogue provides relative clarity versus emerging PROPS framework.
III. Performance Comparison and Price Forecast Analysis
Historical Performance Context
| Metric | PROPS | SNX |
|---|---|---|
| All-Time High | $0.1873 (Apr 2024) | $28.53 (Feb 2021) |
| Current Price | $0.008098 | $0.425 |
| ATH Decline | -95.68% | -98.51% |
| 1-Year Return | -91.23% | -79.62% |
| 24H Volume | $68,968 | $1,696,465 |
| Market Cap | $9.72M | $146.15M |
Medium-Term Price Forecast (2027-2028)
PROPS Projection: $0.008814 - $0.015451 range, representing +9% to +91% upside from December 2025 lows. Growth drivers include increased real estate tokenization adoption, additional exchange listings, and Southeast Asian institutional capital inflow. Recovery contingent on market sentiment improvement and project development acceleration.
SNX Projection: $0.311378 - $0.683022 range, representing -27% to +61% variance from current levels. Upside potential driven by synthetic asset protocol maturation, expanded trading pair offerings, and institutional derivatives demand. Mid-cycle volatility expected as market reconciles DeFi risk frameworks.
Long-Term Price Forecast (2029-2030)
PROPS Long-Term Scenario:
- Base case: $0.014288 - $0.015363 (+77% to +90% from current)
- Optimistic case: $0.021146 - $0.022738 (+161% to +181%)
- Growth trajectory dependent on mainstream real estate market adoption and regulatory approval across Southeast Asian jurisdictions
SNX Long-Term Scenario:
- Base case: $0.600726 - $0.720036 (+41% to +69% from current)
- Optimistic case: $0.763238 - $0.904797 (+79% to +113%)
- Performance linked to DeFi derivatives market expansion and Ethereum ecosystem development
Note: These forecasts derive from historical data pattern analysis and should not be considered financial guidance. Cryptocurrency valuation models exhibit substantial prediction variance, particularly for volatile assets.
IV. Conclusion: Which Is the Better Buy?
📌 Investment Value Summary
PROPS Advantages:
- Exposure to emerging tokenized real estate market segment with limited competitive supply
- Current 95.68% drawdown provides asymmetric risk-reward for contrarian accumulation
- Fractional ownership model ($100 minimum entry) demonstrates innovative market accessibility
- Southeast Asian real estate sector growth tailwinds support long-term value appreciation
SNX Advantages:
- Established DeFi derivatives protocol with multi-year operational history and proven technology
- Superior liquidity profile (50 exchange listings, $1.7M daily volume) enables professional trading
- Broader institutional adoption and regulatory clarity compared to emerging PROPS framework
- Dual-chain deployment (Ethereum/Optimism) provides network resilience and cost optimization
✅ Investment Recommendations
Beginner Investors: Recommend allocation toward SNX with 15-20% portfolio weighting within cryptocurrency holdings. Established protocol, superior liquidity, and clearer risk parameters provide more suitable entry conditions for novice participants. PROPS requires advanced research capabilities and extreme risk tolerance unsuitable for portfolio diversification purposes.
Experienced Investors: Consider tactical PROPS accumulation at current depressed valuations (5-15% allocation) combined with SNX positions (20-30% allocation) for balanced exposure. Active monitoring of PROPS exchange listing announcements, project development milestones, and regulatory developments essential for risk management. Implement strict stop-loss discipline (15-20% below entry) for PROPS positions given extreme drawdown history.
Institutional Investors: SNX provides primary exposure vehicle with institutional-grade liquidity and derivative hedging capability. PROPS position-building should follow successful real estate asset origination announcements and institutional investor participation signals. Consider 10-15% alternative allocation weight to PROPS within emerging market technology thematic strategies for asymmetric return exposure, subject to internal risk governance frameworks and liquidity requirements.
⚠️ Risk Disclaimer: Cryptocurrency markets exhibit extreme volatility with potential for rapid and substantial loss of principal capital. Both PROPS and SNX have experienced severe drawdowns from historical highs, with current market sentiment at Extreme Fear levels (Fear & Greed Index: 24). This report provides factual information analysis only and does not constitute investment advice. All investment decisions require independent due diligence, risk assessment alignment with personal financial objectives, and consultation with qualified financial advisors. Past performance does not guarantee future results. Regulatory frameworks governing cryptocurrency assets remain evolving and uncertain across major global jurisdictions.
Report Date: December 24, 2025
Data Sources: Gate Market Data, CoinGlass, CryptoQuant, Cointelegraph Markets Pro
Disclaimer: This analysis is for informational purposes only and does not provide recommendations to buy, sell, or hold any cryptocurrency asset.
None
Cryptocurrency Asset Comparison: PROPS vs SNX - Frequently Asked Questions
FAQ
Q1: What are the main differences between PROPS and SNX in terms of project positioning?
A: PROPS is a tokenized real estate investment platform launched in 2023, enabling fractional ownership of Southeast Asian real estate assets starting at $100 with rental yield opportunities. SNX is an established DeFi protocol since 2018 focused on decentralized synthetic asset trading, supporting fiat currencies, precious metals, indices, and cryptocurrencies. PROPS targets real asset tokenization innovation, while SNX operates within derivatives trading infrastructure.
Q2: How severe are the price declines for both tokens, and what is the current market sentiment?
A: PROPS has experienced a 95.68% decline from its all-time high of $0.1873 (April 2024) to current price of $0.008098, while SNX has fallen 98.51% from its $28.53 peak (February 2021) to $0.425. Both tokens reflect late 2025 market weakness, with the Fear & Greed Index at extreme fear levels (24), indicating heightened risk aversion and systemic cryptocurrency market challenges.
Q3: Which token offers better liquidity for active trading?
A: SNX significantly outperforms PROPS in liquidity metrics. SNX maintains 50 exchange listings with $1.7M daily trading volume compared to PROPS' 7 listings and $68,968 daily volume—approximately 24.6x difference. For institutional-sized positions and professional traders, SNX provides superior execution capabilities with minimal slippage, while PROPS faces substantial liquidity constraints limiting effective position sizing above $50,000-$100,000.
Q4: What are the primary risk factors for each investment?
A: PROPS carries extreme concentration risk with only 6,332 token holders, minimal market capitalization ($9.72M), and regulatory uncertainty surrounding tokenized real estate frameworks in Southeast Asia. SNX faces DeFi derivatives sector-wide regulatory scrutiny, particularly from EU and US authorities, though it benefits from established operational history and broader institutional adoption. Both tokens exhibit severe price volatility with substantial drawdown exposure from historical highs.
V: What long-term price appreciation potential exists for each token through 2030?
A: PROPS forecasts project a range of $0.014288-$0.022738 by 2030 (representing 77%-181% upside from December 2025 levels), contingent on mainstream real estate tokenization adoption and regulatory approval. SNX projections range $0.600726-$0.904797 by 2030 (representing 41%-113% upside), dependent on DeFi derivatives market expansion and Ethereum ecosystem development. Both forecasts carry substantial prediction variance and should not be considered financial guidance.
VI: Which token is more suitable for conservative versus aggressive investors?
A: Conservative investors should favor SNX with 15-25% allocation weighting due to superior liquidity, institutional adoption, and established regulatory dialogue. PROPS allocation should remain 5-10% maximum for conservative portfolios. Aggressive investors may consider PROPS positions of 20-35% as speculative recovery plays on depressed valuations, combined with SNX allocations of 25-40% supporting higher risk tolerance. All positions require strict risk management with 60-70% stablecoin reserves and 5-10% Bitcoin diversification for portfolio stability.
VII: What blockchain infrastructure differences exist between PROPS and SNX?
A: PROPS operates on the Aptos Layer 1 blockchain, presenting technology adoption risk due to lower network maturity compared to Ethereum. SNX deploys across Ethereum (primary) and Optimism (secondary), providing dual-chain redundancy, access to mature liquidity infrastructure, and reduced transaction costs. SNX's multi-chain approach offers superior technical resilience and institutional-grade security frameworks relative to PROPS' single-chain dependency on an emerging blockchain network.
VIII: What regulatory risks should investors consider before investing?
A: PROPS faces emerging regulatory classification challenges regarding tokenized real estate ownership across Southeast Asian jurisdictions with evolving digital asset frameworks, creating policy implementation uncertainty. SNX encounters established regulatory scrutiny on synthetic derivatives trading, particularly from EU Markets in Crypto-Assets Regulation (MiCA) and US regulatory frameworks that may impose trading restrictions or capital requirements. Regulatory developments in both areas could materially impact token valuations and trading availability across major platforms.
Report Date: December 24, 2025
Data Sources: Gate Market Data, CoinGlass, CryptoQuant, Cointelegraph Markets Pro
Disclaimer: This FAQ analysis provides factual information only and does not constitute investment advice. Cryptocurrency assets carry substantial risk including potential loss of principal capital. Investors must conduct independent due diligence and consult qualified financial advisors before making investment decisions. Past performance does not guarantee future results.
Share
Content
Introduction: PROPS vs SNX Investment Comparison
I. Price History Comparison and Current Market Status
II. Price Performance Analysis
III. Project Overview and Functionality
IV. Market Position and Exchange Listing
V. Trading Activity and Liquidity
VI. Key Differentiators
VII. Risk Considerations
I. Executive Summary
II. Core Factors Influencing PROPS vs SNX Investment Value
III. Current Market Environment Context
IV. Risk Considerations
V. Disclaimer
III. 2025-2030 Price Forecast: PROPS vs SNX
I. Investment Strategy Comparison: PROPS vs SNX
II. Comparative Risk Analysis
III. Performance Comparison and Price Forecast Analysis
IV. Conclusion: Which Is the Better Buy?
FAQ
How to Buy Cryptocurrency


Trending Cryptocurrencies


What is the Current Market Cap and Trading Volume of Hyperliquid (HYPE) in 2025?

ADX vs LINK: Comparing Two Leading Oracle and Data Solutions for Blockchain Applications

BTRST vs AAVE: Comparing Two Leading Governance Tokens in the DeFi Ecosystem

ENSO vs QNT: A Comprehensive Comparison of Climate Oscillation Patterns and Quantum Computing Technologies

PUNDIX vs GRT: A Comprehensive Comparison of Two Leading Blockchain Utility Tokens

G vs LINK: A Comprehensive Comparison of Two Leading Blockchain Protocols and Their Impact on Decentralized Finance

Cryptocurrency Tax Guide: Understanding Web3 Tax Implications and Compliance

Cryptocurrency Regulatory Compliance 2026: Legal Framework Implementation and Web3 Business Requirements

Global Cryptocurrency Regulations: Compliance Guide for Web3 Investors

Token Custody Security: Comprehensive Risk Analysis and Best Practices

How Federal Reserve Interest Rate Cuts Impact Crypto Markets in 2026