Gate Research: BTC and ETH Technical Structures Recover as PoW and AI Sectors Lead the Market
Crypto Market Overview
According to CoinGecko data, from October 28 to November 10, 2025, the crypto market experienced intensified volatility under the dual pressures of tightening macro liquidity and a DeFi trust crisis, although major assets began showing signs of short-term recovery. In terms of price action, BTC rebounded above $105,800 on November 8 after a series of declines, entering a pattern of “mild recovery and low-range consolidation.” ETH similarly climbed back above $3,630, with trading volume increasing moderately and buying momentum strengthening — indicating a marginal improvement in market sentiment.【1】
On the ecosystem and news front, SOL’s treasury firm Forward Industries announced a buyback program of up to $1 billion, signaling strong managerial confidence in long-term fundamentals. At the same time, Gate launched its decentralized Web3 Launchpad, offering secure, transparent on-chain issuance for users and project teams — a move that underscores the accelerating shift of centralized exchanges toward on-chain ecosystems.
At the macro level, the prolonged U.S. government shutdown pushed funding rates higher, raising liquidity concerns, while BTC perpetual funding rates plunged by 60%, reflecting reduced leverage demand but leaving room for a subsequent upside cycle.
The DeFi sector faced severe stress, as the Balancer hack and Stream Finance collapse caused over $1 billion in capital outflows, marking the most significant stablecoin-related crisis since the 2022 Terra meltdown. The incidents triggered cascading liquidations across multiple protocols and exposed systemic risks in yield-bearing stablecoins, particularly around transparency and asset management — pointing toward an industry shift back to prudence and compliance. Meanwhile, Google Finance announced the integration of Kalshi and Polymarket prediction market data, and FTSE Russell partnered with Chainlink to bring global indices on-chain, highlighting the accelerating convergence of traditional finance and Web3.
On-chain activity was led by WorldChain, which surpassed 1 million active addresses, maintained 60,000+ DAU, and recorded $56.3 million in net inflows, becoming a focal point in the multi-chain rotation. Overall, while the market remains under short-term pressure from liquidity and trust shocks, the broader trends of major-asset recovery and growing institutional engagement remain intact.
As risks and opportunities coexist, capital is shifting from high-leverage speculation toward high-certainty ecosystems, with “regulated finance + on-chain infrastructure” emerging as the core medium- to long-term theme. BTCFi and prediction markets continue to lead the next phase of structural market rotation.
1. Overview of Price Performance
This analysis groups the top 500 tokens by market capitalization to examine their average returns from October 28 to November 10.
Overall, market volatility increased significantly, with notable divergence across different market-cap segments. Structurally, the market showed a pattern of “mid-range assets rising modestly, while the top and bottom segments experienced heightened volatility.” Tokens ranked 100–200 by market cap recorded an average gain of 1.46%, indicating that some mid-cap assets retained recovery momentum during the broader market correction. Tokens in the 400–500 range also posted a mild increase of +0.79%, demonstrating relative resilience. In contrast, tokens in the 300–400 range suffered the steepest decline at –4.01%, while top-100 assets fell 1.57%, suggesting that capital did not materially rotate back into large-cap leaders.
The market remains in a choppy recovery phase. Although sentiment has shown signs of improvement, it has not yet formed a sustained upward trend. Overall, the market-cap structure suggests that mid-cap assets exhibit stronger downside protection and better capital absorption, while the top and bottom segments remain driven by liquidity shifts and risk-off behavior. This reflects a cautious and diversified allocation approach during the post-correction recovery cycle.
Based on CoinGecko data, the top 500 tokens by market capitalization were divided into groups of 100 (e.g., ranks 1–100, 101–200, etc.). For each group, price changes from October 28 to November 10, 2025 were measured and averaged to derive the segment’s mean return. The overall average decline (–1.91%) represents the simple average of individual returns across the top 500 tokens, unweighted by market cap.
Figure 1: The overall average decline was –1.91%, with tokens ranked 101–200 showing the strongest resilience, gaining approximately 1.46%.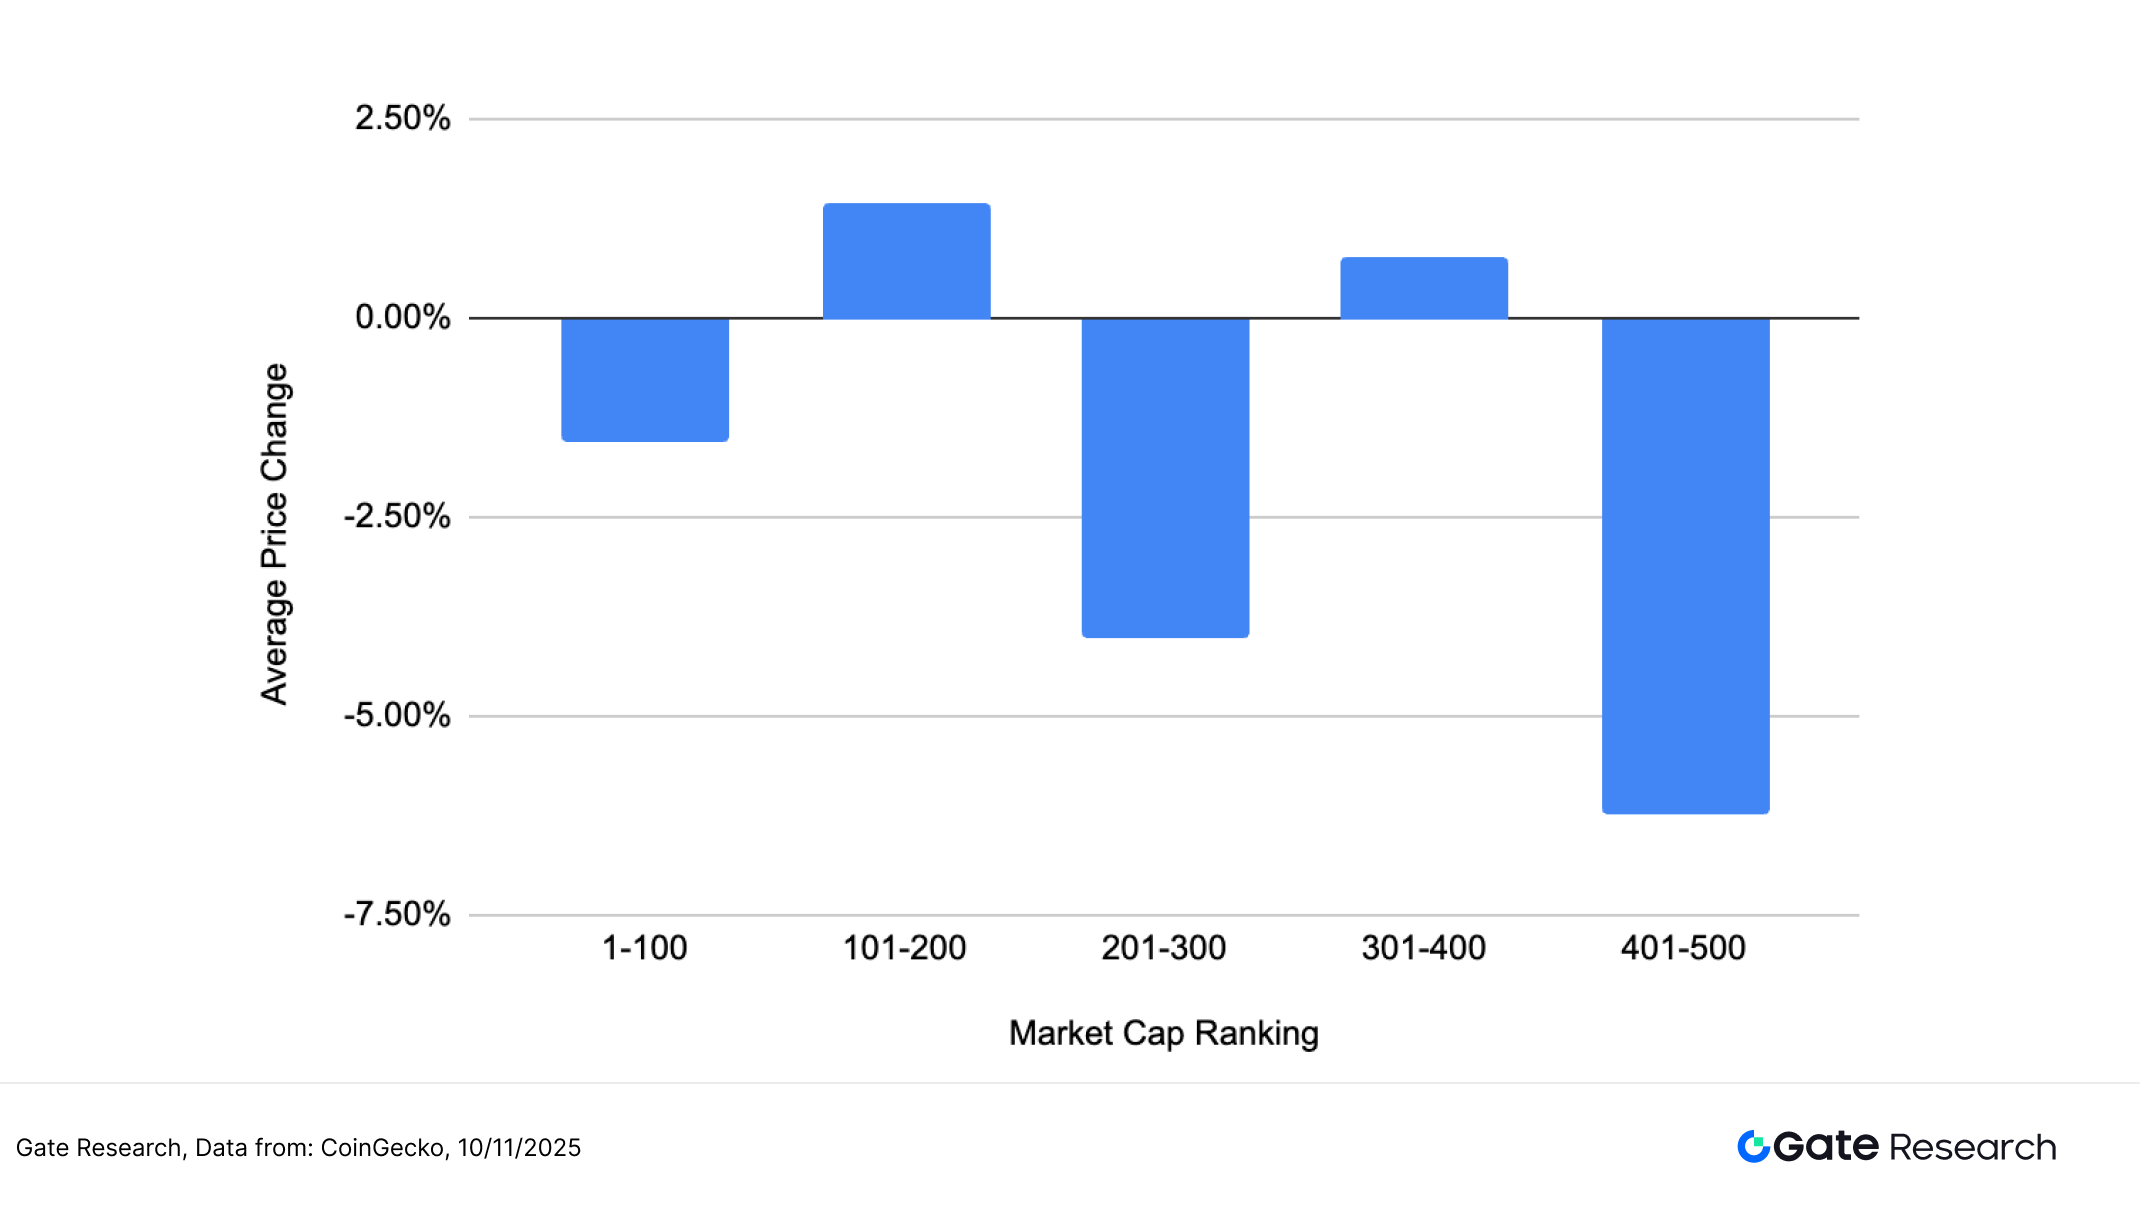
Top Gainers and Losers
Over the past two weeks (October 28 to November 10), the crypto market experienced heightened volatility, with capital rotating rapidly across different narrative sectors, resulting in sharp divergence among individual token performances.
Top Gainers: PoW and AI Narratives Lead the Rebound, ORE Takes the #1 Spot
ORE surged 514.62%, making it the strongest-performing token of the period. As part of the Solana PoW ecosystem under Ore Supply, ORE adopts a deflationary mining model designed for sustainable issuance and is increasingly viewed as a potential store-of-value (SoV) asset within the Solana network. With mining yields reaching new highs and growing discussion around its deflationary design, ORE attracted significant miner participation and capital inflows, pushing its price to consecutive new highs.
AIA (+238.02%) and SOON (+187.79%) ranked second and third, supported by strong capital flows into AI and emerging application tokens. AIA gained traction with its “AI + agent collaboration” narrative, while SOON benefited from strong community momentum and early airdrop expectations, fueling trading enthusiasm. Other mid- to large-cap assets such as DCR (+141.77%), ICP (+121.84%), and ZEC (+93.91%) also posted significant gains, indicating renewed market attention toward long-standing PoW and privacy projects backed by strong narratives.
Top Decliners: Thematic AI and Meme Tokens Pull Back, COAI Leads the Downtrend
On the downside, COAI recorded the steepest decline at –73.76%, reflecting rapid outflows from overheated AI narrative tokens. RECALL (–53.86%) and AIC (–50.70%) also ranked among the top decliners, suggesting elevated profit-taking pressure after prior strong rallies in the AI sector. H (–44.64%) and APEPE (–41.30%), which fall under the meme and gamefi segments, saw amplified volatility as capital rotated back toward major assets. Overall, this period’s losers were concentrated in short-term, high-volatility thematic tokens, reflecting rising risk aversion and portfolio rebalancing.
In summary, market dynamics continued to display a dual-track pattern of sustained performance in privacy and AI narratives alongside sharp unwinding in short-term speculative themes. After rounds of concentrated speculative trading, capital is gradually shifting toward projects with real technical foundations and strong thematic narratives. Privacy and data-focused assets are once again becoming a focal point for both institutional and retail investors. Looking ahead, as regulatory frameworks and compliance discussions advance, privacy computing and AI-integrated applications are likely to emerge as key medium- to long-term market themes.
Figure 2: ORE led the market with a 514.62% gain. As mining yields hit new highs and discussions around its deflationary model intensified, ORE attracted a surge of miners and capital inflows, driving the token to continuous new highs.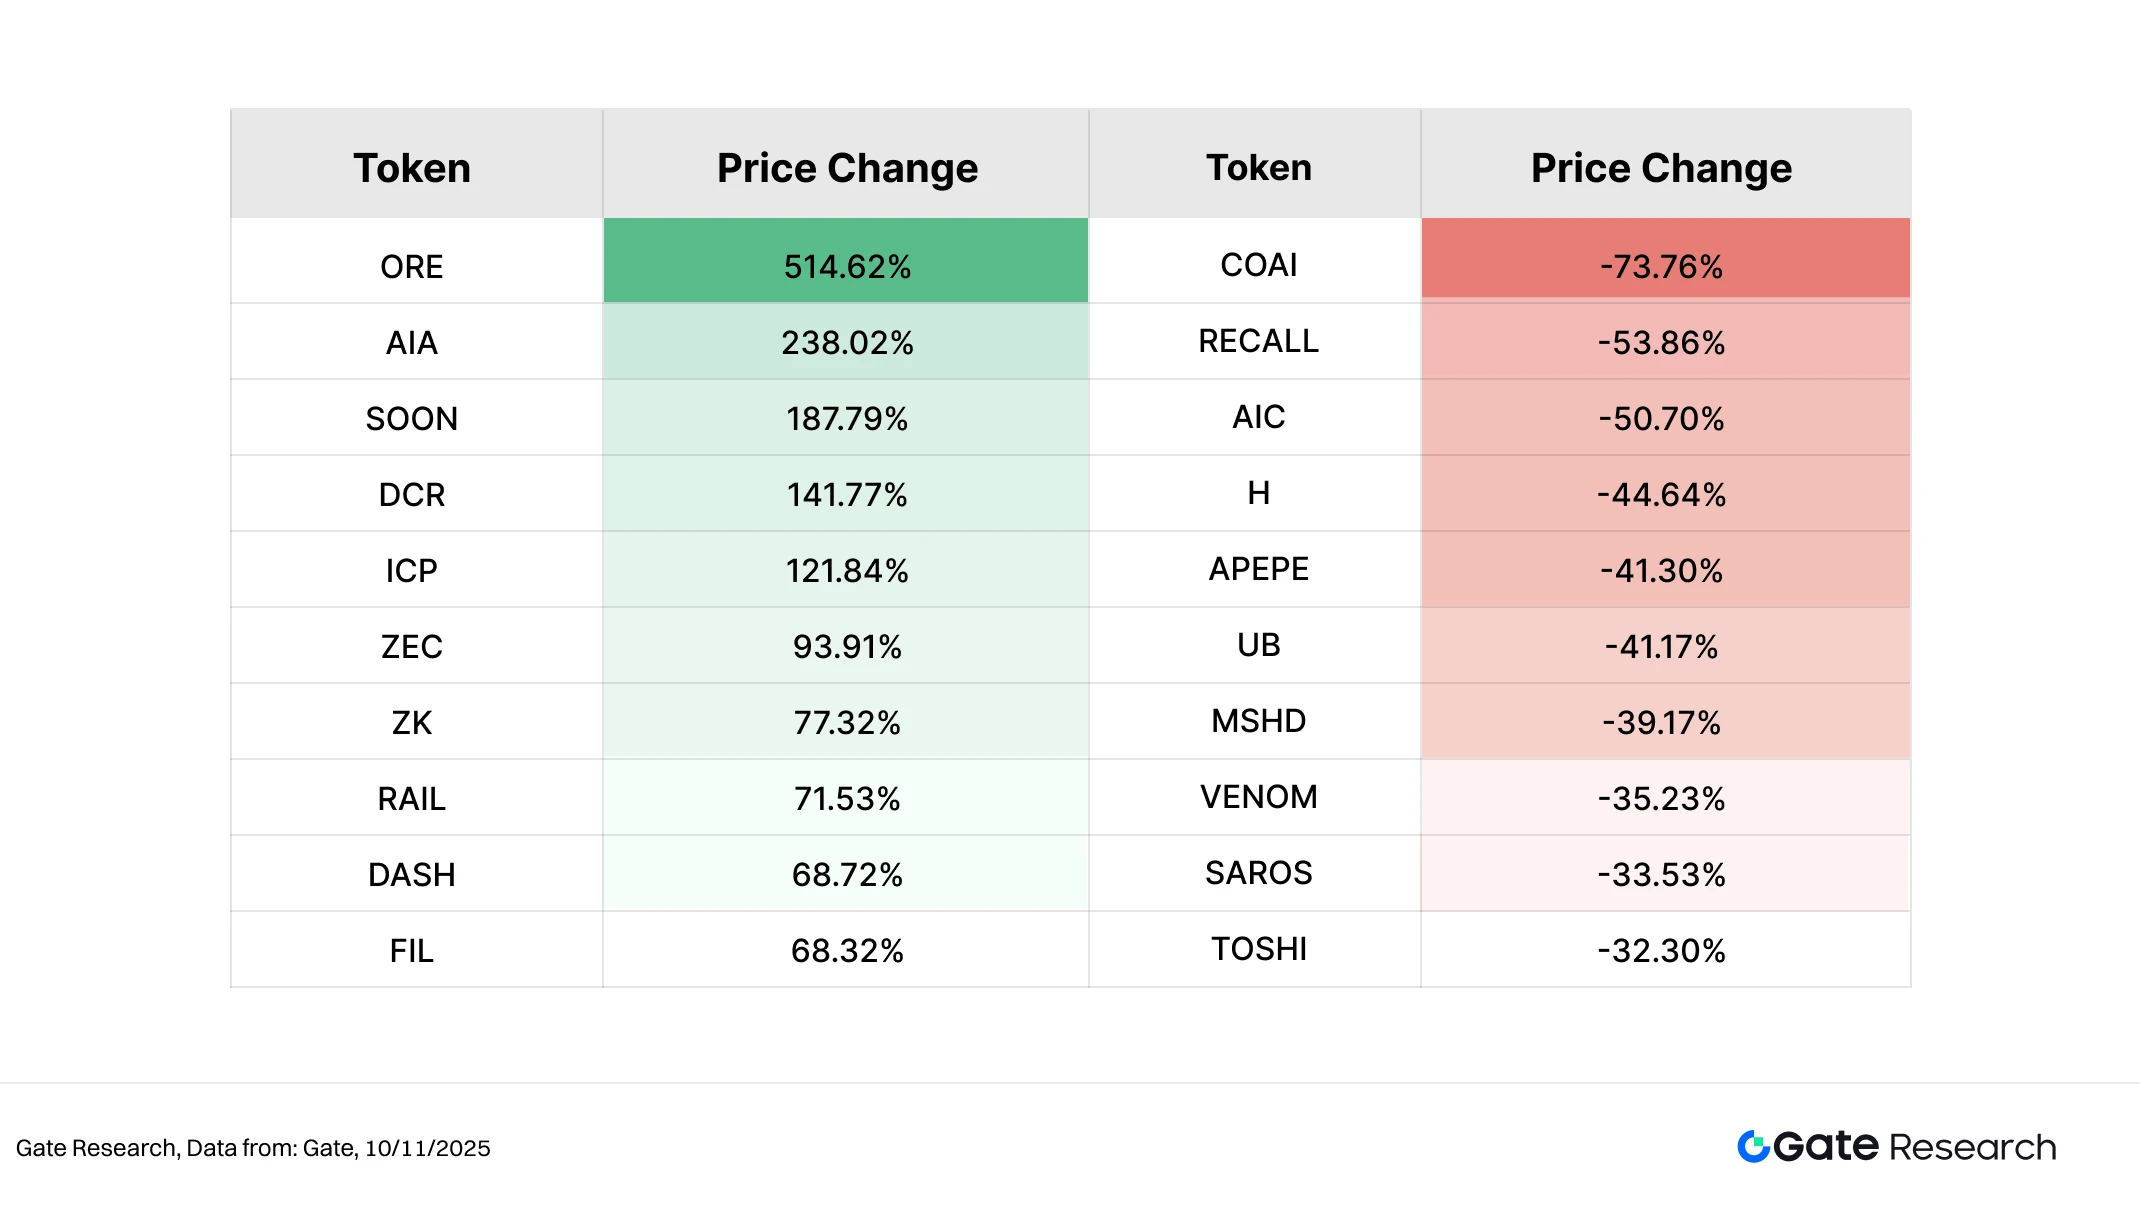
Relationship Between Market Cap Ranking and Price Performance
To analyze the structural characteristics of token performance during this market phase, this study plots a scatter distribution chart of the top 500 tokens by market capitalization. The horizontal axis represents market cap ranking (left = larger market cap), and the vertical axis represents price performance from October 28 to November 10. Each circle represents a token, with green indicating gains and red indicating losses.
From the overall distribution, the number of declining tokens clearly exceeds that of gainers, showing that the market remains in a choppy recovery phase. Most tokens experienced losses in the –10% to –20% range, while tokens with gains exceeding 50% were relatively rare and primarily concentrated in the mid- to lower-market-cap segments. This indicates a market preference for smaller, higher-volatility assets with strong narrative appeal.
Among the top performers, ORE (+514.62%) and AIA (+238.02%) stood out the most, benefiting respectively from rising interest in PoW deflationary models and the AI + Agent narrative. SOON (+187.79%) and DCR (+141.77%) also showed strong performance, suggesting that structural opportunities remained even during a consolidation phase. In contrast, the steepest declines were concentrated in previously overheated or narrative-driven tokens such as COAI (–73.76%), AIC (–50.70%), and RECALL (–53.86%), which corrected sharply after short-term speculative inflows faded.
Overall, the market continues to exhibit structural rotation, with limited volatility among large-cap assets while mid- and small-cap tokens show pronounced fluctuations driven by sentiment and capital flows. Investors display a preference for high-beta, narrative-driven assets, though overall market risk remains elevated — reflecting cautious sentiment and a tendency toward short-term trading.
Figure 3: Among the top 500 tokens by market cap, declining tokens remain the majority, while the biggest gainers cluster in the mid- to lower-market-cap ranges — indicating a capital preference for high-elasticity and narrative-driven assets.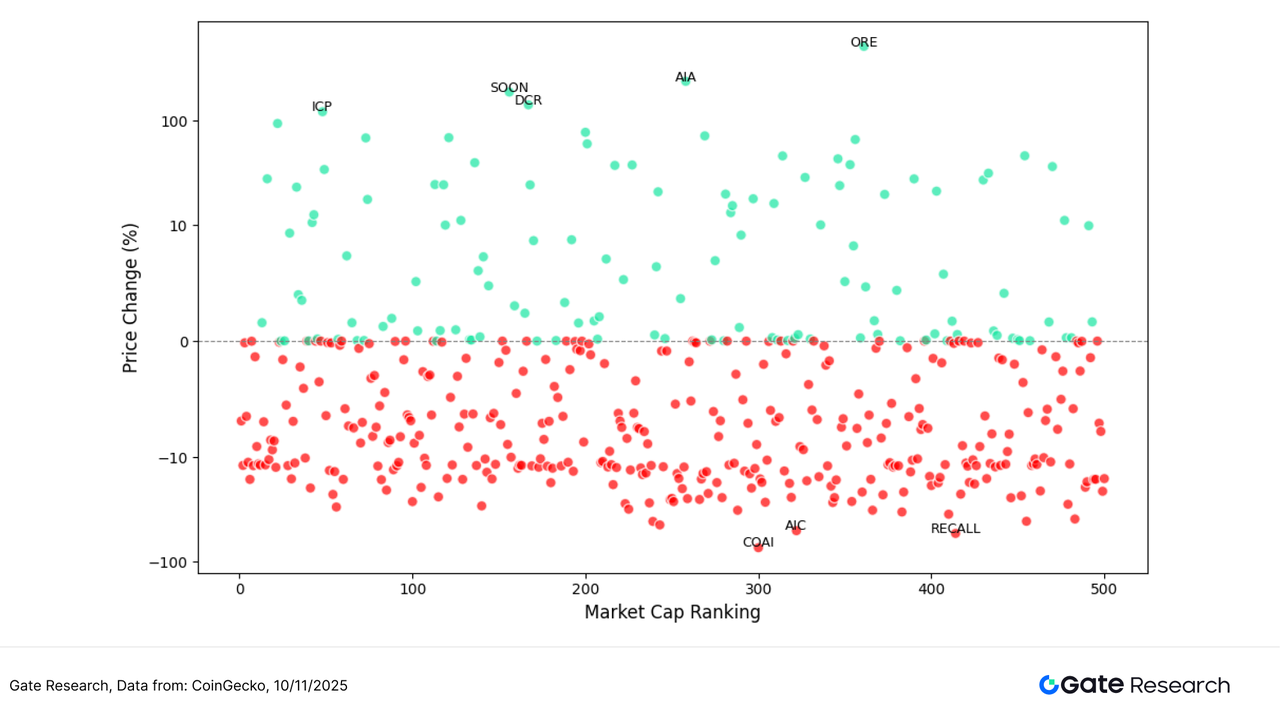
Top 100 Market Cap Leaders
During this phase of market volatility, the top 100 tokens by market capitalization exhibited clear structural divergence. While major assets saw limited fluctuation, several tokens with strong long-term narratives or defensive characteristics outperformed.
On the gainers list, ICP (+121.84%) led the group, supported by ecosystem expansion and rising on-chain activity, which drove notable capital inflows. ZEC (+93.91%) and FIL (+68.32%) followed, continuing the strong momentum of privacy and decentralized storage narratives. NEAR (+34.05%) and WBT (+27.74%) also posted solid gains, underpinned by ecosystem growth and active on-chain development. Overall, the top performers tended to be projects with clear fundamental support and tangible technological progress, reflecting investor preference for tokens with credible long-term growth paths across major L1s and infrastructure.
On the decliners list, ENA (–30.07%) and IP (–26.69%) recorded the largest drops, primarily due to fading speculative hype and capital rotation back into mainstream assets. SOL (–16.35%) and SUI (–16.15%) experienced short-term pullbacks driven by profit-taking, though their overall structures remain relatively strong. PEPE (–13.76%), representing the meme sector, saw heightened volatility as speculative capital activity eased.
Overall, within the top 100, capital favored projects with high certainty in growth and strong technological foundations, while high-beta and narrative-driven tokens experienced more pronounced corrections. After rapid market rotation, investor behavior became increasingly rational, reflecting a temporary decline in risk appetite and renewed preference for high-quality layer-1 and infrastructure assets.
Figure 4: Among the top 100 tokens, ICP, ZEC, and FIL led the gains, while SOL and SUI saw short-term corrections. The market structure shows a pattern of “stable leaders, divergent mid-cap performance.”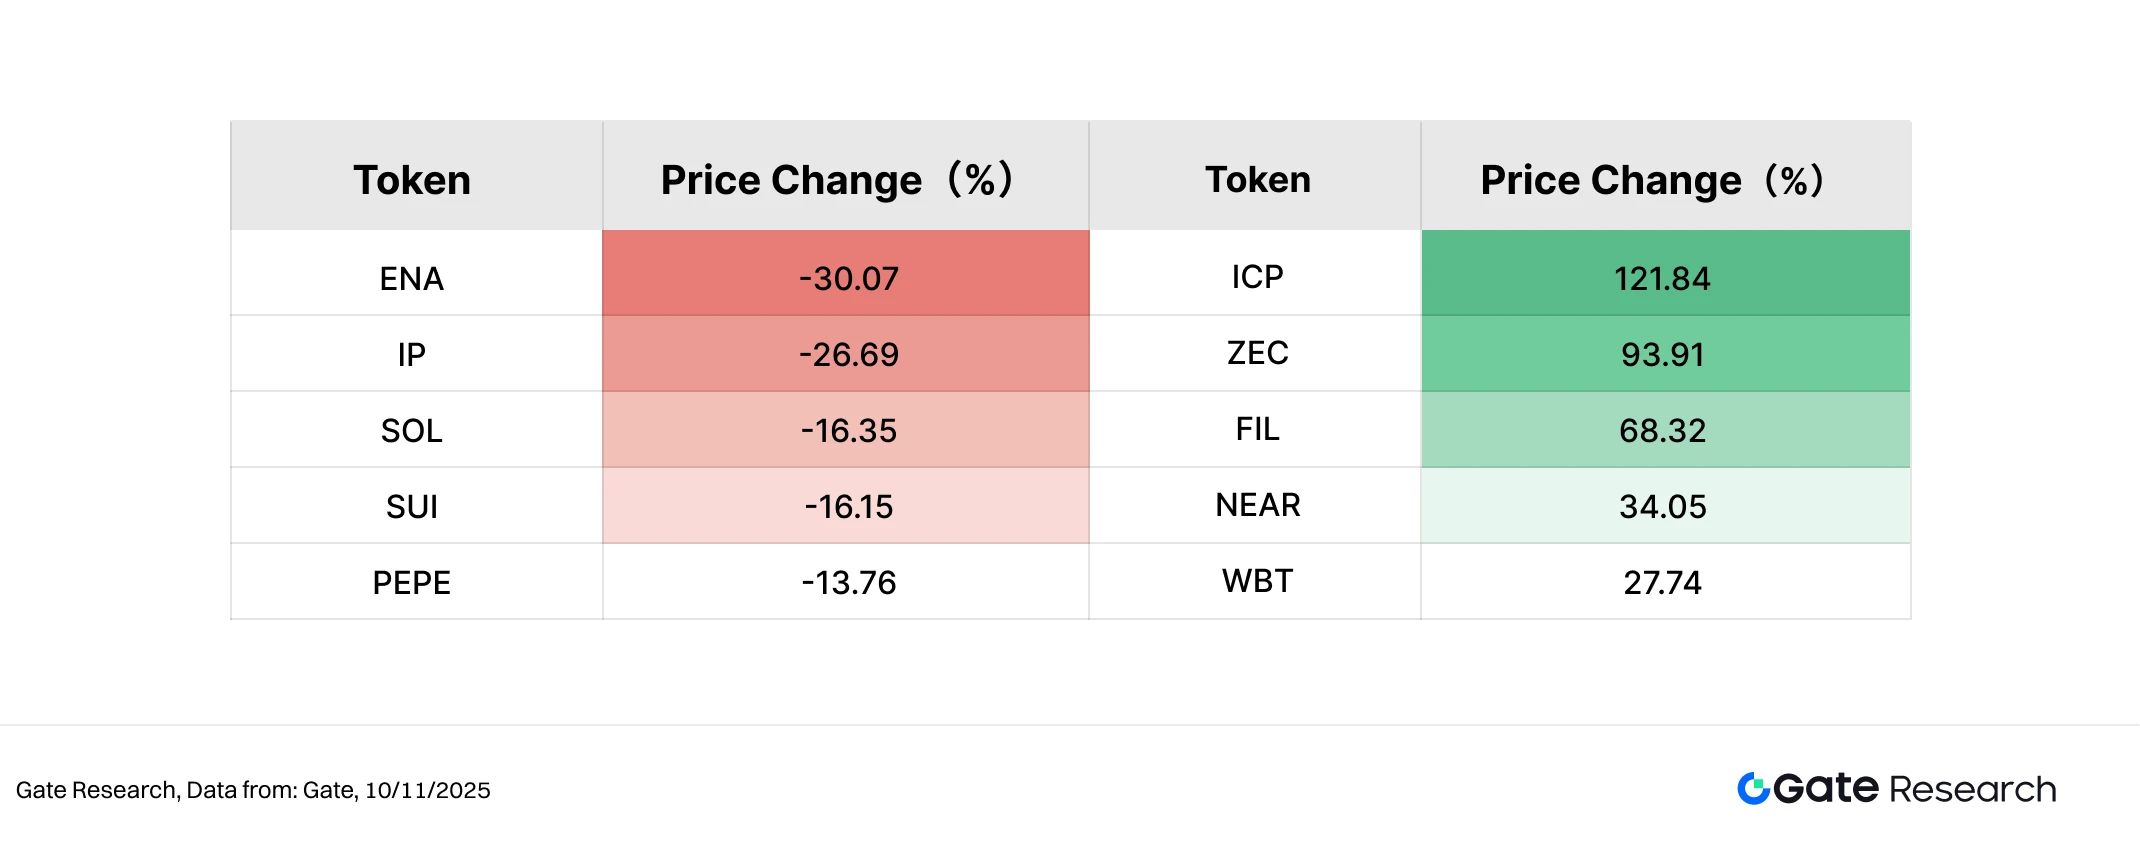
2. Volume Surge Analysis
Trading Volume Growth Analysis
Beyond price performance, this analysis also examines changes in trading volume for selected tokens to assess market activity and capital participation. Using pre-rally trading volume as the baseline, we calculate each token’s volume expansion multiple and compare it with its corresponding price movement to evaluate market attention and short-term capital flows.
The data shows that XAUT, AGENTFUN, ICP, MINA, and ZK recorded the largest increases in trading volume during the period. XAUT saw its volume surge more than 51×, while its price rose modestly by 1.58%, indicating a shift toward defensive asset allocation amid rising risk aversion. AGENTFUN experienced a 24.6× jump in volume but declined 7.19%, reflecting active short-term speculation with insufficient sustained buying. ICP, with volume up 23.99× and price up 121.84%, exhibited strong volume-price confluence, making it one of the best-performing large-cap assets of the period.
The rally in ICP (Internet Computer) was primarily driven by the DFINITY 2.0 strategic upgrade and multiple new technical releases. At the end of October, the team introduced the Chain Fusion framework, enabling ICP smart contracts to natively interact with more than 20 blockchains, including Bitcoin, Ethereum, and Solana. The launch of Caffeine.ai and HTTP Request functionality further enhanced AI-assisted development and cross-chain data access. These upgrades strengthened ICP’s position in the “Web3 cloud computing + AI infrastructure” narrative, drawing renewed interest from both developers and capital.
MINA (+45.93%) and ZK (+77.32%) also posted volume-backed uptrends, reflecting renewed market interest in zero-knowledge (ZK) and lightweight L1 narratives. Overall, the major volume-expanding tokens covered themes ranging from risk-off assets to privacy and infrastructure, indicating significantly increased capital participation. Even for some tokens without strong price appreciation, the notable rise in volume signals growing market attention and the continued brewing of potential capital rotation and narrative catalysts.
Figure 5: XAUT, ICP, ZK and others saw substantial trading-volume expansion this period. ICP, driven by Chain Fusion and DFINITY 2.0 upgrade expectations, achieved strong volume-price confluence, becoming a leading example of capital inflows and rising market activity among large-cap assets.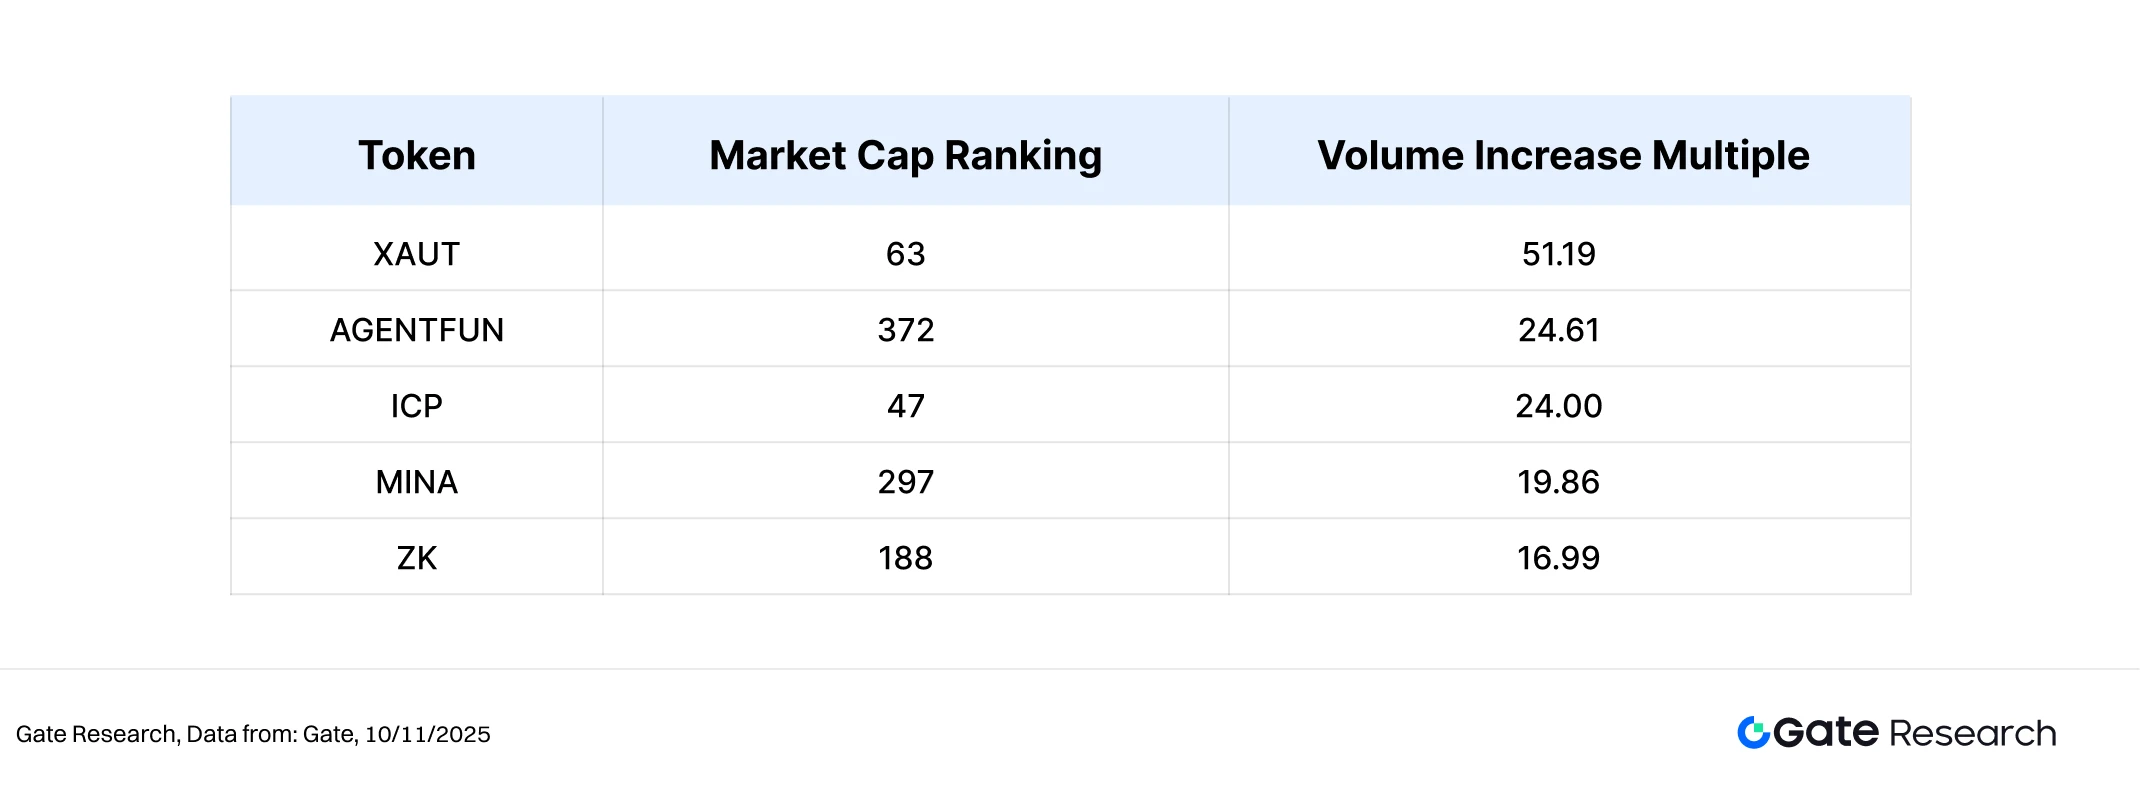
Volume-Price Relationship Analysis
Building on the earlier analysis of volume-anomalous tokens, this study further incorporates price performance to plot a scatter chart of Volume Increase Multiple vs. Price Change (%). The horizontal axis represents the multiple by which a token’s trading volume increased over the past two weeks relative to its baseline period, while the vertical axis shows the corresponding price change. A symmetric log scale is used for both axes to reveal the structural relationship between “volume expansion” and “price movement” more clearly.
From the distribution, the upper-right quadrant clusters tokens that saw significant volume expansion alongside strong price rebounds, indicating that capital is flowing into sectors supported by strong narratives and active trading. ICP, ZK, and MINA all demonstrated clear volume-price confluence, with trading volumes rising approximately 24×, 17×, and 20×, respectively, paired with price gains of 121.84%, 77.32%, and 45.93%. These tokens emerged as leaders of the current structural market rotation. XAUT also registered a 51× surge in volume; although its price rose only 1.58%, the data suggests that risk-off assets continue to attract stable demand in highly volatile conditions.
In contrast, AGENTFUN saw its volume expand by 24.6×, yet its price dropped 7.19%, indicating that capital participation was driven primarily by short-term speculative trading rather than trend formation. Similar “volume without upside” patterns appeared in tokens such as CETH and MEEETH, reflecting a market still dominated by event-driven and narrative rotation dynamics.
Overall, tokens situated in the upper-right quadrant typically possess clear catalysts and strong participation from active capital, making them the dominant force in the current rotation cycle. Meanwhile, the lower-right quadrant signals improving liquidity but insufficient buying momentum. The market remains in a phase where structural recovery and shifting hotspots coexist, with volume-price confluence tokens becoming key focal points for capital.
Figure 6: Tokens such as ICP, ZK, and MINA fall within the upper-right quadrant, showing classic “high-volume, high-price-gain” behavior. AGENTFUN, CETH, and others exhibit significant volume expansion without corresponding price recovery, indicating active short-term trading while a sustained trend has yet to form.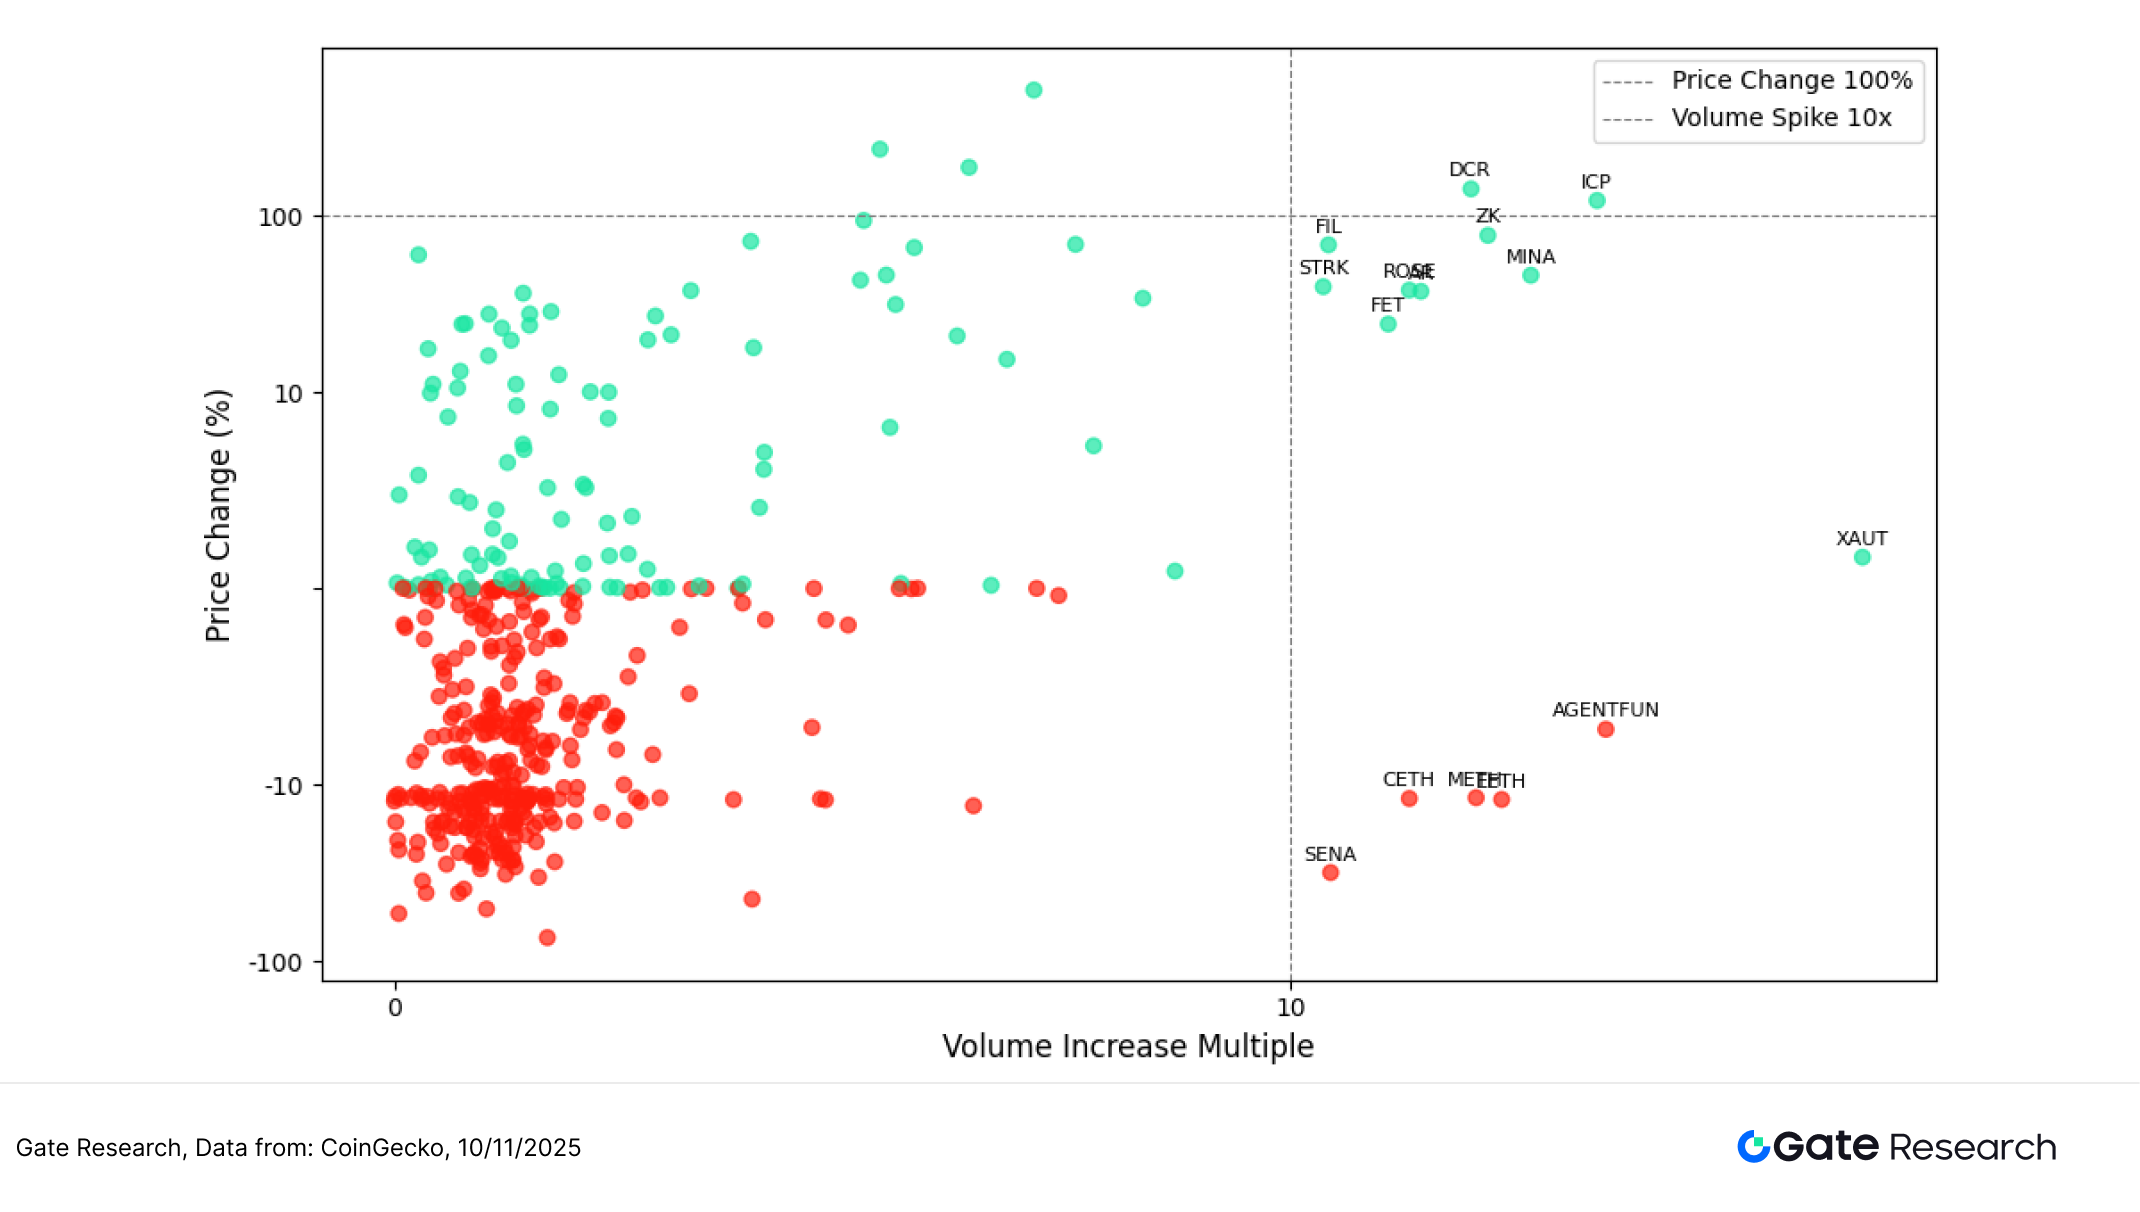
Correlation Analysis
After examining the relationship between trading volume and price performance, this study further analyzes their systemic statistical correlation. To measure how strongly capital activity influences price volatility, we construct a relative activity indicator defined as “volume growth rate / market cap” and calculate its correlation coefficient with price changes. This helps identify which types of tokens in the current market are most sensitive to capital flows.
The chart shows that most tokens cluster within a 0.6–0.8 correlation range, indicating a strong positive relationship and confirming that the market still exhibits a pronounced “higher volume = higher volatility” behavior. The bubble color represents correlation strength (red = higher, blue = lower), and bubble size reflects market-cap scale.
Among the top-correlated assets, COTI (≈0.95), 0G (≈0.82), and FET (≈0.78) stand out, suggesting that AI and data-computation–related tokens are highly sensitive to changes in trading volume — typical high-elasticity, volume-driven tokens. Meanwhile, major public-chain assets such as NEAR, FIL, and ETC fall in the 0.65–0.75 range, showing that volume-price resonance also exists within mainstream assets. In contrast, lighter-weight or privacy-oriented tokens such as MINA, XNO, and ROSE exhibit relatively weaker correlations (around 0.6), indicating that their price movements are more often driven by project-specific developments or news rather than broad liquidity shifts.
Overall, the market displays a clear “correlation stratification” structure:
- AI and data-computation tokens show the strongest volume-price linkage and highest volatility;
- Infrastructure and privacy assets appear more stable, reflecting sustained capital preference for high-elasticity sectors at this stage.
Figure 7: COTI, 0G, and FET exhibit the highest correlation between volume growth rate and market cap, highlighting the high sensitivity of AI and data-computation sectors.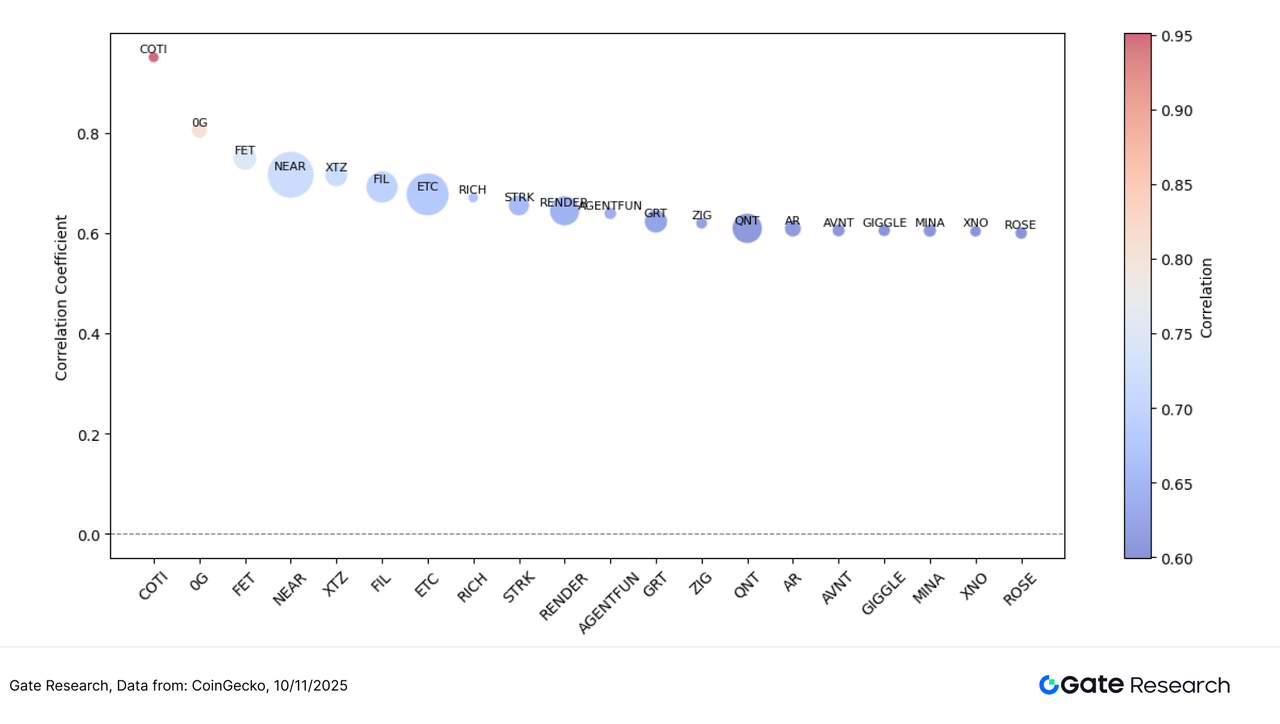
The current crypto market continues to exhibit a structural rotation pattern, with overall sentiment gradually recovering amid volatility and a stronger interplay between trading volume and price action. Mid- and small-cap tokens such as ORE, AIA, and SOON delivered strong rebounds driven by PoW and AI narratives alongside surging trading volumes, becoming focal points for short-term speculative capital. ICP, boosted by the DFINITY 2.0 upgrade and enhanced multi-chain interoperability, showed pronounced volume–price confluence, attracting capital back toward major assets. In contrast, AI-themed tokens such as COAI and AIC, despite substantial early gains, faced increased short-term profit-taking pressure — signaling a shift in capital toward projects with stronger technical fundamentals and sustainable long-term narratives.
Beyond market performance, several potential airdrop opportunities continue to progress across popular sectors including AI, Layer2, social engagement systems, and decentralized identity. With consistent participation and timely interaction, users may secure early positions and qualify for token rewards during this volatile market phase. The following sections outline four key projects worth monitoring and their participation methods to support systematic planning for Web3 airdrop opportunities.
Airdrop Highlights
This article compiles notable early-stage airdrop candidates from October 28 to November 10, 2025, covering projects such as Inference (a distributed AI inference network on Solana Devnet), Arch Network (a Bitcoin Layer2 infrastructure), Spicenet (a social interaction–based points incentive platform), and idOS (a decentralized identity protocol). Users may accumulate contribution records — and potential eligibility for future airdrops or token rewards — by connecting their wallets, running nodes, completing tasks, and participating in community interactions.
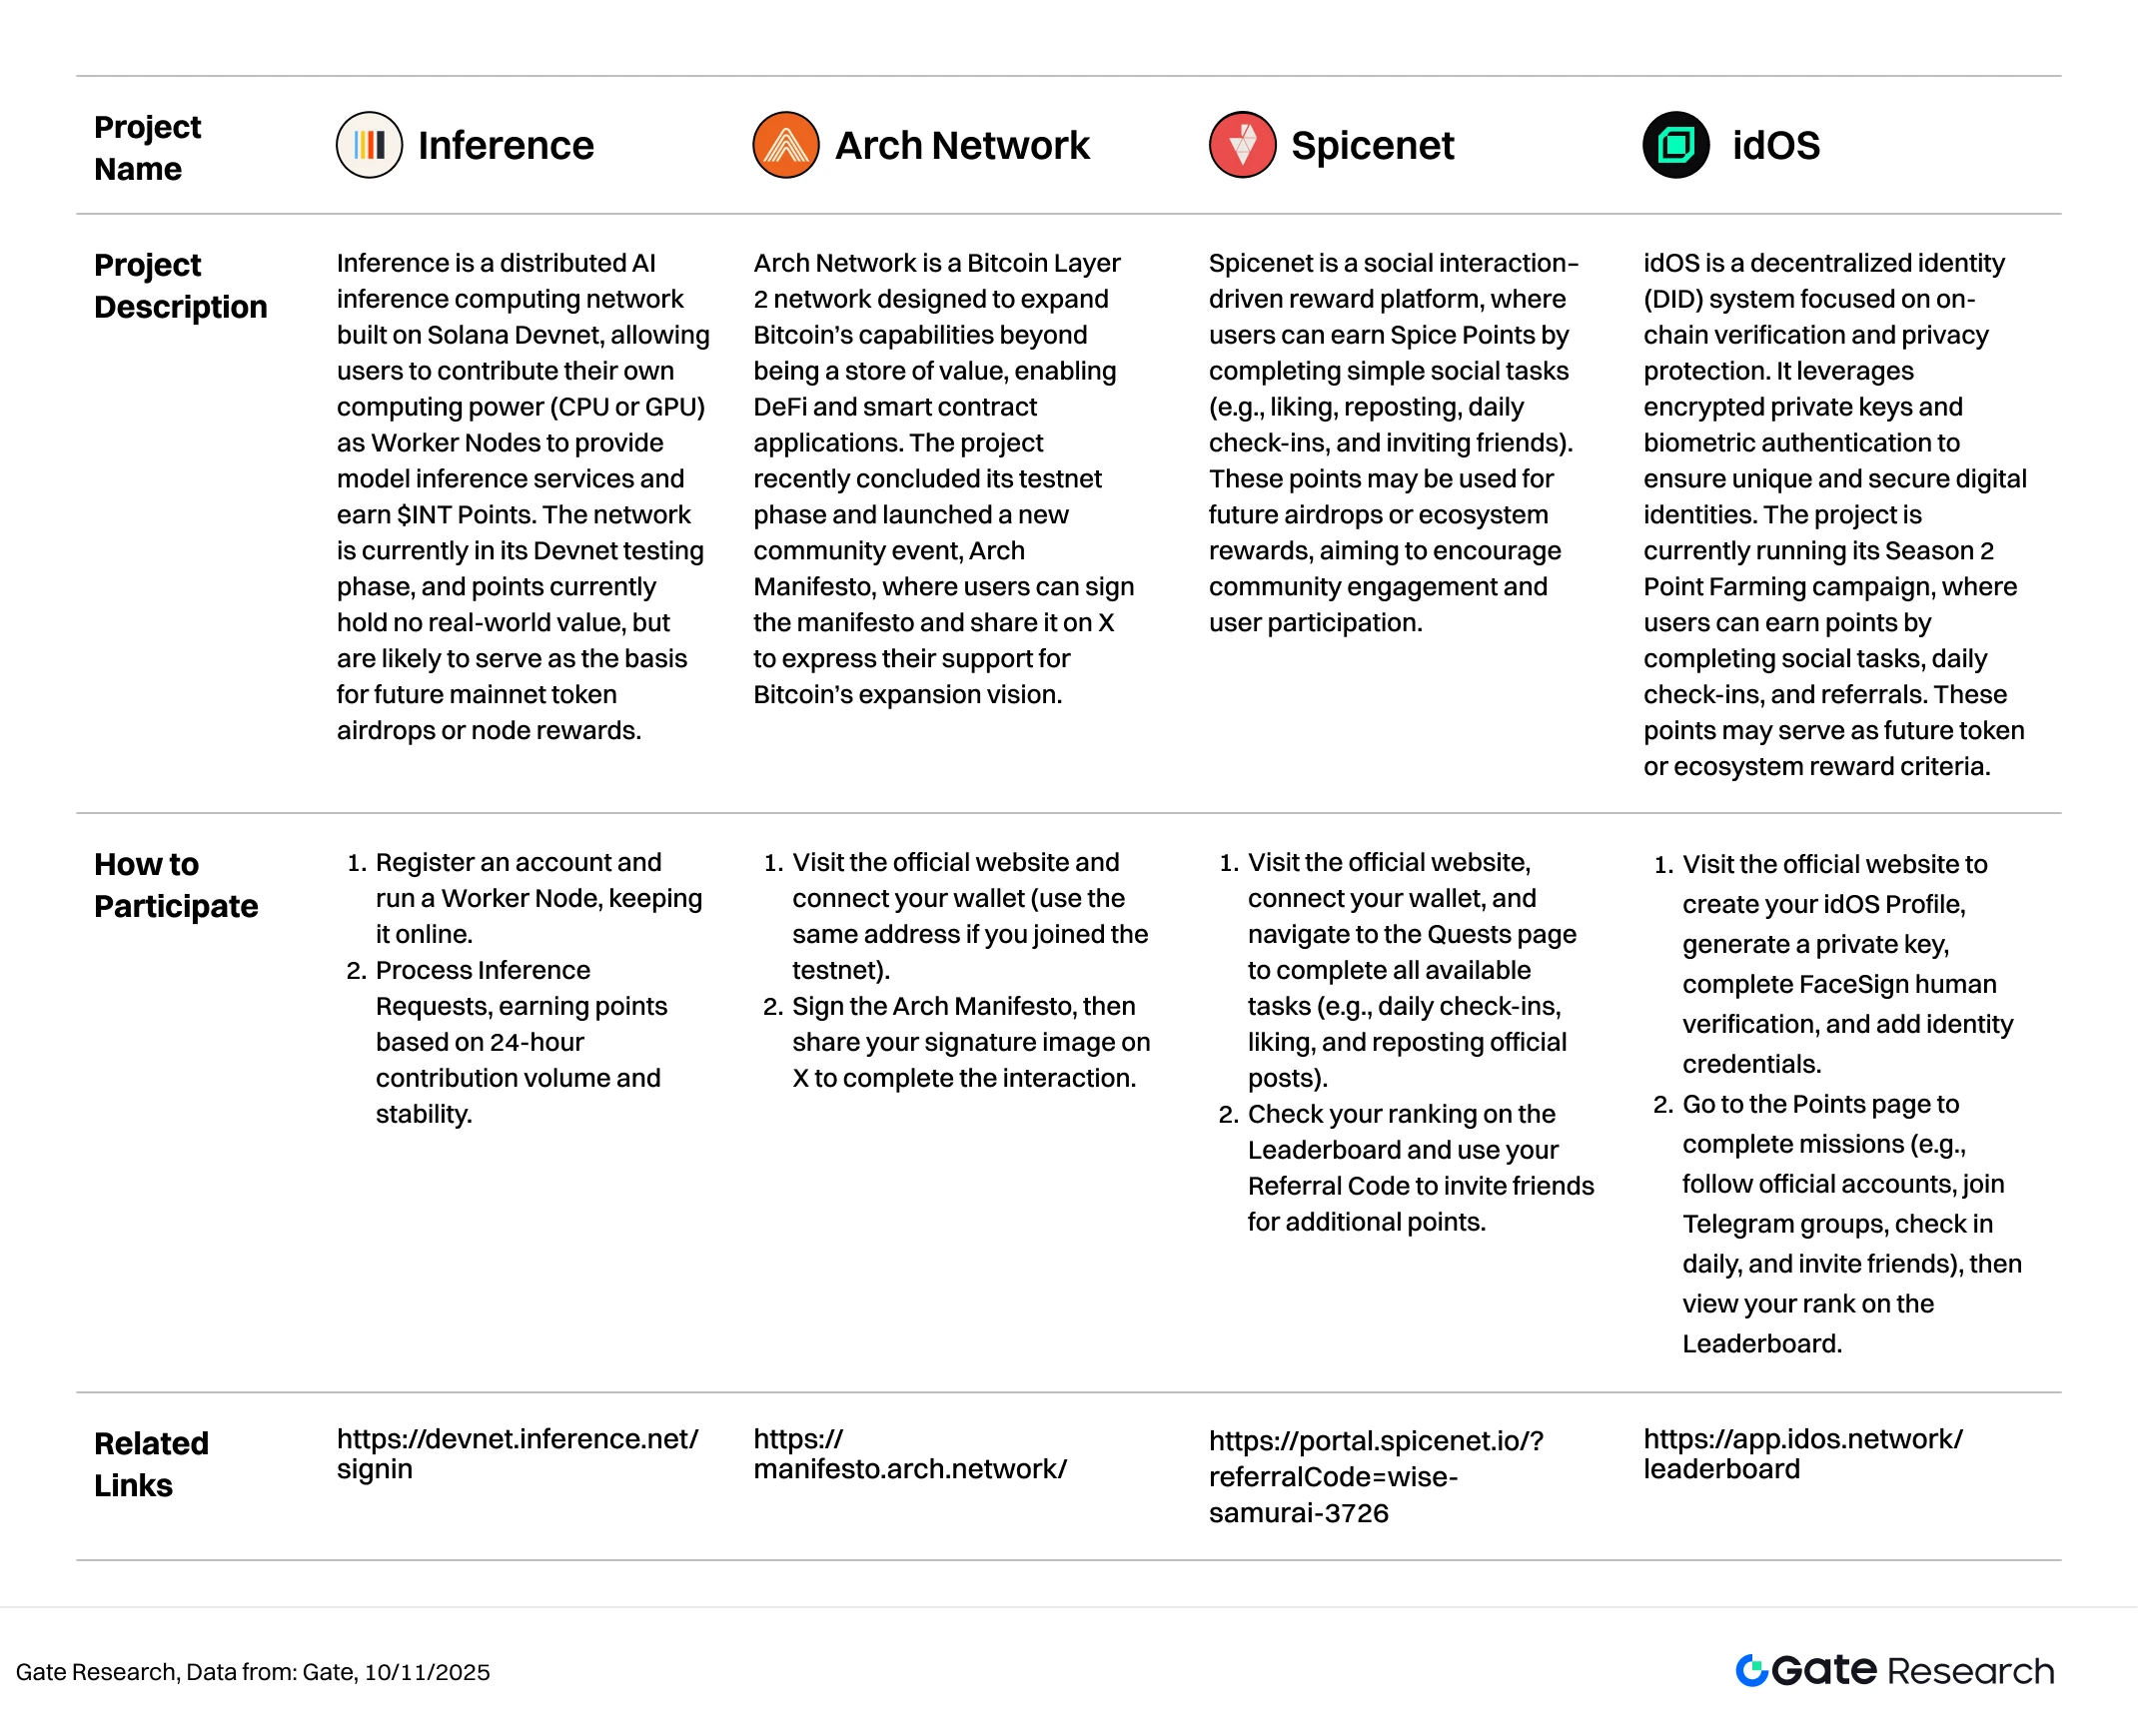
Inference
Inference is a distributed AI inference computing network built on Solana Devnet, allowing users to contribute their own computing power (CPU or GPU) as Worker Nodes to provide model inference services and earn $INT Points. The network is currently in its Devnet testing phase, and points currently hold no real-world value, but are likely to serve as the basis for future mainnet token airdrops or node rewards.【2】
How to Participate:
- Register an account and run a Worker Node, keeping it online.
- Process Inference Requests, earning points based on 24-hour contribution volume and stability.
Arch Network
Arch Network is a Bitcoin Layer 2 network designed to expand Bitcoin’s capabilities beyond being a store of value, enabling DeFi and smart contract applications. The project recently concluded its testnet phase and launched a new community event, Arch Manifesto, where users can sign the manifesto and share it on X to express their support for Bitcoin’s expansion vision.【3】
How to Participate:
- Visit the official website and connect your wallet (use the same address if you joined the testnet).
- Sign the Arch Manifesto, then share your signature image on X to complete the interaction.
Spicenet
Spicenet is a social interaction–driven reward platform, where users can earn Spice Points by completing simple social tasks (e.g., liking, reposting, daily check-ins, and inviting friends). These points may be used for future airdrops or ecosystem rewards, aiming to encourage community engagement and user participation.【4】
How to Participate:
- Visit the official website, connect your wallet, and navigate to the Quests page to complete all available tasks (e.g., daily check-ins, liking, and reposting official posts).
- Check your ranking on the Leaderboard and use your Referral Code to invite friends for additional points.
idOS
idOS is a decentralized identity (DID) system focused on on-chain verification and privacy protection.【5】 It leverages encrypted private keys and biometric authentication to ensure unique and secure digital identities. The project is currently running its Season 2 Point Farming campaign, where users can earn points by completing social tasks, daily check-ins, and referrals. These points may serve as future token or ecosystem reward criteria.
How to Participate:
- Visit the official website to create your idOS Profile, generate a private key, complete FaceSign human verification, and add identity credentials.
- Go to the Points page to complete missions (e.g., follow official accounts, join Telegram groups, check in daily, and invite friends), then view your rank on the Leaderboard.
Reminder
Airdrop plans and participation methods are subject to change at any time. Therefore, it is recommended that users follow the official channels of the above projects for the latest updates. Additionally, users should exercise caution, be aware of the risks, and conduct thorough research before participating. Gate does not guarantee the distribution of subsequent airdrop rewards.
Conclusion
Between October 28 and November 10, 2025, the crypto market continued its rotation-driven structure. After a series of declines, BTC rebounded on November 8, climbing back above $105,800, while ETH similarly recovered to above $3,630. PoW and AI narratives emerged as the primary drivers of this cycle: ORE surged 514.62%, boosted by its deflationary mining model and store-of-value (SoV) narrative; AIA and SOON gained +238.02% and +187.79%, respectively, as the “AI + Agent” narrative and new-application themes attracted concentrated short-term inflows. Privacy and base-layer projects such as ICP, ZEC, and FIL also advanced, forming a dual momentum structure of “infrastructure + narrative-driven” performance. In contrast, short-lived narrative tokens such as COAI and RECALL led the declines, reflecting capital rotation back toward assets with stronger long-term growth logic.
In addition, the tracked projects Inference, Arch Network, Spicenet, and idOS were all in active incentive phases. These initiatives focus respectively on AI compute networks, Bitcoin Layer2 expansion, social points systems, and on-chain identity verification—offering complementary ecosystem positioning with clear incentive paths. Users may participate according to the characteristics of each project to accumulate points and increase potential airdrop eligibility. It is recommended to monitor official updates and task schedules to seize early-stage reward opportunities.
Reference:
- CoinGecko, https://www.coingecko.com/
- Inference, https://devnet.inference.net/signin
- Arch Network, https://manifesto.arch.network/
- Spicenet, https://portal.spicenet.io/?referralCode=wise-samurai-3726
- idOS, https://app.idos.network/leaderboard
Gate Research is a comprehensive blockchain and cryptocurrency research platform that provides deep content for readers, including technical analysis, market insights, industry research, trend forecasting, and macroeconomic policy analysis.
Disclaimer
Investing in cryptocurrency markets involves high risk. Users are advised to conduct their own research and fully understand the nature of the assets and products before making any investment decisions. Gate is not responsible for any losses or damages arising from such decisions.
Share
Content


Related Articles

12 Best Sites to Hunt Crypto Airdrops in 2025

Top 20 Crypto Airdrops in 2025

Gate Research: 2024 Cryptocurrency Market Review and 2025 Trend Forecast

Perpetual Contract Funding Rate Arbitrage Strategy in 2025

Gate Research: BTC Breaks $100K Milestone, November Crypto Trading Volume Exceeds $10 Trillion For First Time
