Ethereum Classic (ETC) has officially joined the list of cryptocurrencies recording double-digit growth, pushing its value to around $9.03 at the time of writing.
This fresh upward momentum has attracted significant market attention and prompted a shift of investment flows into this altcoin. General market analysis indicates that the bullish trend may continue, but this largely depends on whether investor demand and capital flows remain stable.
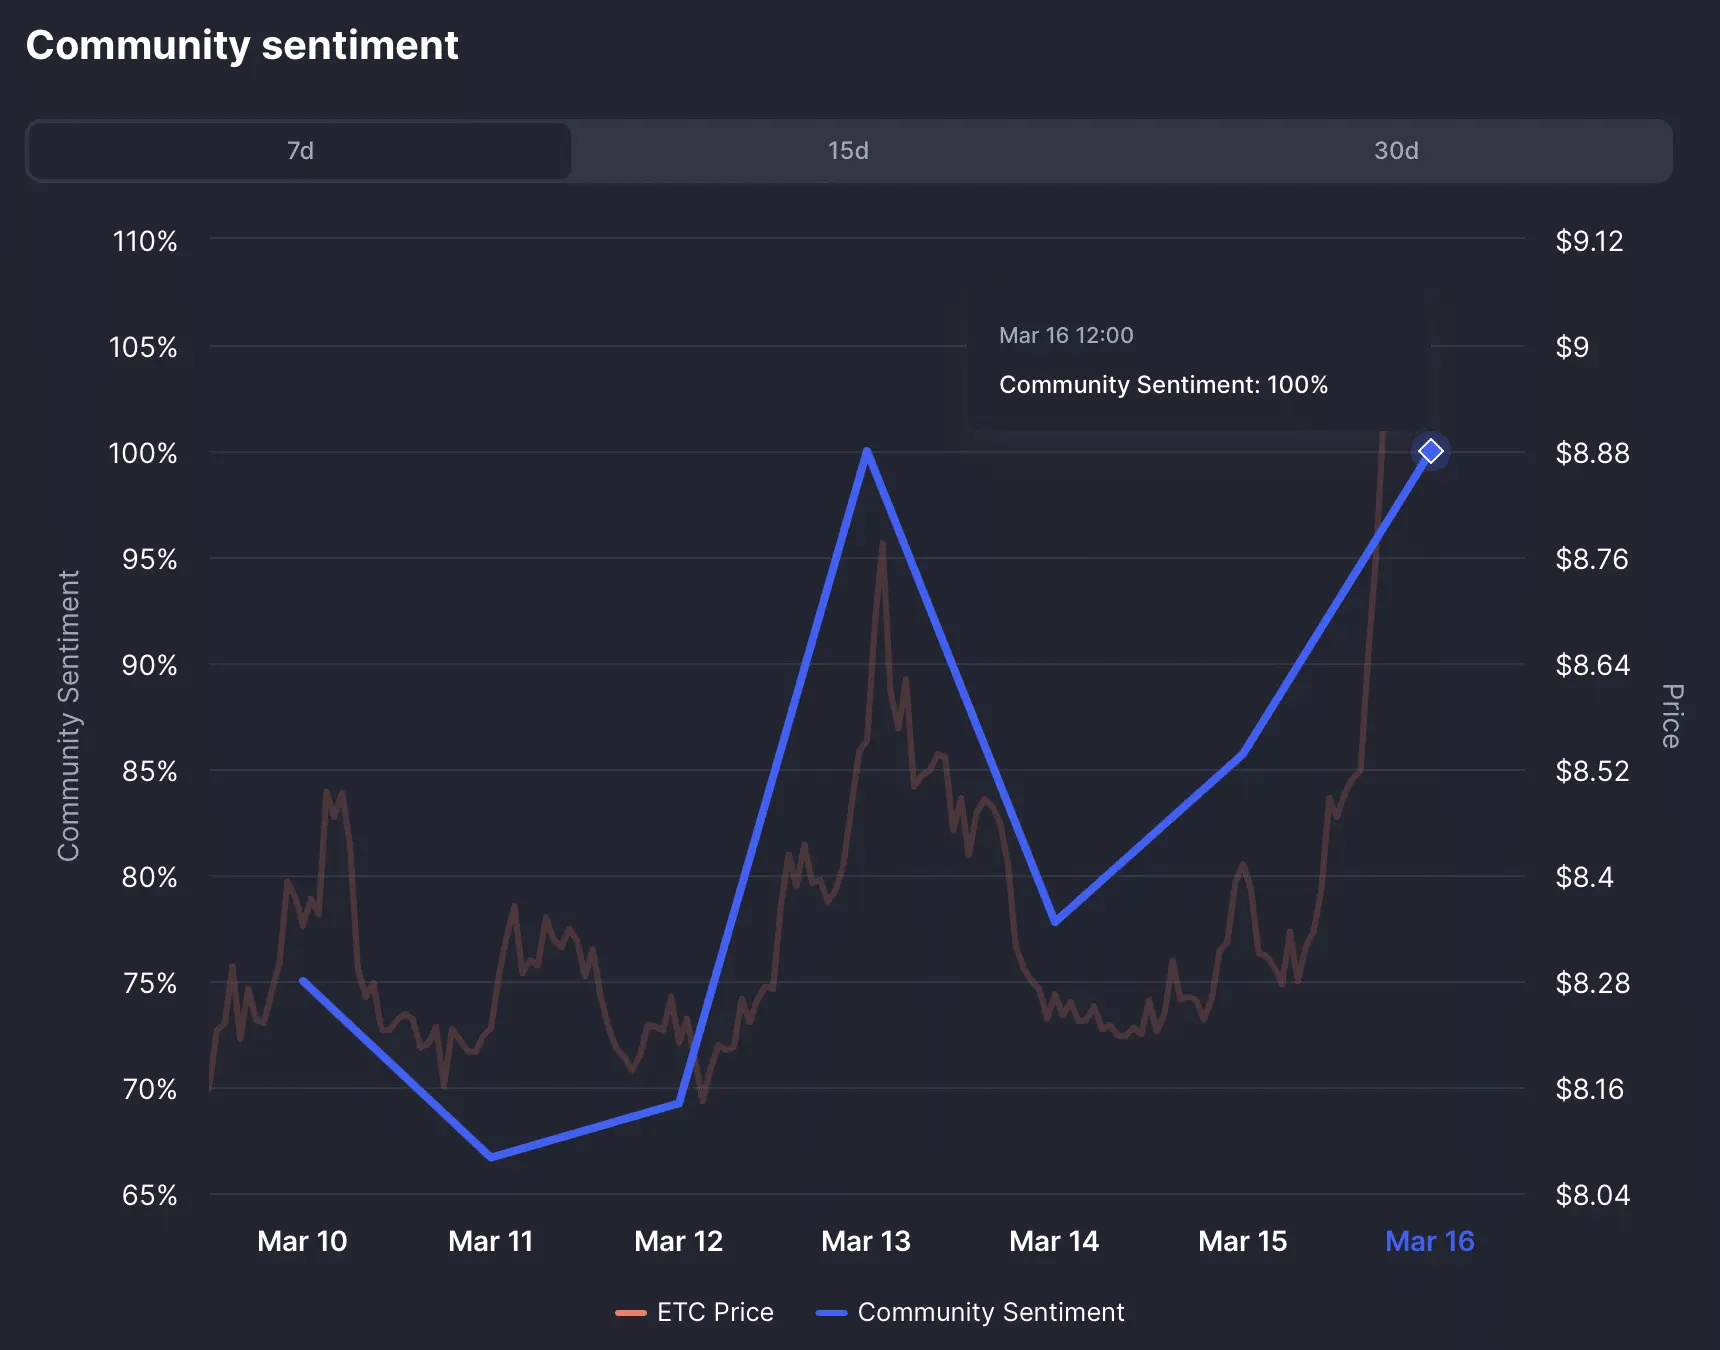
Currently, sentiment indicators show that traders remain optimistic as the price rally gradually takes shape.
Growing Investor Interest
Data from CoinMarketCap shows a significant increase in investor interest in ETC. Sentiment indicators, based on community votes assessing investor mood—whether optimistic or pessimistic—indicate that 100% of approximately 4.3 million participants expect ETC’s price to continue rising.
Additionally, Google search data also shows a gradual increase in public interest. According to Google Trends, searches related to Ethereum Classic’s token symbol have risen by 10 points, from 32 on March 15—the lowest level recorded this year.
 Source: CoinMarketCap Although this increase is modest, if the upward trend in search activity persists, it could attract greater market attention. History has shown that when an asset gains widespread attention, it often coincides with increased investment flows, as more traders begin monitoring and participating in the asset’s price movements.
Breakthrough Opens Opportunities for Higher Targets
According to analysis from Coinphoton, ETC’s current rally could continue if the current momentum is maintained. Based on the chart structure that ETC has just broken, forecasts suggest the price could increase by 11% to 30%.
Specifically, ETC’s current price structure resembles an accumulation pattern—where the price moves within a narrow range defined by a horizontal support line and a descending resistance line. These models typically reflect a consolidation phase before a breakout, leading to a reset of the initial price level of the pattern.
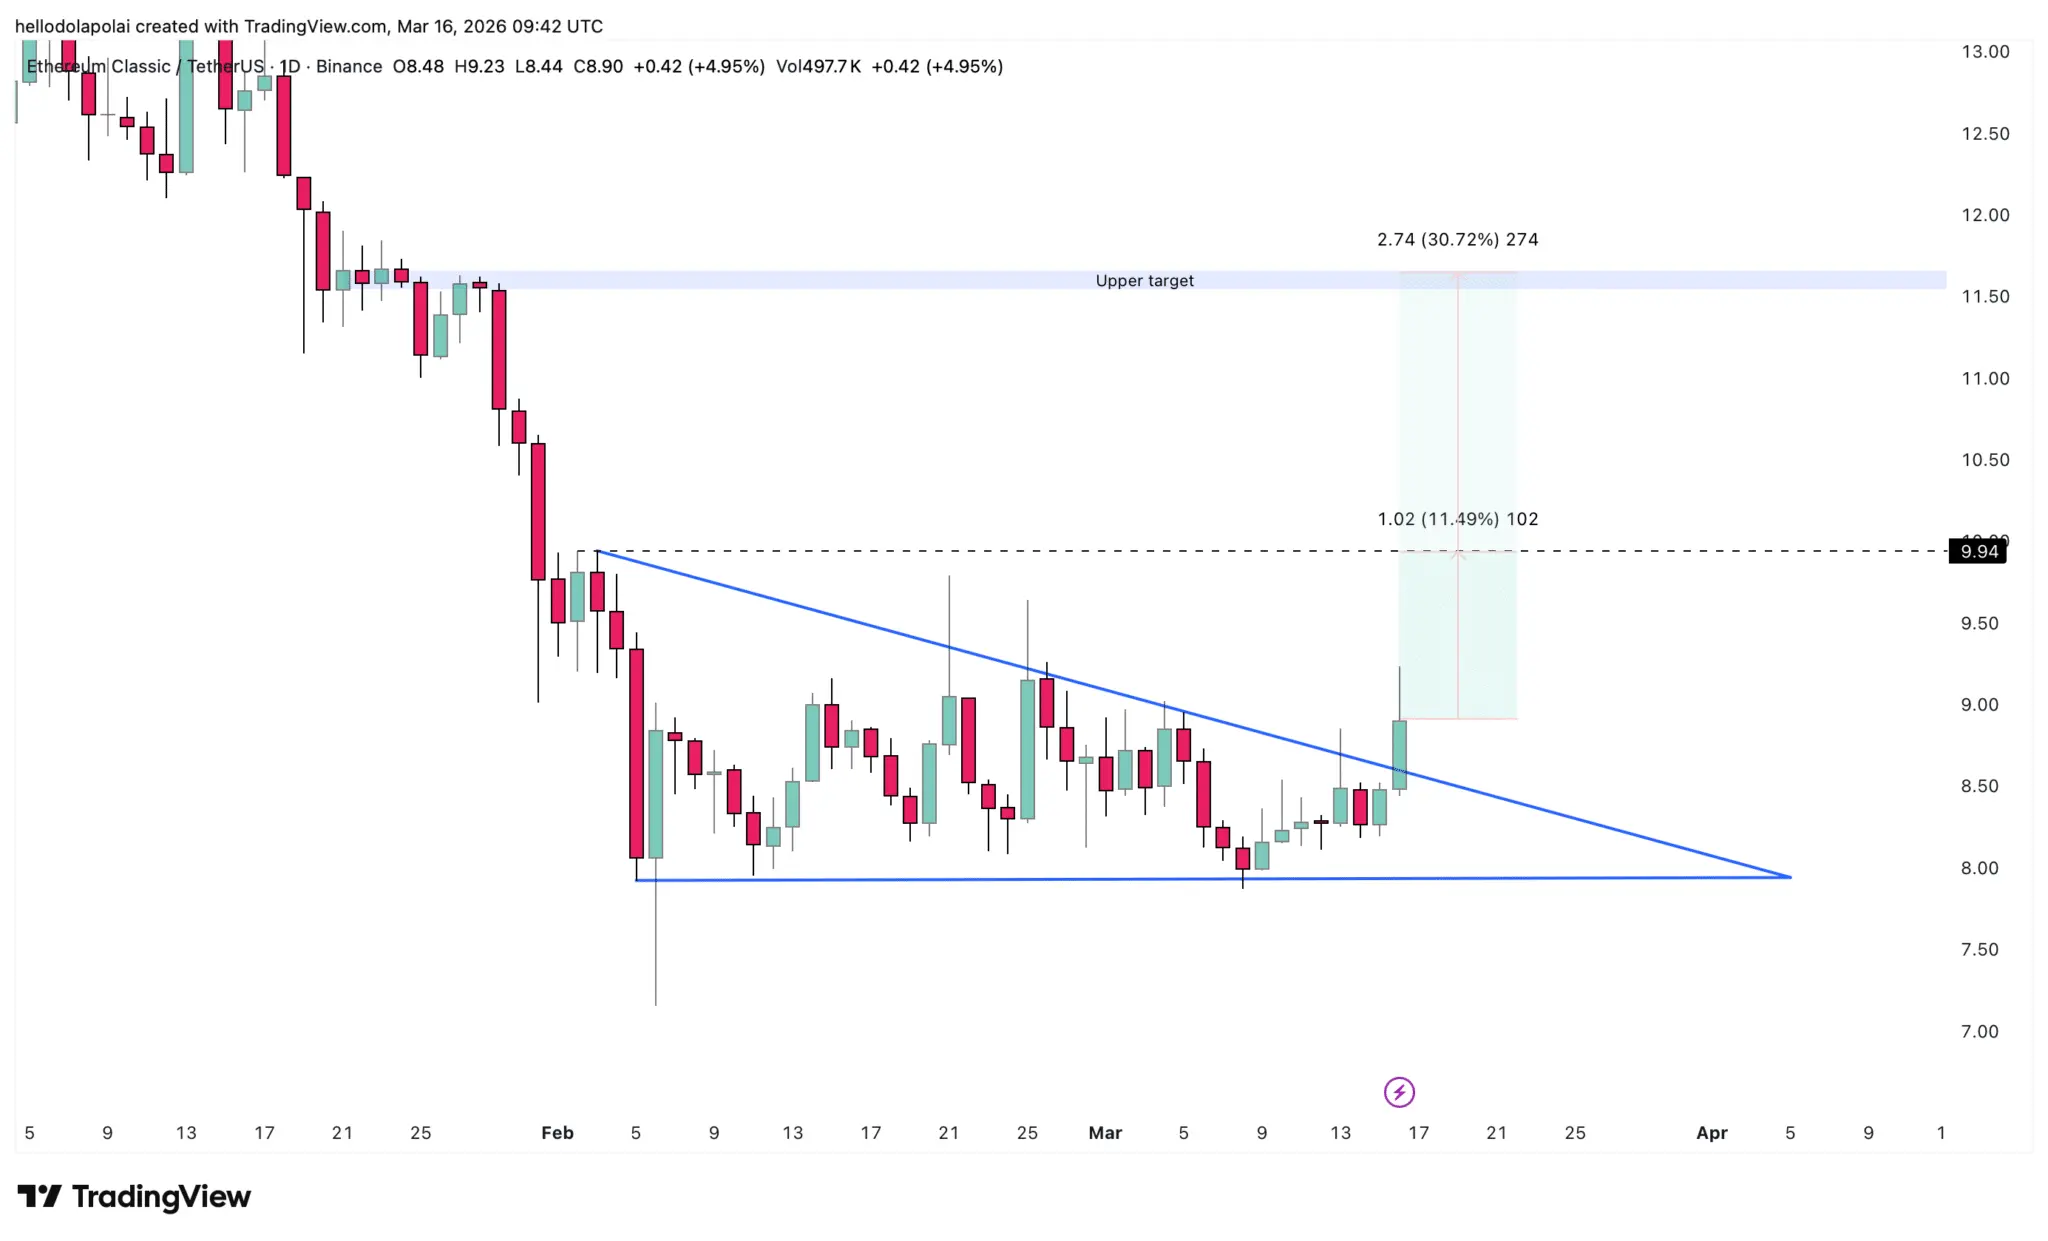 Source: TradingView The gap between ETC’s current price and the start point of this structure is estimated to offer an additional growth potential of about 11%. If it can break through the next resistance level at $11.66, the bullish momentum may continue, with potential gains of up to 30% from current levels, according to chart forecasts.
However, if the breakout momentum cannot be sustained, this scenario could reverse. In that case, ETC’s price might fall back into its previous trading range, especially amid weakening overall market sentiment.
Technical Indicators Confirm Growth Momentum
Several technical indicators currently suggest the market may be poised for further advances.
The MACD (Moving Average Convergence Divergence), which measures momentum changes, is showing increasing buying pressure through consecutive rising bars. If the MACD line (blue) crosses above the signal line (orange) clearly in positive territory, it would confirm that bullish momentum is strengthening and could support a more robust rally.
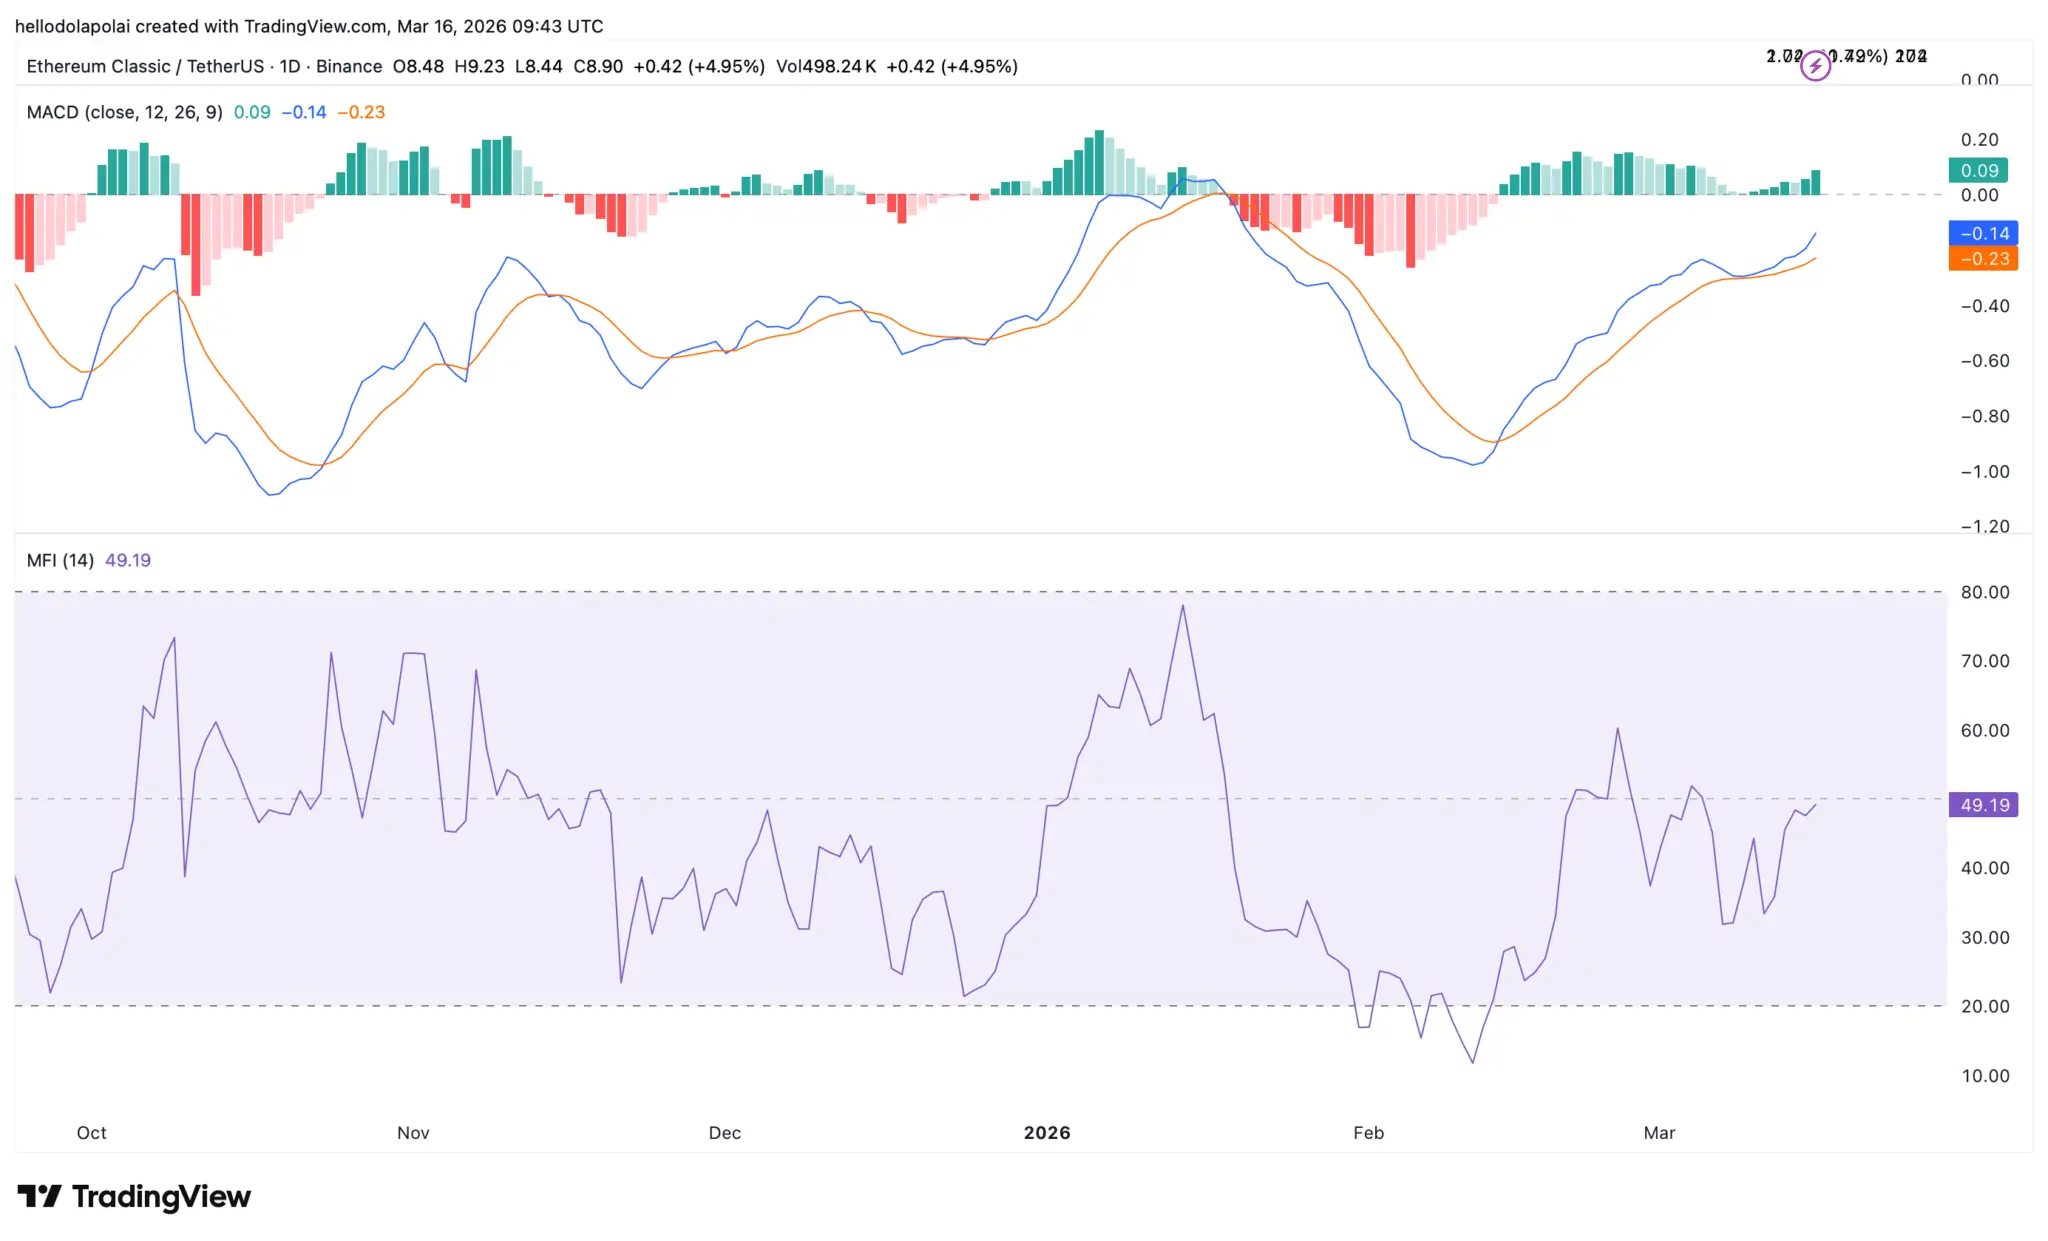 Source: TradingView Meanwhile, the MFI (Money Flow Index), which tracks capital inflows and outflows, is also trending upward. However, it remains below the 50 threshold—often seen as a sign of strong buying pressure. If the MFI surpasses this level, it would indicate that investors are increasing capital allocation into ETC, further fueling the current rally.
At present, ETC’s upward trend continues, but the sustainability of this trend will heavily depend on whether capital flows and market sentiment remain supportive.
Disclaimer: The information on this page may come from third parties and does not represent the views or opinions of Gate. The content displayed on this page is for reference only and does not constitute any financial, investment, or legal advice. Gate does not guarantee the accuracy or completeness of the information and shall not be liable for any losses arising from the use of this information. Virtual asset investments carry high risks and are subject to significant price volatility. You may lose all of your invested principal. Please fully understand the relevant risks and make prudent decisions based on your own financial situation and risk tolerance. For details, please refer to
Disclaimer.
