Trade
Basic
Futures
Futures
Hundreds of contracts settled in USDT or BTC
TradFi
Gold
Trade global traditional assets with USDT in one place
Options
Hot
Trade European-style vanilla options
Unified Account
Maximize your capital efficiency
Demo Trading
Futures Kickoff
Get prepared for your futures trading
Futures Events
Participate in events to win generous rewards
Demo Trading
Use virtual funds to experience risk-free trading
Earn
Launch
CandyDrop
Collect candies to earn airdrops
Launchpool
Quick staking, earn potential new tokens
HODLer Airdrop
Hold GT and get massive airdrops for free
Launchpad
Be early to the next big token project
Alpha Points
Trade on-chain assets and enjoy airdrop rewards!
Futures Points
Earn futures points and claim airdrop rewards
Investment
Simple Earn
Earn interests with idle tokens
Auto-Invest
Auto-invest on a regular basis
Dual Investment
Buy low and sell high to take profits from price fluctuations
Soft Staking
Earn rewards with flexible staking
Crypto Loan
0 Fees
Pledge one crypto to borrow another
Lending Center
One-stop lending hub
VIP Wealth Hub
Customized wealth management empowers your assets growth
Private Wealth Management
Customized asset management to grow your digital assets
Quant Fund
Top asset management team helps you profit without hassle
Staking
Stake cryptos to earn in PoS products
Smart Leverage
New
No forced liquidation before maturity, worry-free leveraged gains
GUSD Minting
Use USDT/USDC to mint GUSD for treasury-level yields
More
INVESTERCLUB
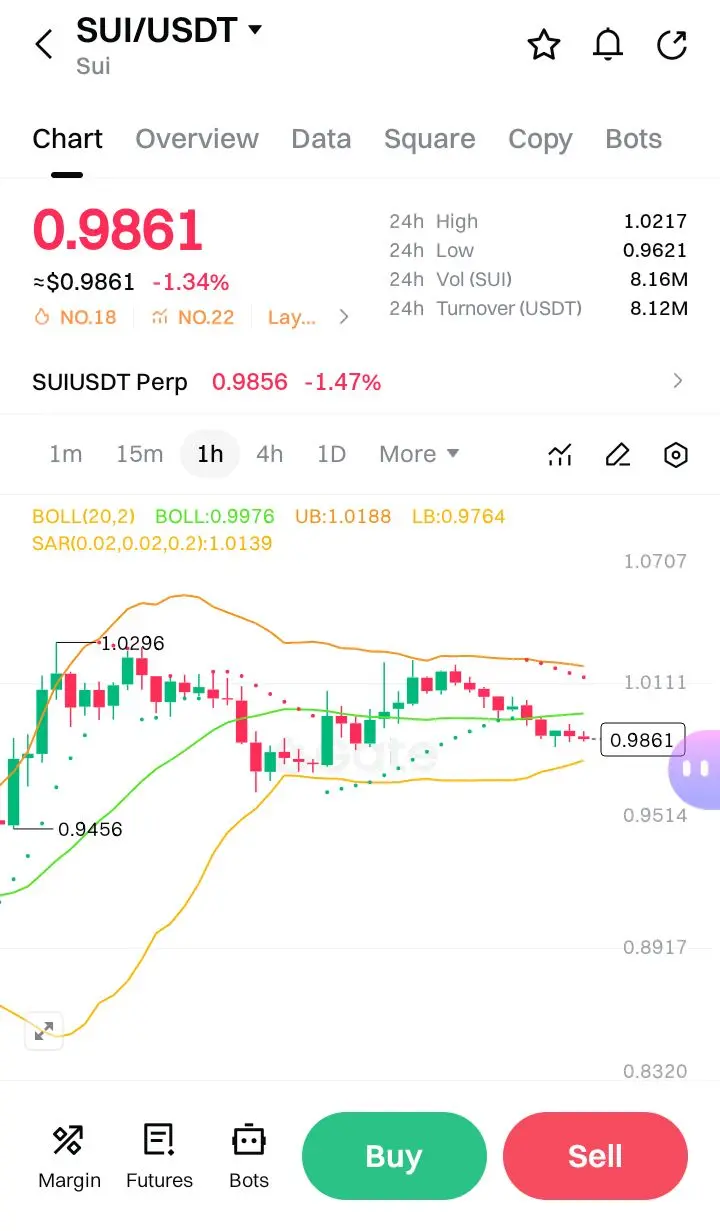
$SUI #CryptoSurvivalGuide
Multi-timeframe Analysis of the SUI/USDT market and formulate a trade plan using the Gap Retest Strategy. The data shows different technical indicator values, implying the charts are from various timeframes (e.g. 1H, 4H).
In-Depth K-Line & Market Situation Analysis
1. Overall Market Context (Higher Timeframe - Likely 4H/1D):
· Trend: The price is in a clear short-term downtrend. This is confirmed by:
· The Parabolic SAR (SAR) dots are above the price candle on all visible charts, indicating a bearish trend.
· The price is consistently trading at or below the midd
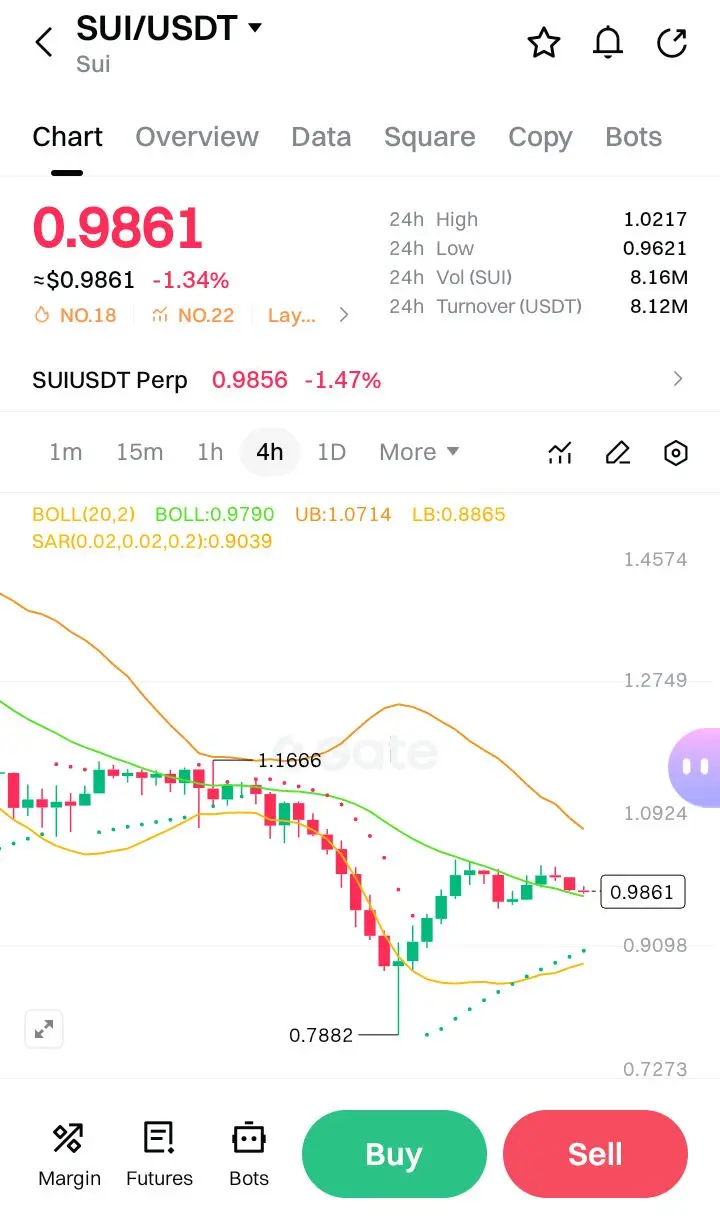
SUI0,54%
- Reward
- 1
- Comment
- Repost
- Share
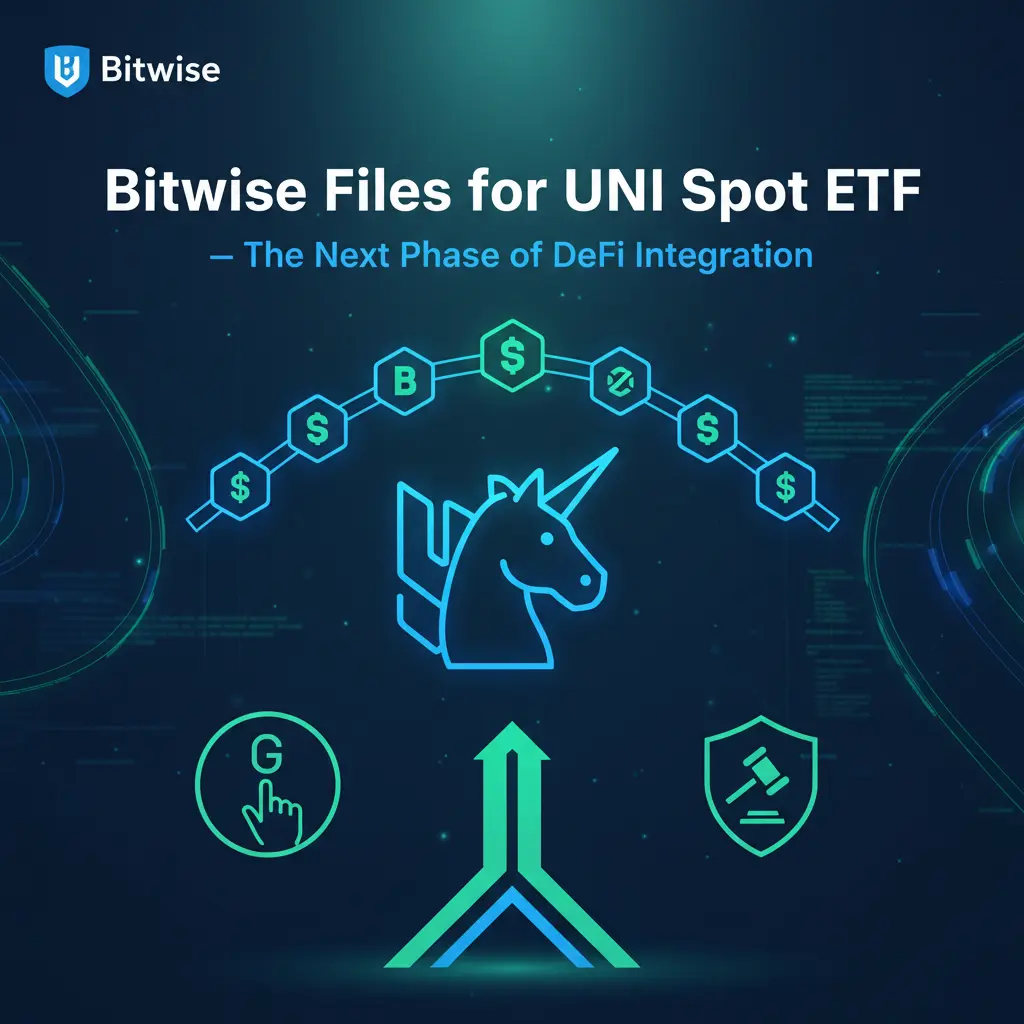
Bitwise Files for a UNI Spot ETF — A Signal of DeFi’s Next Phase
Bitwise Asset Management’s renewed filing for a Uniswap (UNI) Spot ETF in early 2026 represents far more than another regulatory application. It marks a broader shift in how Decentralized Finance (DeFi) is being evaluated by regulators, institutions, and market architects.
This filing arrives at a moment when the regulatory environment has evolved from hesitation to structured engagement. Policymakers are increasingly focused on transparency, liquidity standards, custody frameworks, and investor protection—creating conditions whe
- Reward
- 1
- 3
- Repost
- Share
AYATTAC:
Buy To Earn 💎View More
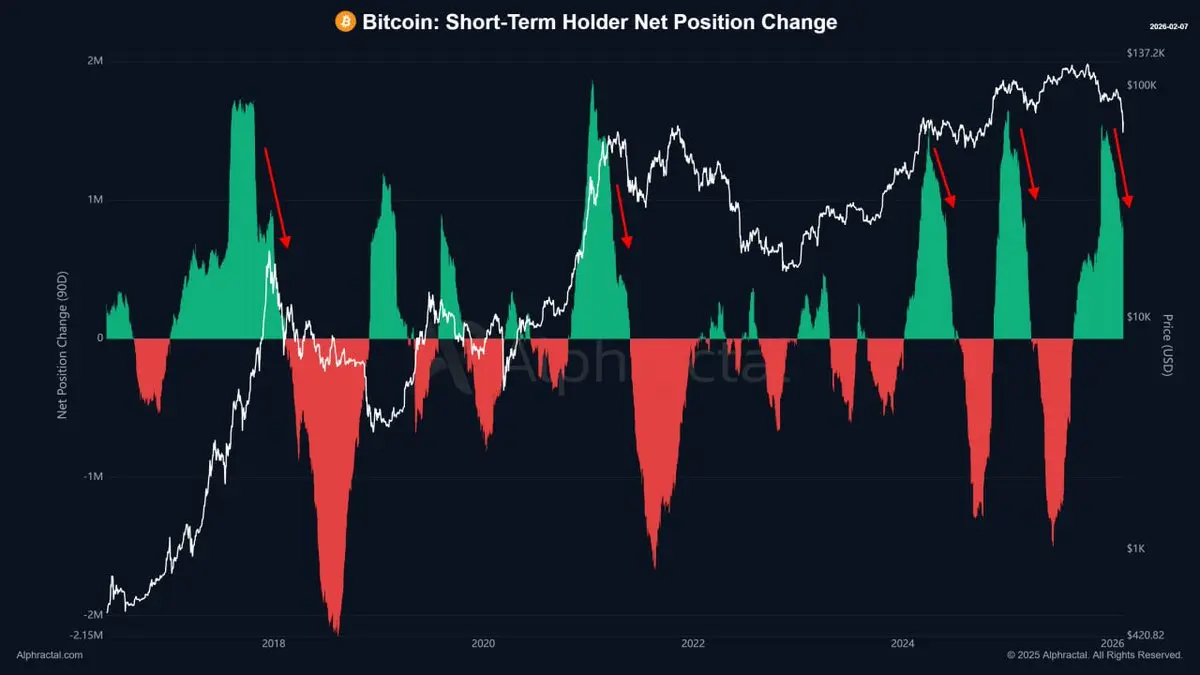
Short-Term BTC Price Behavior Explained
138
- Reward
- like
- Comment
- Repost
- Share
发财马
发财马
Created By@ComeWealthComeWealth188
Listing Progress
0.00%
MC:
$0.1
Create My Token
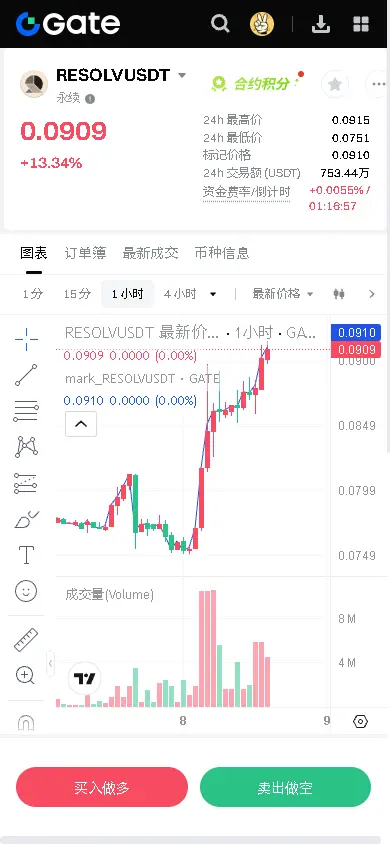
【$RESOLV Signal】Long | Healthy Consolidation After Breakout with Volume
$RESOLV After volume breakout from the previous consolidation range on the 4H chart, the price is consolidating tightly at high levels, showing a healthy reset pattern.
🎯Direction: Long
🎯Entry: 0.0890 - 0.0905
🛑Stop Loss: 0.0845 (Rigid Stop Loss)
🚀Target 1: 0.0980
🚀Target 2: 0.1050
Hardcore Logic: The key breakout occurred at 20:00 on February 7 on the 4H candlestick, accompanied by a massive volume (1.84 billion) and balanced buy-sell ratio (0.50). This is a typical sign of institutional accumulation rather than just
View Original$RESOLV After volume breakout from the previous consolidation range on the 4H chart, the price is consolidating tightly at high levels, showing a healthy reset pattern.
🎯Direction: Long
🎯Entry: 0.0890 - 0.0905
🛑Stop Loss: 0.0845 (Rigid Stop Loss)
🚀Target 1: 0.0980
🚀Target 2: 0.1050
Hardcore Logic: The key breakout occurred at 20:00 on February 7 on the 4H candlestick, accompanied by a massive volume (1.84 billion) and balanced buy-sell ratio (0.50). This is a typical sign of institutional accumulation rather than just
- Reward
- like
- Comment
- Repost
- Share
🧘 New to the dip? Don’t panic.
BTC dropped from $126k to $69k — scary, but normal in crypto.
3 easy rules to survive fear:
DCA: Buy slowly, don’t chase the bottom
Zoom out: Check long-term charts, not 5-minute candles
Verify: Ignore hype, look at real data
💡 Volatility is part of the game.
Stay calm. Hold smart. 🛡️
#Bitcoin #CryptoBeginners #HODL
$BTC
BTC1,39%

- Reward
- 1
- 1
- Repost
- Share
Crypto_Exper:
follow me brother I will follow back we should support each other 🥰✅📊 Bitcoin – Short-Term Holders UpdateThe supply held by Short-Term Holders is declining. At the same time, the 90-day net position change shows a clear lack of interest from new addresses to accumulate at these levels. This signals weak marginal demand and reinforces a market environment where continuation is unlikely without a reset in price or sentiment. On-chain data remains very clear.
BTC1,39%
- Reward
- 1
- Comment
- Repost
- Share


- Reward
- like
- 7
- Repost
- Share
OnlyBuySpot,Don'tBetOnContract :
:
It seems like I've been saying this for over ten years. It feels like I've been repeating this statement for more than a decade now.View More
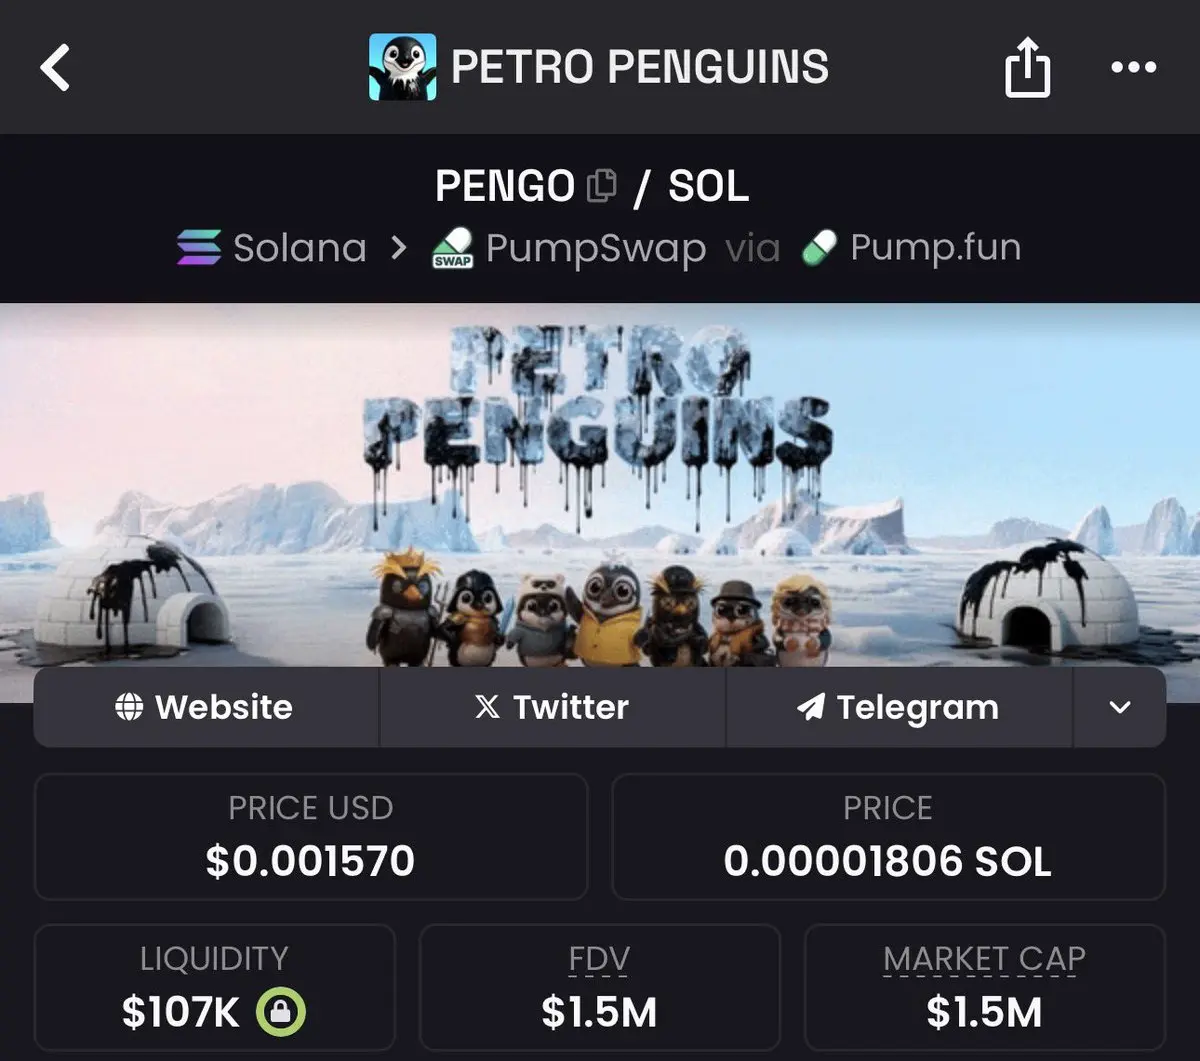
Believe it or not, $PENGO is the next $100M runner.
- Reward
- like
- Comment
- Repost
- Share
- Reward
- 2
- 4
- Repost
- Share
PutOn :
:
I took a look at your activity feed and discovered that you are a Shabi.View More
Check out Gate and join me in the hottest event! https://www.gate.com/campaigns/4030?ref=VQBFUWTZUQ&ref_type=132
- Reward
- like
- Comment
- Repost
- Share
#GlobalTechSell-OffHitsRiskAssets
The recent global tech sell-off has sent shockwaves across financial markets, reinforcing how tightly connected risk assets have become in the current macro environment. As major technology stocks faced sharp declines, the impact quickly spread beyond equities, triggering weakness across crypto, growth stocks, and other high-beta assets. This synchronized move highlights a broader shift in investor behavior, where capital is rotating away from risk amid rising uncertainty.
Technology stocks have long been seen as a barometer for risk appetite, and their recen
BTC1,39%

- Reward
- 1
- Comment
- Repost
- Share
mu
mumu
Created By@Rabbitk
Subscription Progress
0.00%
MC:
$0
Create My Token
🐋 Smart Money Is Accumulating
Whales are buying, retail is panicking
Accumulation Score: 0.68 → strong buying across wallets
Fear & Greed = 7 (Extreme Fear)
Institutions see $60k–$70k as a value zone
💡 Reminder:
Money is made during fear, not hype.
Are you following smart money or market emotion? 💎
#Bitcoin #Whales #HODL
$BTC
Whales are buying, retail is panicking
Accumulation Score: 0.68 → strong buying across wallets
Fear & Greed = 7 (Extreme Fear)
Institutions see $60k–$70k as a value zone
💡 Reminder:
Money is made during fear, not hype.
Are you following smart money or market emotion? 💎
#Bitcoin #Whales #HODL
$BTC
BTC1,39%
- Reward
- like
- Comment
- Repost
- Share
Exclusive insight from Bitwise’s Chief Advisor: This sell-off was driven by “paper capital”, while long-term capital has not exited the market
343
- Reward
- 1
- Comment
- Repost
- Share
No need to wait for another day, no need for next time, no need to wait for later—now is the time. The future has finally become the present. Meeting friends is the best today. No writing copy, just sharing heartfelt thoughts.
View Original- Reward
- like
- Comment
- Repost
- Share
It took so long to grow from age 10 to 20 but the speed at which we are moving to 30 is crazy
- Reward
- like
- Comment
- Repost
- Share
Breaking News: Officers from the Minnesota State Police and Hennepin County Sheriff's Department are conducting arrests in a parking lot near the Minneapolis Immigration and Customs Enforcement (ICE) facility, and those detained are loudly calling for help. Don’t expect them to sympathize with you. You’ll spend the rest of your weekend in jail. This is what law and order look like. Enjoy it. $BTC $ETH $SOL
View Original- Reward
- 1
- Comment
- Repost
- Share
Major Update!
Gate has fully upgraded its Options VIP fee structure, covering all options products and delivering meaningful fee reductions from beginners to professionals.
VIP0 users can enjoy lower trading fees with no asset or volume requirements, giving new traders a clear cost advantage from day one;
At the growth stage, traders can unlock lower fees with assets in the tens of thousands USD or monthly volume in the millions, far below the hundreds-of-millions volume or high-asset thresholds required by major platforms;
For professional and institutional traders, VIP10+ offers 0% Maker and

- Reward
- 1
- Comment
- Repost
- Share
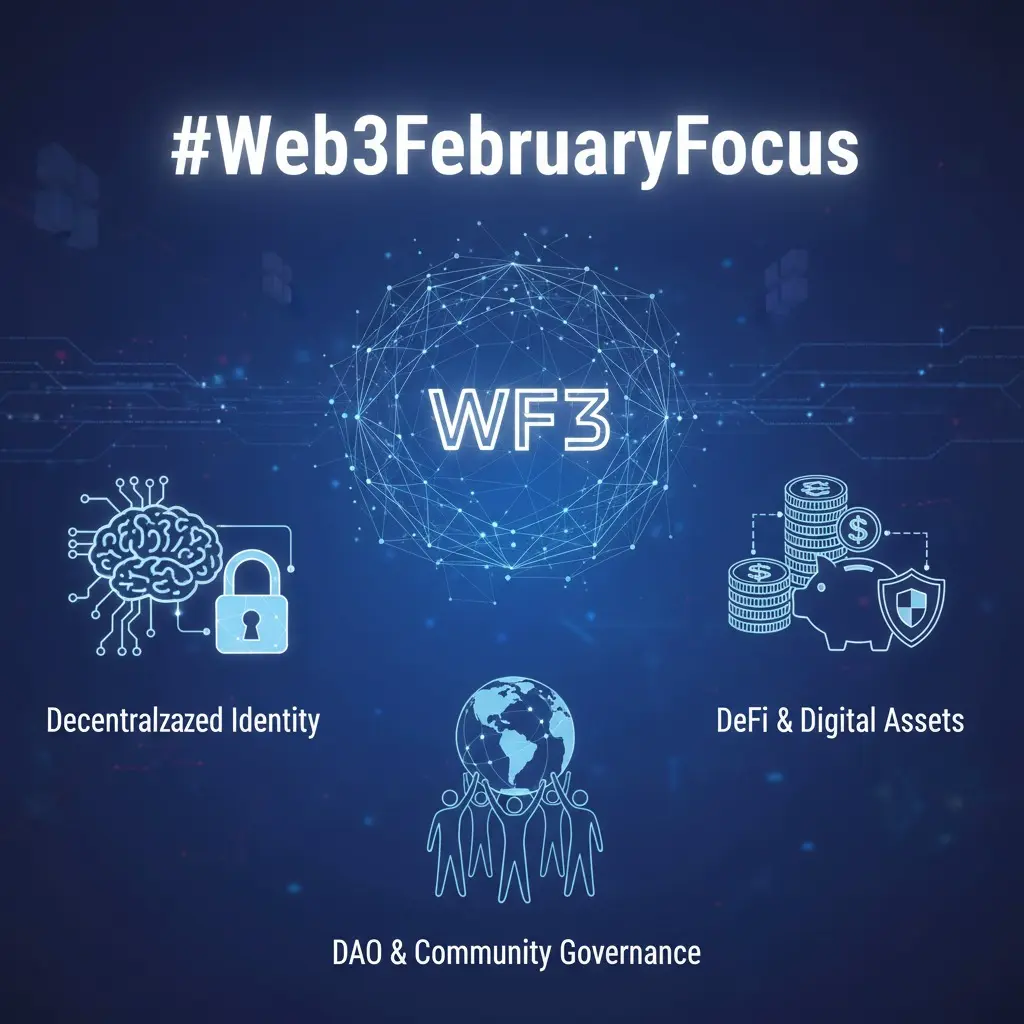
#Web3FebruaryFocus : Building the Next Phase of the Decentralized Internet
As February unfolds, the Web3 ecosystem is entering a critical phase of evolution. After years of experimentation, speculation, and rapid innovation, the focus is now shifting toward real utility, scalability, and long-term sustainability. #Web3FebruaryFocus represents more than just a trend it reflects a collective move toward building meaningful decentralized solutions that can stand the test of time.
One of the biggest themes dominating Web3 in February is infrastructure maturity. Layer-2 networks, modular blockchain

- Reward
- 1
- 4
- Repost
- Share
Crypto24pro:
good information dearView More
Gm, ctHave a great sunday🔆

- Reward
- like
- Comment
- Repost
- Share
Load More
Join 40M users in our growing community
⚡️ Join 40M users in the crypto craze discussion
💬 Engage with your favorite top creators
👍 See what interests you
Trending Topics
View More151.45K Popularity
11.88K Popularity
393.84K Popularity
2.39K Popularity
15.08K Popularity
Hot Gate Fun
View More- MC:$0.1Holders:10.00%
- MC:$2.4KHolders:10.00%
- MC:$0.1Holders:00.00%
- MC:$2.42KHolders:10.00%
- MC:$2.42KHolders:00.00%
News
View MoreArthur Hayes transfers ENA, PENDLE, ETHFI tokens to WinterMute
8 m
Arthur Hayes transferred 1 million ENA tokens to Wintermute, worth approximately $123,700.
12 m
"Maqi" increased ETH long positions to $6.3 million, opening at approximately $2018.
21 m
Trend Research Transfers 651,757 ETH to CEX Worth $1.34B
1 h
Next week's White House crypto meeting will focus on stablecoin yields, with bank representatives attending for the first time.
1 h
Pin