Trade
Basic
Futures
Futures
Hundreds of contracts settled in USDT or BTC
TradFi
Gold
Trade global traditional assets with USDT in one place
Options
Hot
Trade European-style vanilla options
Unified Account
Maximize your capital efficiency
Demo Trading
Futures Kickoff
Get prepared for your futures trading
Futures Events
Participate in events to win generous rewards
Demo Trading
Use virtual funds to experience risk-free trading
Earn
Launch
CandyDrop
Collect candies to earn airdrops
Launchpool
Quick staking, earn potential new tokens
HODLer Airdrop
Hold GT and get massive airdrops for free
Launchpad
Be early to the next big token project
Alpha Points
Trade on-chain assets and enjoy airdrop rewards!
Futures Points
Earn futures points and claim airdrop rewards
Investment
Simple Earn
Earn interests with idle tokens
Auto-Invest
Auto-invest on a regular basis
Dual Investment
Buy low and sell high to take profits from price fluctuations
Soft Staking
Earn rewards with flexible staking
Crypto Loan
0 Fees
Pledge one crypto to borrow another
Lending Center
One-stop lending hub
VIP Wealth Hub
Customized wealth management empowers your assets growth
Private Wealth Management
Customized asset management to grow your digital assets
Quant Fund
Top asset management team helps you profit without hassle
Staking
Stake cryptos to earn in PoS products
Smart Leverage
New
No forced liquidation before maturity, worry-free leveraged gains
GUSD Minting
Use USDT/USDC to mint GUSD for treasury-level yields
More
通讯员
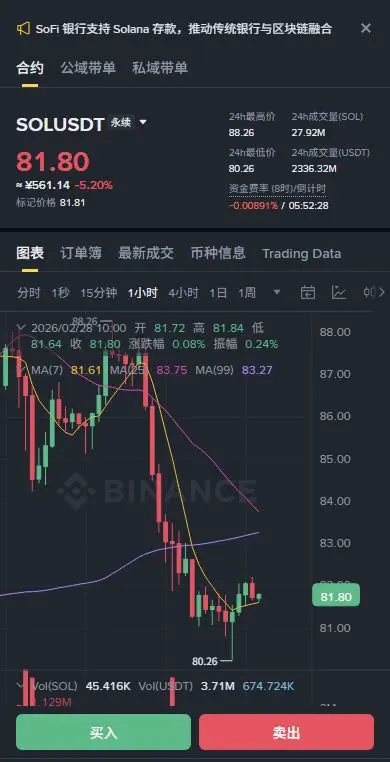
$SOL 1H level fluctuated within the range of 80.26-82.22, forming a bottom. The RSI(1H) has entered the oversold zone (35.72), indicating a technical rebound demand. The 4H chart shows consecutive bearish candles, with the price falling to the lower end of the recent consolidation zone, testing a key support area. Current open interest remains stable, the price has declined but did not trigger a large-scale liquidation. Market logic suggests caution for main players offloading, but the negative funding rate (-0.0085%) hints at short squeeze potential.
🎯Direction: Long (Long)
⚡Entry/Order: 81.
🎯Direction: Long (Long)
⚡Entry/Order: 81.
SOL-11,52%
- Reward
- 2
- Comment
- Repost
- Share
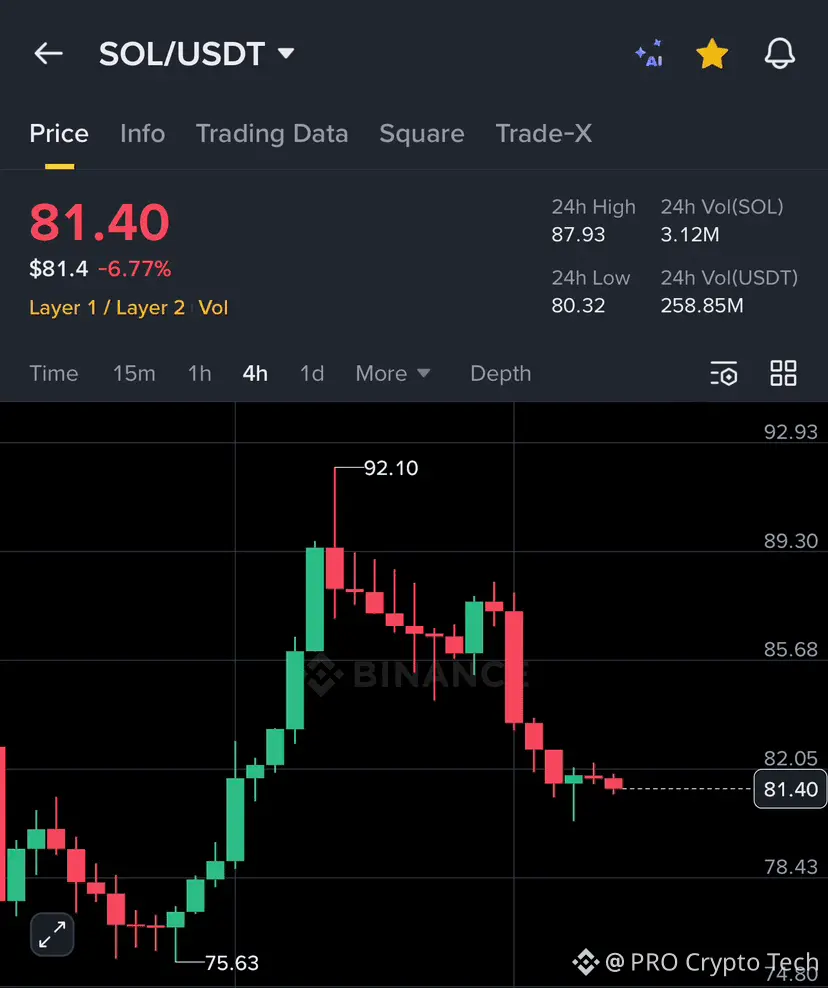
🔴 $SOL Analysis + Next Move
$SOL is exhibiting massive structural weakness, trading at $81.40 with a sharp -6.77% drop. The market has entered a "bearish regime shift" after a violent rejection at the $92.10 peak, signaling a total collapse in short-term buyer confidence. 📉⚠️
🔍 The Quick Analysis:-
Technical structure is fragile. $SOL is currently clinging to the $81.40 zone after losing the $85 support level. Sentiment is turning to "Extreme Fear" as institutional sell pressure crushes every minor attempt at a bounce on the 4H timeframe. ⛓️🎯
{future}(SOLUSDT)
🔱🚀 THE NEXT MOVE 🚀🔱
• Th
SOL-11,52%
- Reward
- 2
- Comment
- Repost
- Share
Jane Street aggressively bought silver ETFs in Q4, becoming the largest holder - is the institution betting big on precious metals?
1.150
- Reward
- 2
- 2
- Repost
- Share
AylaShinex :
:
To The Moon 🌕View More
馬币火
Malaysian Ringgit
Created By@CryptoKing2026
Listing Progress
100.00%
MC:
$5.26K
More Tokens
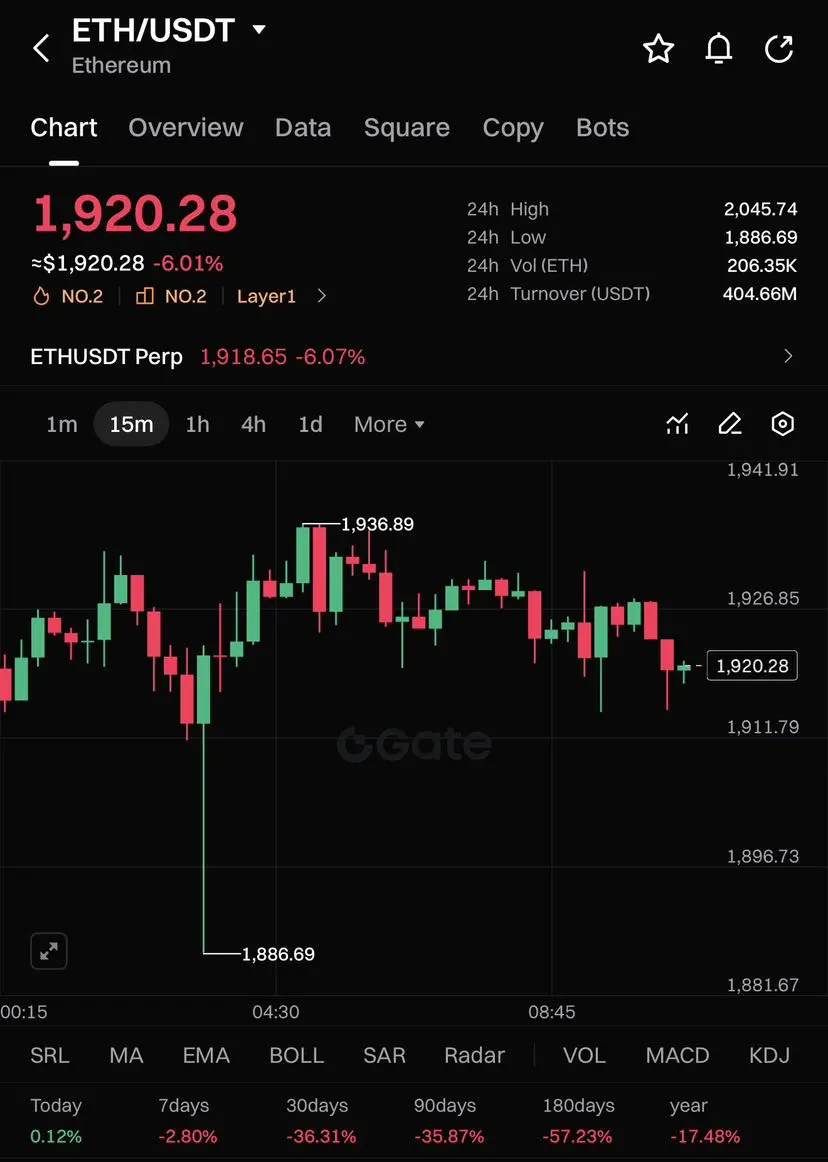
$ETH holding intraday support after liquidity sweep.
Structure stabilizing above local demand despite pressure.
EP
1,905 - 1,920
TP
TP1 1,945
TP2 1,980
TP3 2,040
SL
1,880
Liquidity below 1,886 already cleared with strong reaction while price builds higher low structure and positions for expansion back into prior supply range.
Let’s go $ETH
Structure stabilizing above local demand despite pressure.
EP
1,905 - 1,920
TP
TP1 1,945
TP2 1,980
TP3 2,040
SL
1,880
Liquidity below 1,886 already cleared with strong reaction while price builds higher low structure and positions for expansion back into prior supply range.
Let’s go $ETH
ETH-9,54%
- Reward
- like
- Comment
- Repost
- Share
The weekends never slow down
It's starting again
You punch me once
I punch you once
América hasn't made a move yet
Xiao Yi is forcing América to step up
View OriginalIt's starting again
You punch me once
I punch you once
América hasn't made a move yet
Xiao Yi is forcing América to step up

- Reward
- 2
- Comment
- Repost
- Share

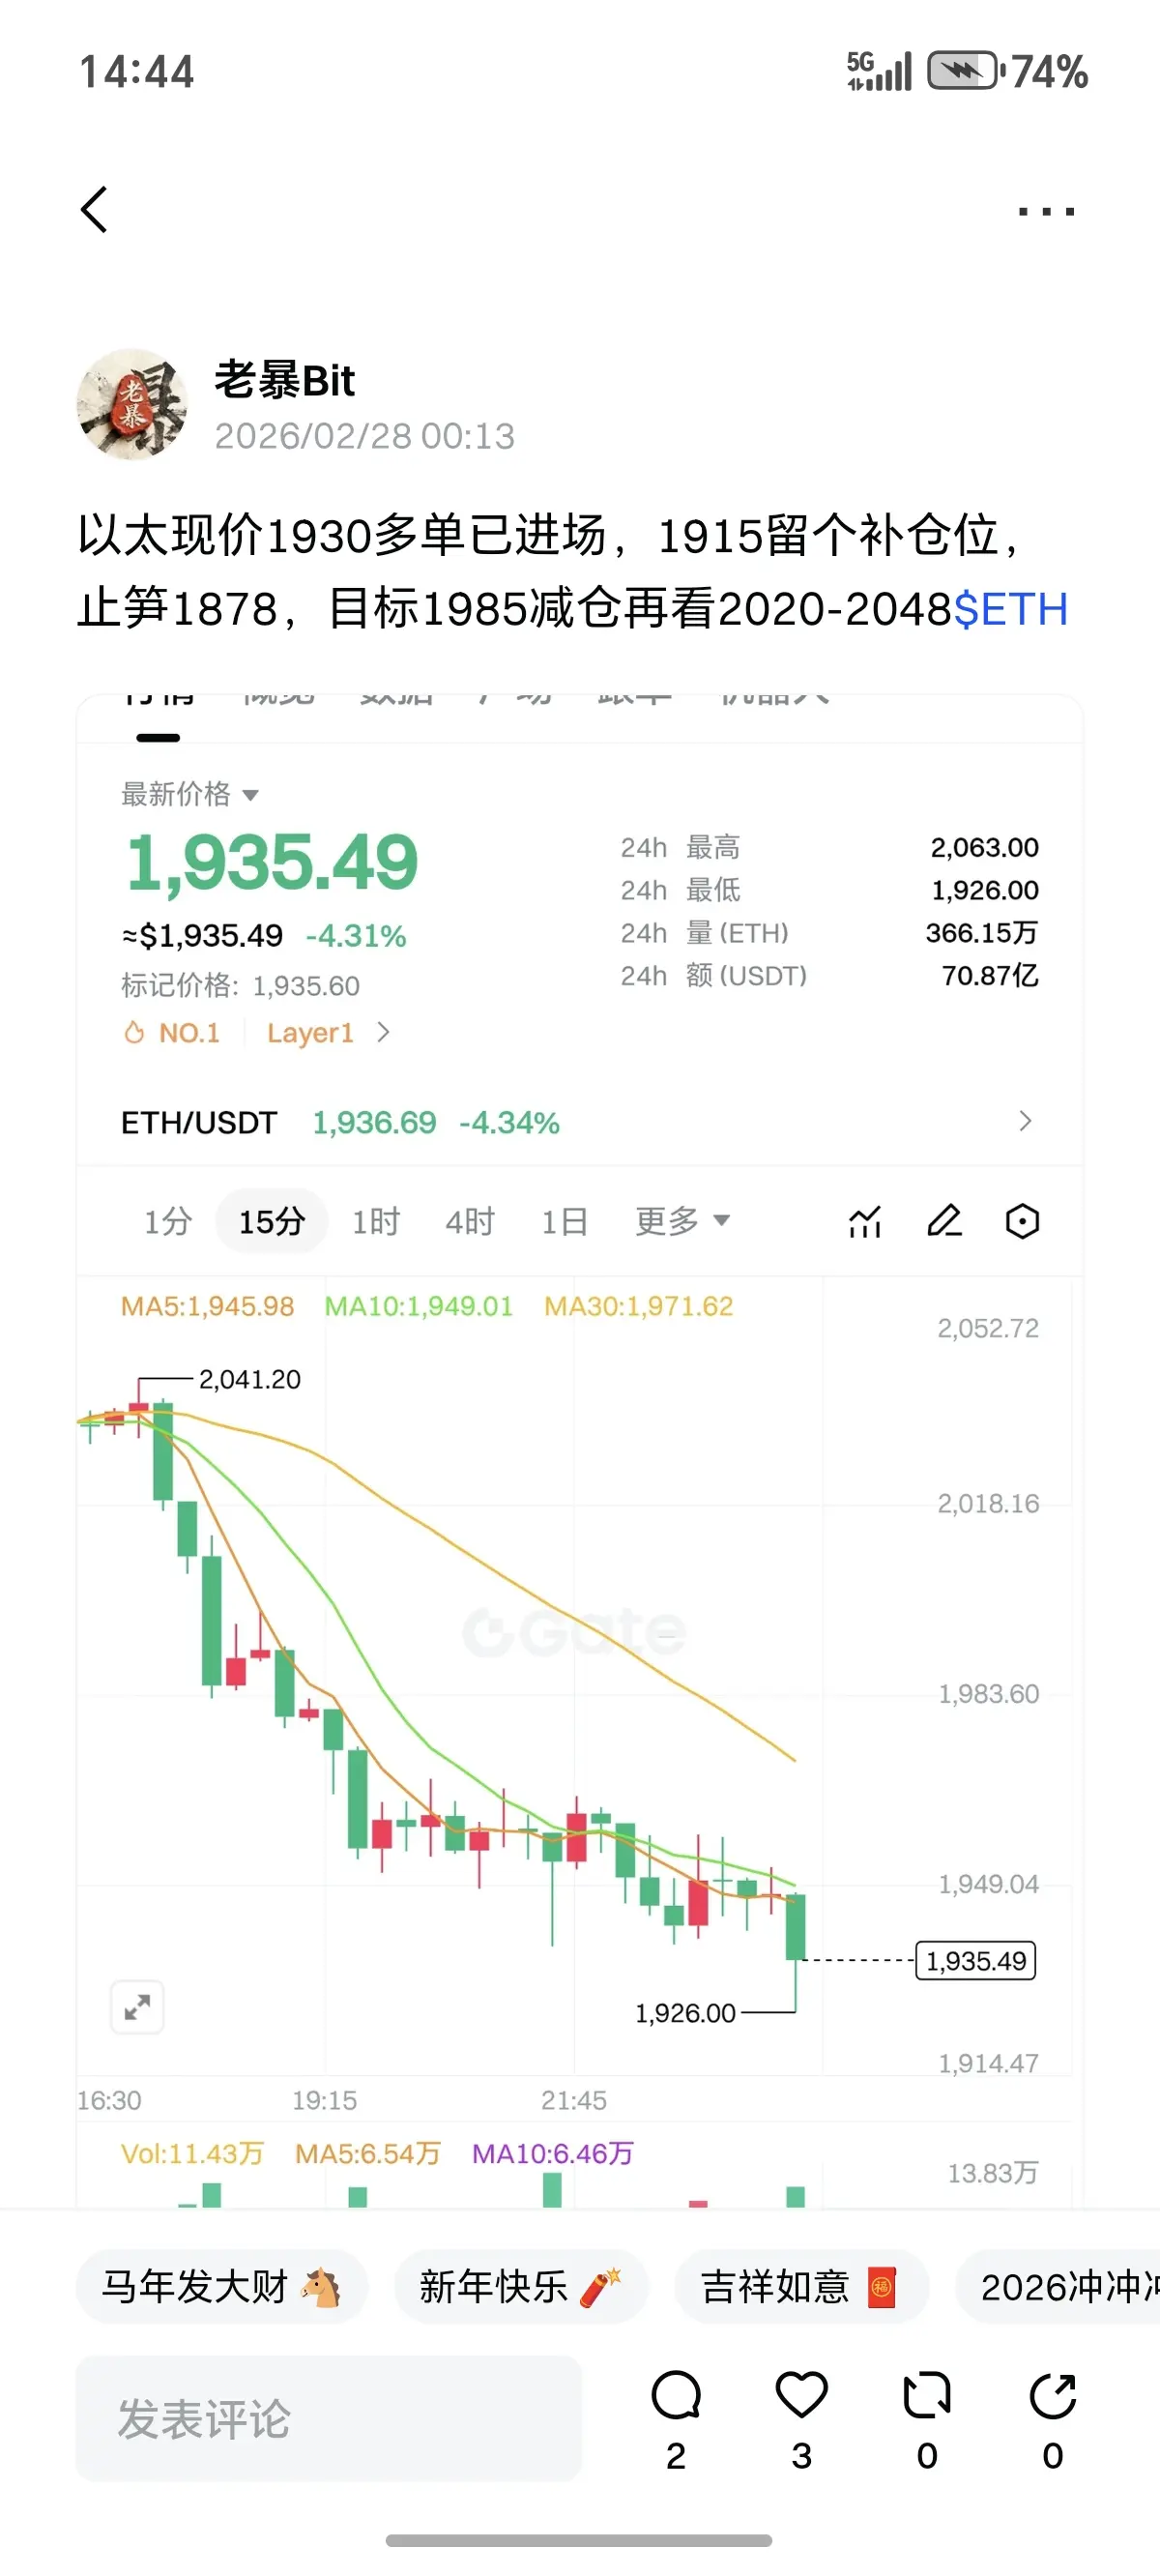
Last night’s long position, I need to sincerely apologize to everyone.
I’ve always wanted to grow our community, relying on steady compound growth rather than jumping into pits together. This wave last night was my impulsiveness, I took the wrong rhythm. I take responsibility for this, no excuses or shifting blame.
Back to the market, $ETH this order was stopped out. Where did I go wrong?
This week’s market has been inherently volatile, with both bulls and bears fighting fiercely. The biggest mistake in short-term trading is obsession—being a stubborn bull or a stubborn bear can easily lead t
ETH-9,54%
- Reward
- 2
- Comment
- Repost
- Share
Seeing a bunch of experts on X Polymarket performance?
There's one key point to note:
Polymarket's own website PnL calculation is simply inaccurate, so it's best to refer to the profit and loss chart posted on the site. I only realized this after trading for a while. I looked at how the profit and loss PNL is more than my total principal, probably because some profits and losses from merge redeem and other activities are missed in the calculation. In the end, I had to create my own correction website to record performance.
By the way, based on my current understanding of PM, the only well-writ
View OriginalThere's one key point to note:
Polymarket's own website PnL calculation is simply inaccurate, so it's best to refer to the profit and loss chart posted on the site. I only realized this after trading for a while. I looked at how the profit and loss PNL is more than my total principal, probably because some profits and losses from merge redeem and other activities are missed in the calculation. In the end, I had to create my own correction website to record performance.
By the way, based on my current understanding of PM, the only well-writ
- Reward
- 1
- Comment
- Repost
- Share

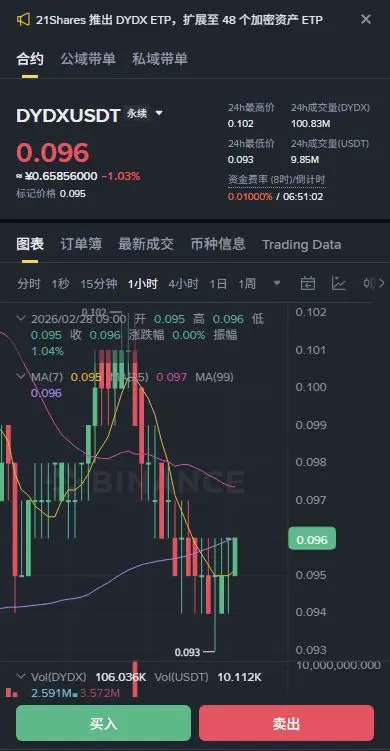
$DYDX 1H level consolidates with decreasing volume in the 0.094-0.096 range, RSI(1H) has entered the oversold zone (41.41), forming a potential bullish divergence with the price. Although on the 4H timeframe the price is in a downtrend channel, open interest (OI) remains stable and not decreasing, and the order book shows unusually thick buy-side depth at 0.094-0.093, indicating that funds are supporting the price. Currently, the price is falling but OI is not decreasing, combined with a positive funding rate, suggesting a potential short squeeze rebound opportunity.
🎯Direction: Long (Long)
⚡
🎯Direction: Long (Long)
⚡
DYDX-11,03%
- Reward
- 2
- Comment
- Repost
- Share
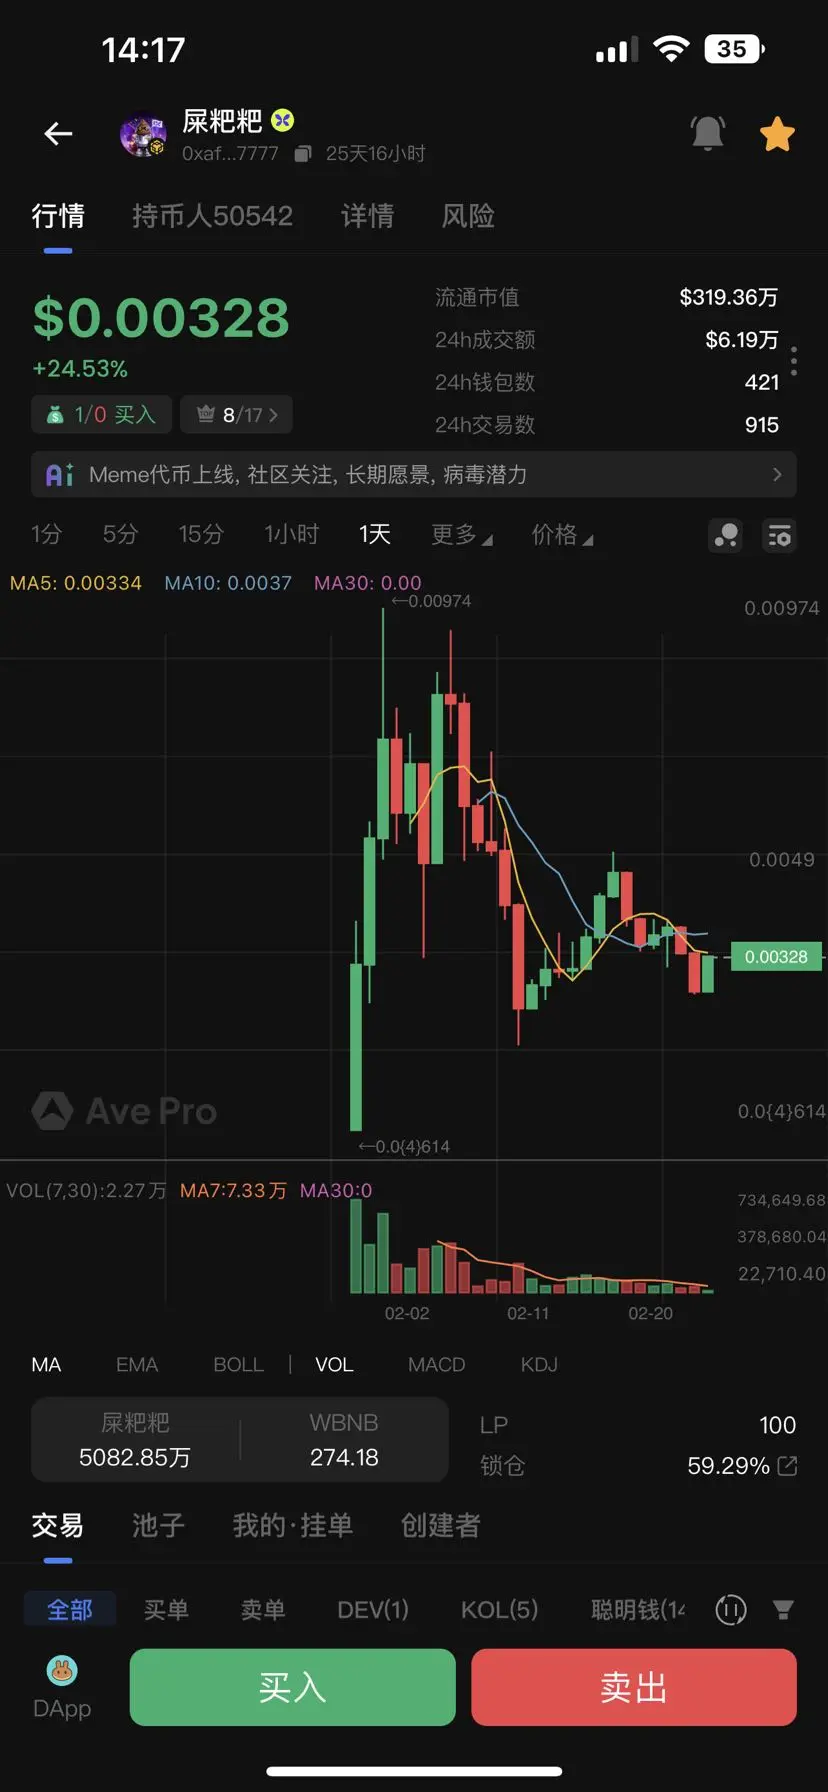
Looking at the primary market in the crypto space, only Shiba Inu is reliable. P-Young, please come back. Strong whales + strong community building! For $Shiba Inu, if you hesitate for even a second, it's a disrespect to money!
Shiba Inu buy-in
Speed is key, and the moves should be stylish. Keep up and enjoy the gains
View OriginalShiba Inu buy-in
Speed is key, and the moves should be stylish. Keep up and enjoy the gains


- Reward
- 2
- Comment
- Repost
- Share
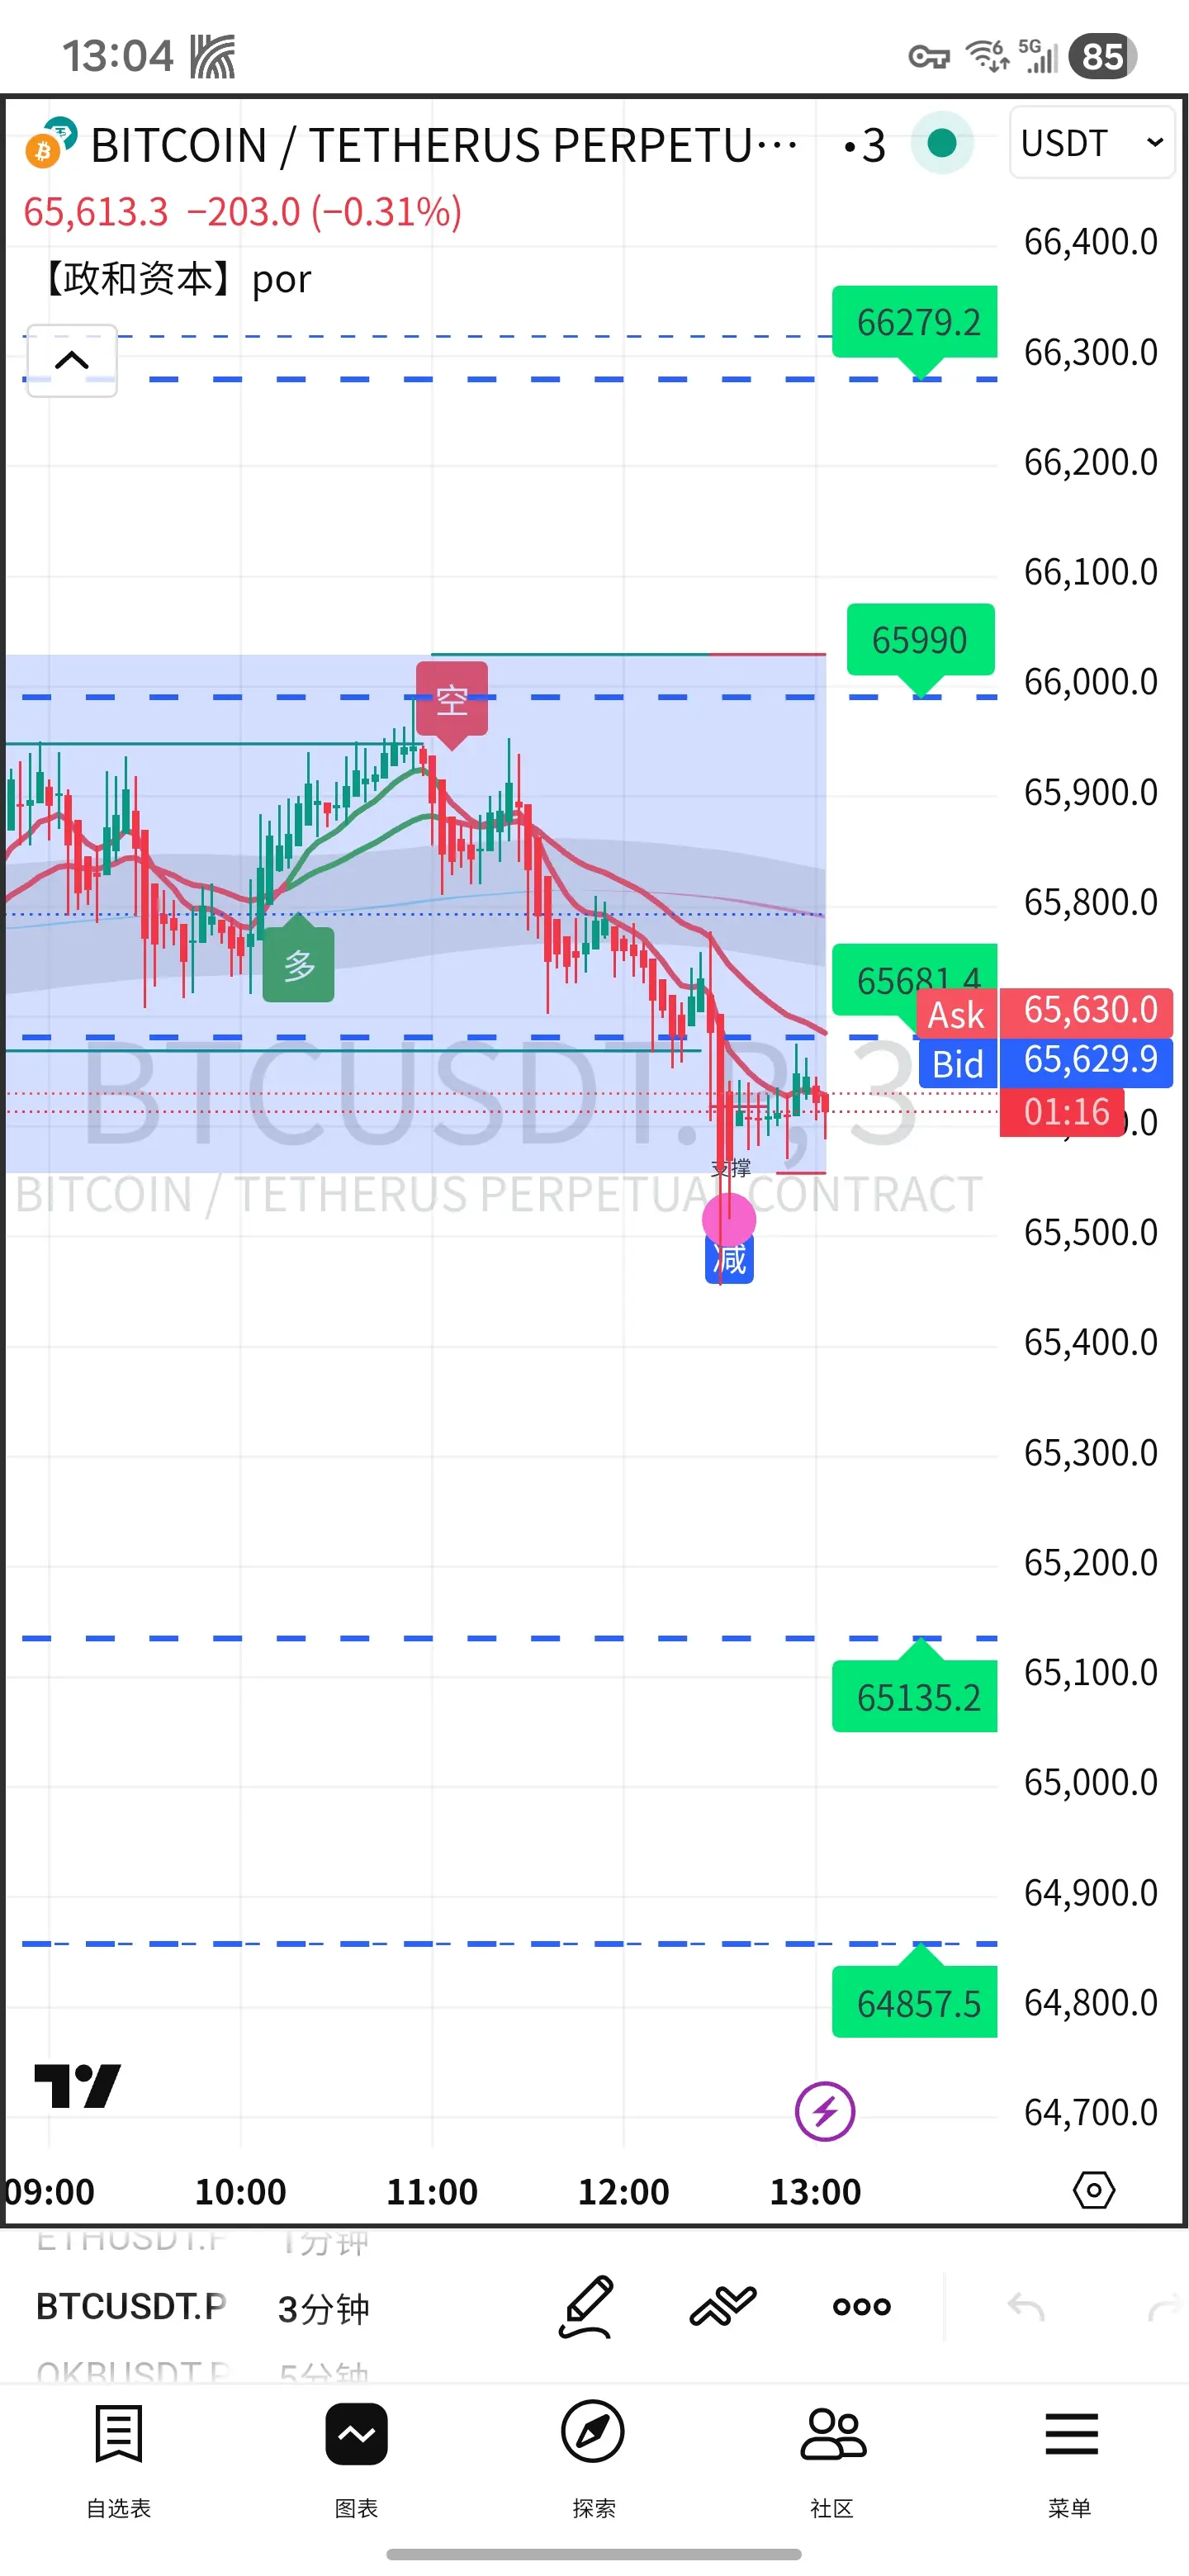
📊 2026-02-28 BTC Technical Analysis (Midday Update)
Current Price: approximately $65,500, 24h decline -2.82%, intraday low $64,875
1. Trends and Structure
- Daily Chart: Bearish dominance, down for 5 consecutive months, February decline about 14%; price is operating within the lower band of the Bollinger Bands, all moving averages (EMA/SMA) are above the price, indicating a bearish alignment
- 4-Hour Chart: Weak oscillation, decreasing bearish volume, no clear trend momentum; range $64,300–$68,400
- Weekly Chart: Critical break level, 200-week EMA lost ($67,628), long-term upward trend
BTC-6,66%
- Reward
- 2
- Comment
- Repost
- Share
p小将
p小将
Created By@DreamJourney
Listing Progress
100.00%
MC:
$1.76K
More Tokens
🚨 JUST IN: TETHER STRIKES HARD ON ILLICIT CRYPTO!
Tether has frozen a total of $4.2 Billion $USDT that were linked to illegal activities.
Tether has frozen a total of $4.2 Billion $USDT that were linked to illegal activities.


- Reward
- 2
- Comment
- Repost
- Share

Still holding no positions, still enjoying peaceful days
Let's all maintain a good life and happiness together, avoid accepting anxiety, and stay out of the chaos
Wait until the bottom falls, then we will buy the dip aggressively, and after a year, we will have enough for the next ten years of living expenses
View OriginalLet's all maintain a good life and happiness together, avoid accepting anxiety, and stay out of the chaos
Wait until the bottom falls, then we will buy the dip aggressively, and after a year, we will have enough for the next ten years of living expenses

- Reward
- like
- Comment
- Repost
- Share
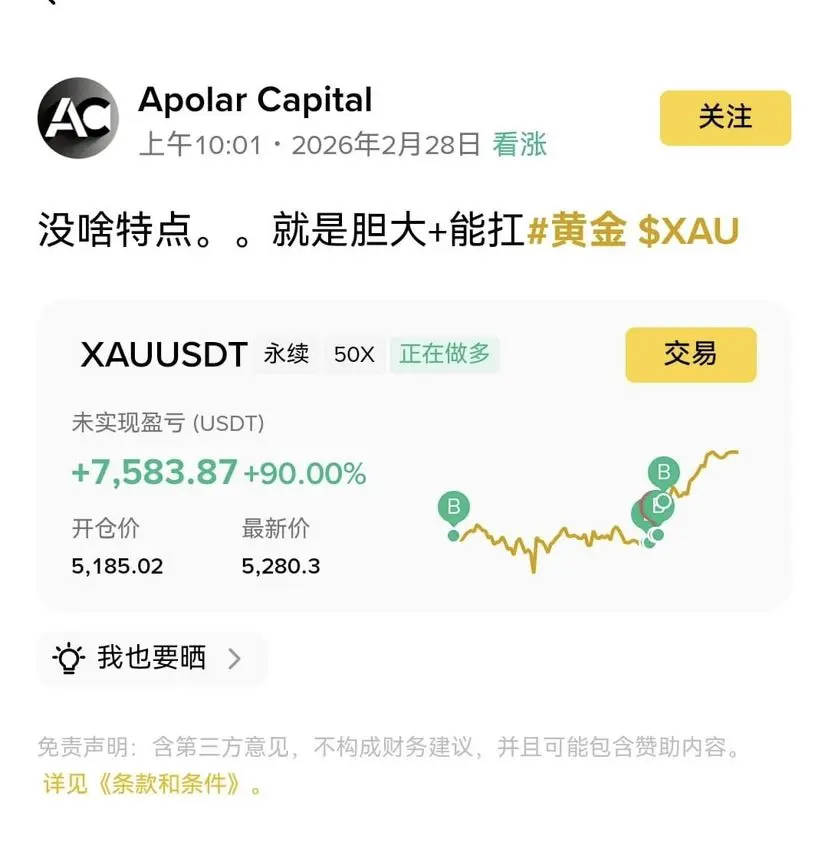
Oh my goodness! Using 50x leverage to go all-in on gold, and the return rate jumps straight to 90%? This foreigner from Apolar is really bold and skilled, he’s making a killing!
His long position exploded with a profit of $7,583, a 90.00% return! This actually earned him nearly 54,600 RMB! This money could have been used to buy a full set of custom solid wood furniture, but instead, he easily made a profit through this precise heavy position in gold. No wonder he straightforwardly said, “Nothing special, just bold + capable,” this 50x leverage move is truly impressive!
His long position exploded with a profit of $7,583, a 90.00% return! This actually earned him nearly 54,600 RMB! This money could have been used to buy a full set of custom solid wood furniture, but instead, he easily made a profit through this precise heavy position in gold. No wonder he straightforwardly said, “Nothing special, just bold + capable,” this 50x leverage move is truly impressive!
View Original
- Reward
- like
- Comment
- Repost
- Share
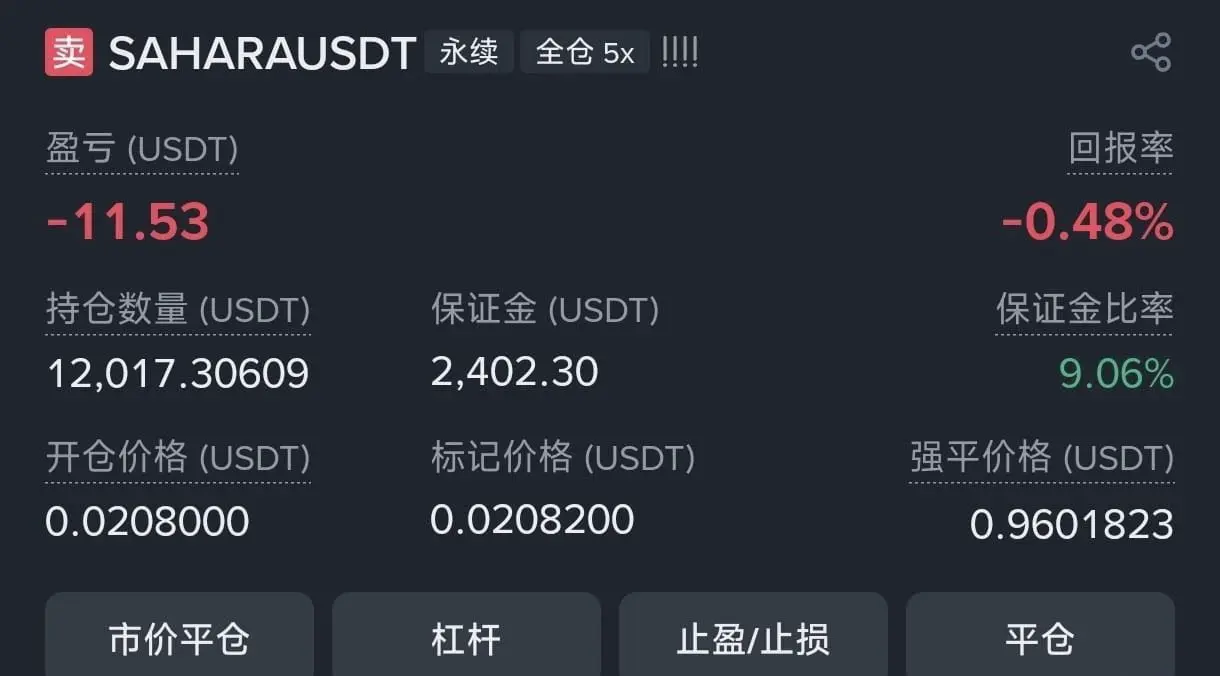
$SAHARA Empty!!
0.02 is empty, 100,000!! Took a look at the square, many people rushed in to go long, thinking it will be like POW, making the bulls happily eat the fees while it suddenly surges 🤣. Last year, this kind of project unlocked a wave and directly dropped fifty points, 🐶 the big players are just here to cash out, it can't be pushed up at all. The trapped orders and the profit-taking orders of the big players are all selling pressure. Now the main position 🈳 is in! 👇👇#Gate广场发帖领五万美金红包 $SAHARA
0.02 is empty, 100,000!! Took a look at the square, many people rushed in to go long, thinking it will be like POW, making the bulls happily eat the fees while it suddenly surges 🤣. Last year, this kind of project unlocked a wave and directly dropped fifty points, 🐶 the big players are just here to cash out, it can't be pushed up at all. The trapped orders and the profit-taking orders of the big players are all selling pressure. Now the main position 🈳 is in! 👇👇#Gate广场发帖领五万美金红包 $SAHARA
SAHARA29,95%
- Reward
- 1
- 2
- Repost
- Share
CanYouWithstandIt?:
Such a large positionView More
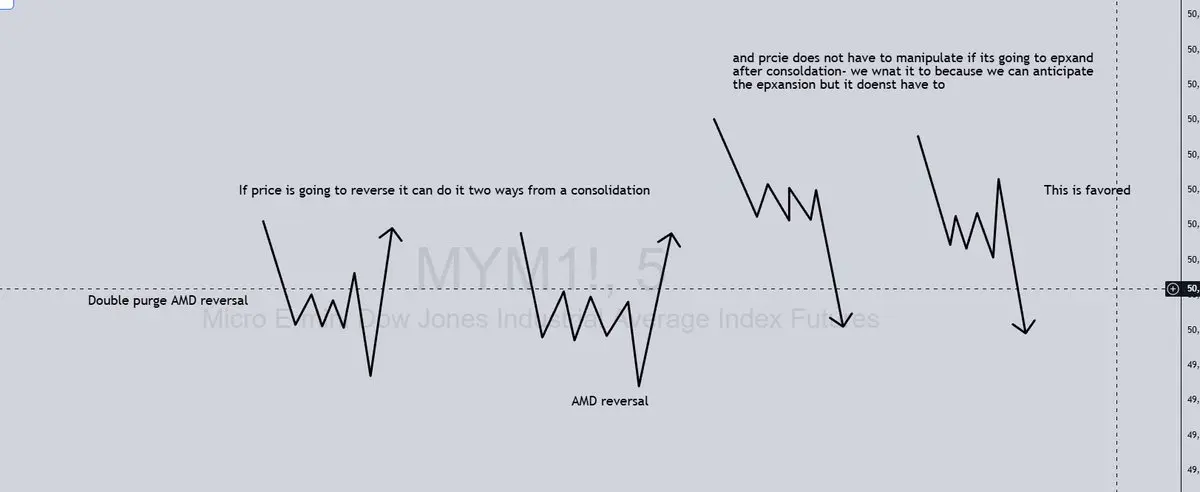
There are only two ways price can leave a consolidation after expanding.
1. AMDC
2. AMDR
These are the fundamentals you must master.
1. AMDC
2. AMDR
These are the fundamentals you must master.

- Reward
- like
- Comment
- Repost
- Share
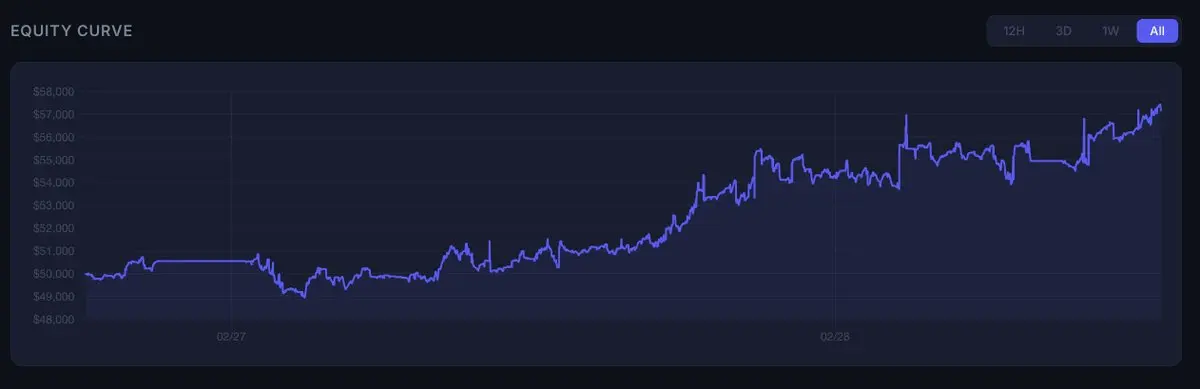
📈 Witness the real profits of top experts!
Top 7-day profit rate leaderboard for leading traders
🥇 Life is full of surprises: +176%
🥈 Must cash out: +159%
🥉 K7 Trading Path: +145%
Instead of blindly exploring, it's better to directly copy success. One-click follow, let the profits run on their own!
🔗 Follow now: https://www.gate.com/copytrading
#跟单 #交易高手 #被动持仓
View OriginalTop 7-day profit rate leaderboard for leading traders
🥇 Life is full of surprises: +176%
🥈 Must cash out: +159%
🥉 K7 Trading Path: +145%
Instead of blindly exploring, it's better to directly copy success. One-click follow, let the profits run on their own!
🔗 Follow now: https://www.gate.com/copytrading
#跟单 #交易高手 #被动持仓


- Reward
- 1
- Comment
- Repost
- Share
Load More
Join 40M users in our growing community
⚡️ Join 40M users in the crypto craze discussion
💬 Engage with your favorite top creators
👍 See what interests you
Trending Topics
View More38.13K Popularity
148.11K Popularity
86.81K Popularity
1.66M Popularity
484.08K Popularity
Hot Gate Fun
View More- MC:$0.1Holders:10.00%
- MC:$2.41KHolders:10.00%
- MC:$2.44KHolders:00.07%
- MC:$0.1Holders:10.00%
- MC:$0.1Holders:10.00%
News
View MoreETH drops below 1850 USDT
7 m
Machi Suffers Another Liquidation as ETH Drops Following Israel-Iran Strike
8 m
Israeli media: Multiple assassination attempts have already taken place inside Iran
9 m
Solana Price Prediction: Ali Martinez Indicates $50, $22, and $10 as Three Major Support Levels
9 m
Israel expects Iran to not respond at least until tonight.
10 m
Pin