Two Probable Scenarios For BTC This Week Following the Push to $30K (Bitcoin Price Analysis)
CryptoPotato
After a decisive breakout above the 100 and 200-day moving averages last week, the price retraced and formed a pullback to confirm the breakout, restoring confidence.
The market exhibits a robust bullish momentum, targeting the critical $31K region.
Technical Analysis
By Shayan
The Daily Chart
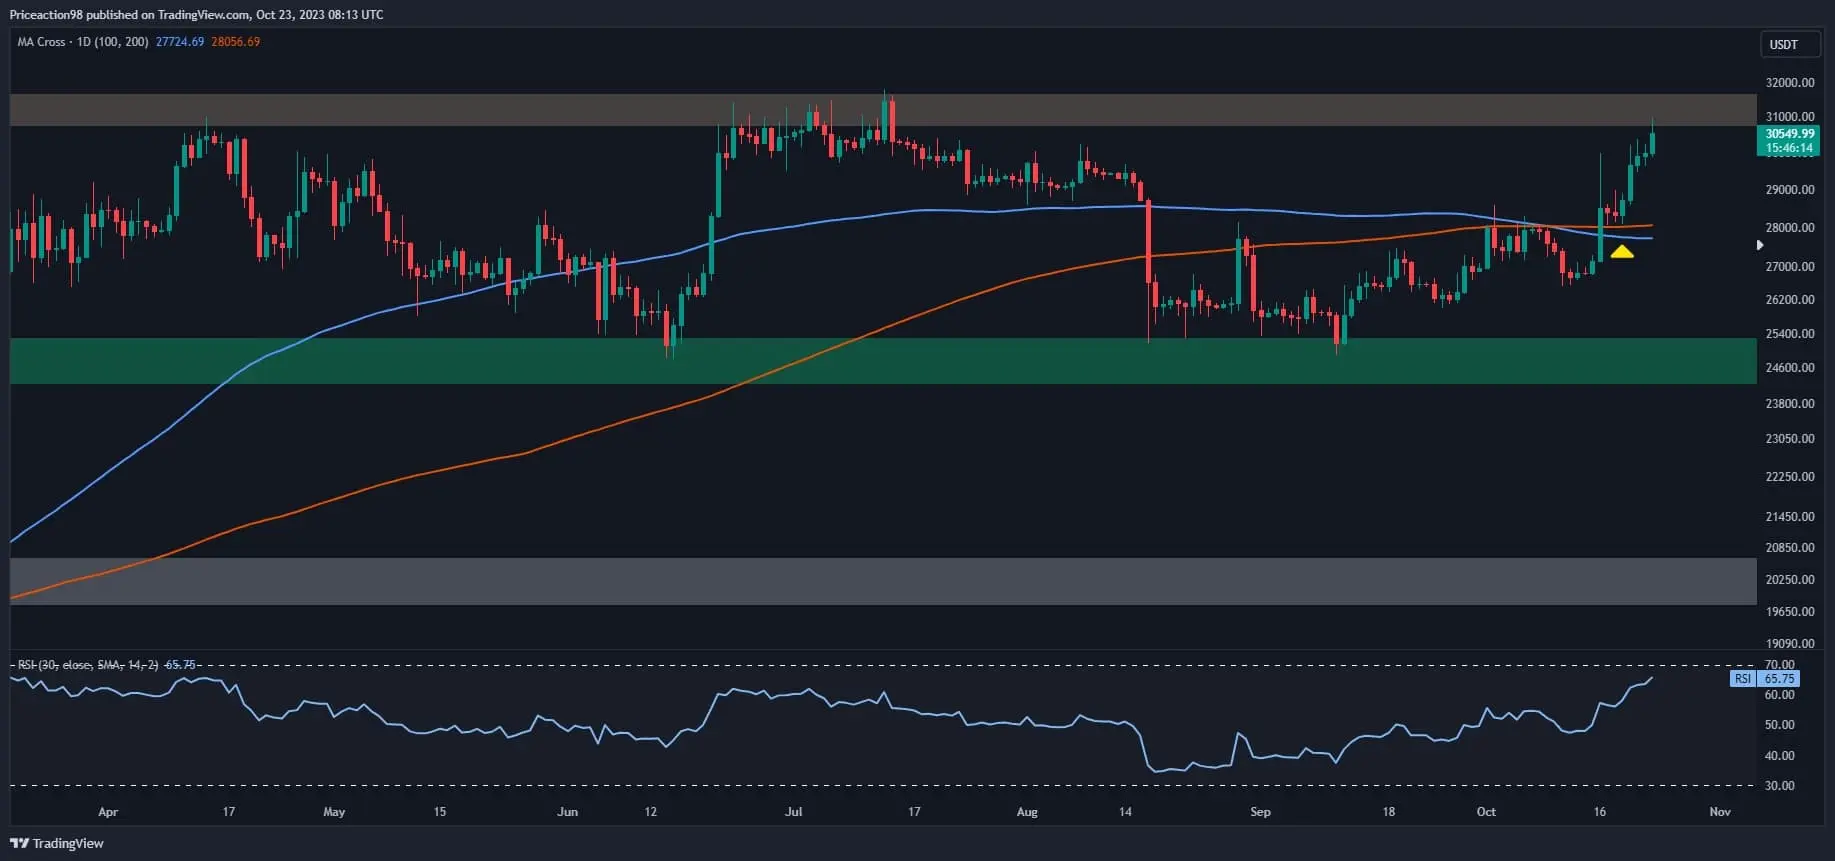
Looking at the daily chart, the price demonstrated an impulsive surge, surpassing the vital resistance zone around the $27K mark marked by the 100 and 200-day moving averages. However, as is customary, every breakout is followed by a pullback for confirmation.
Accordingly, the price returned to the moving averages, completing a pullback and gaining momentum, driving Bitcoin towards the significant resistance area of $31K, which also aligns with the cryptocurrency’s yearly high.
It is worth noting that this price range serves as a substantial psychological barrier. Hence, if buyers successfully reclaim this essential level, the market could pave the way for a mid-term bullish trend, targeting higher resistance zones.
Conversely, in the event of a rejection, Bitcoin may enter a period of consolidation correction marked by increased volatility.
 Source: TradingView### The 4-Hour Chart
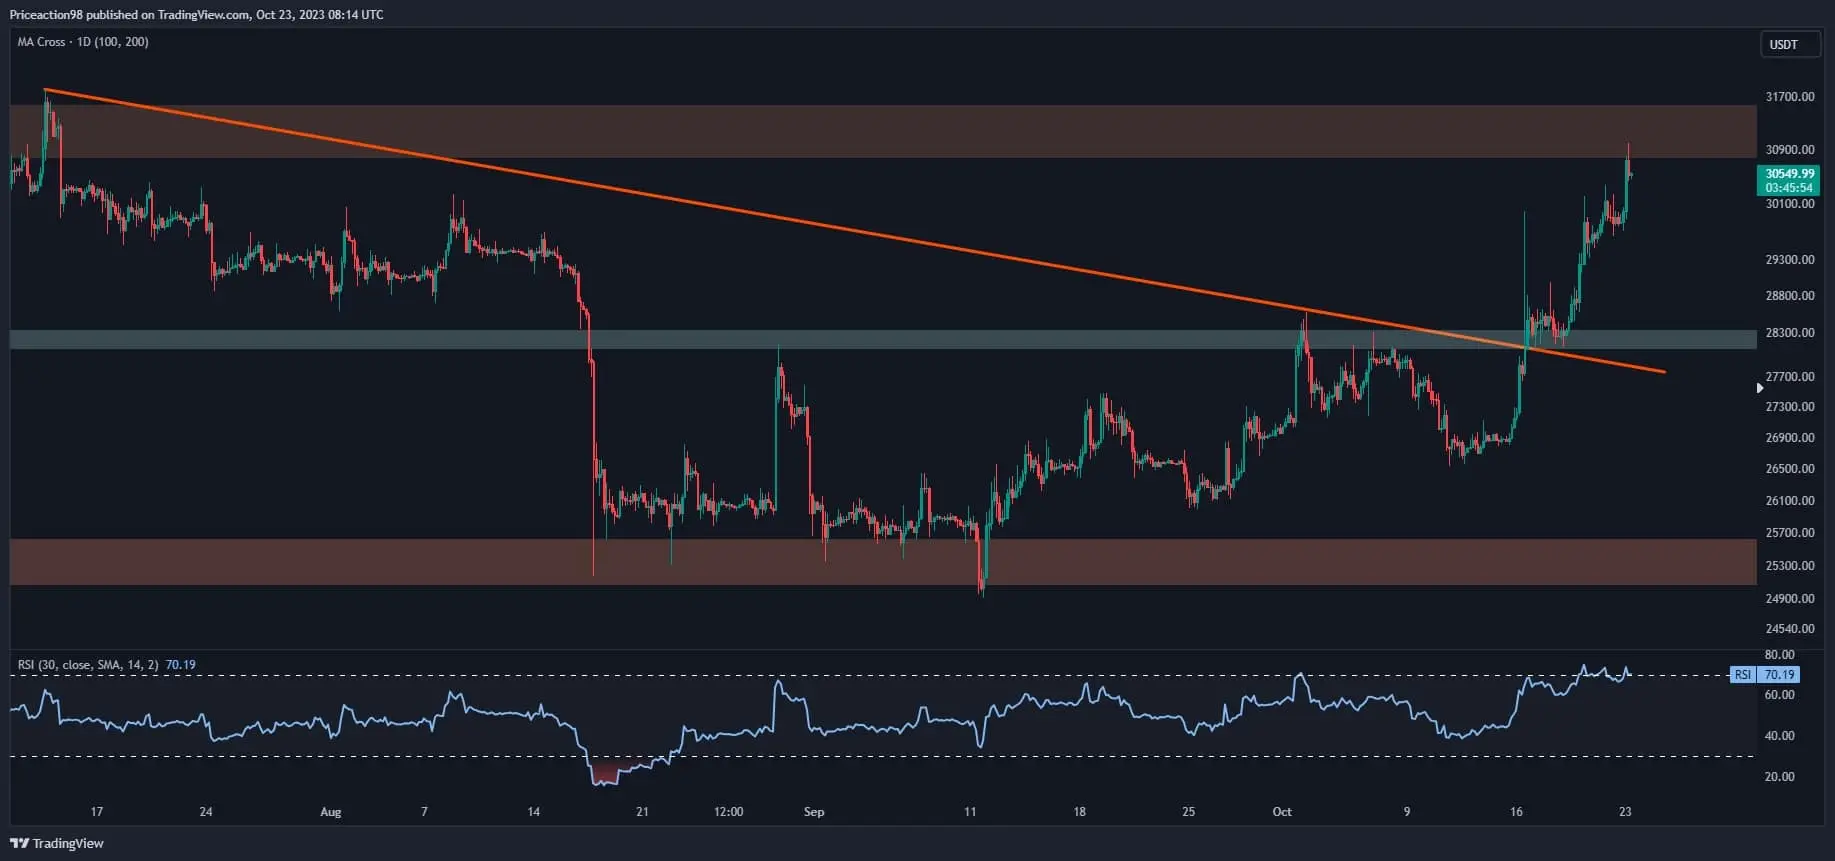
On the 4-hour chart, a noticeable bullish divergence between the price and the RSI indicator, coupled with prevailing demand around the $25K mark, led to a robust upward movement surpassing the multi-month descending trendline. However, the resistance zone at the $30K mark is characterized by significant Bitcoin supply, which might temporarily impede the uptrend, potentially triggering a correction.
Nonetheless, if buyers manage to overpower sellers, a sudden breakout could occur, potentially leading to the liquidation of numerous short positions.
Regardless of the outcome, closely monitoring price action in the coming days is imperative for making informed trading decisions, given the expected mid-term volatility that will significantly influence the market’s direction.
 Source: TradingView## On-chain Analysis
By Shayan
The futures market has played a significant role in shaping Bitcoin’s recent price movements. Therefore, the futures market must remain favorable for the current uptrend to persist.
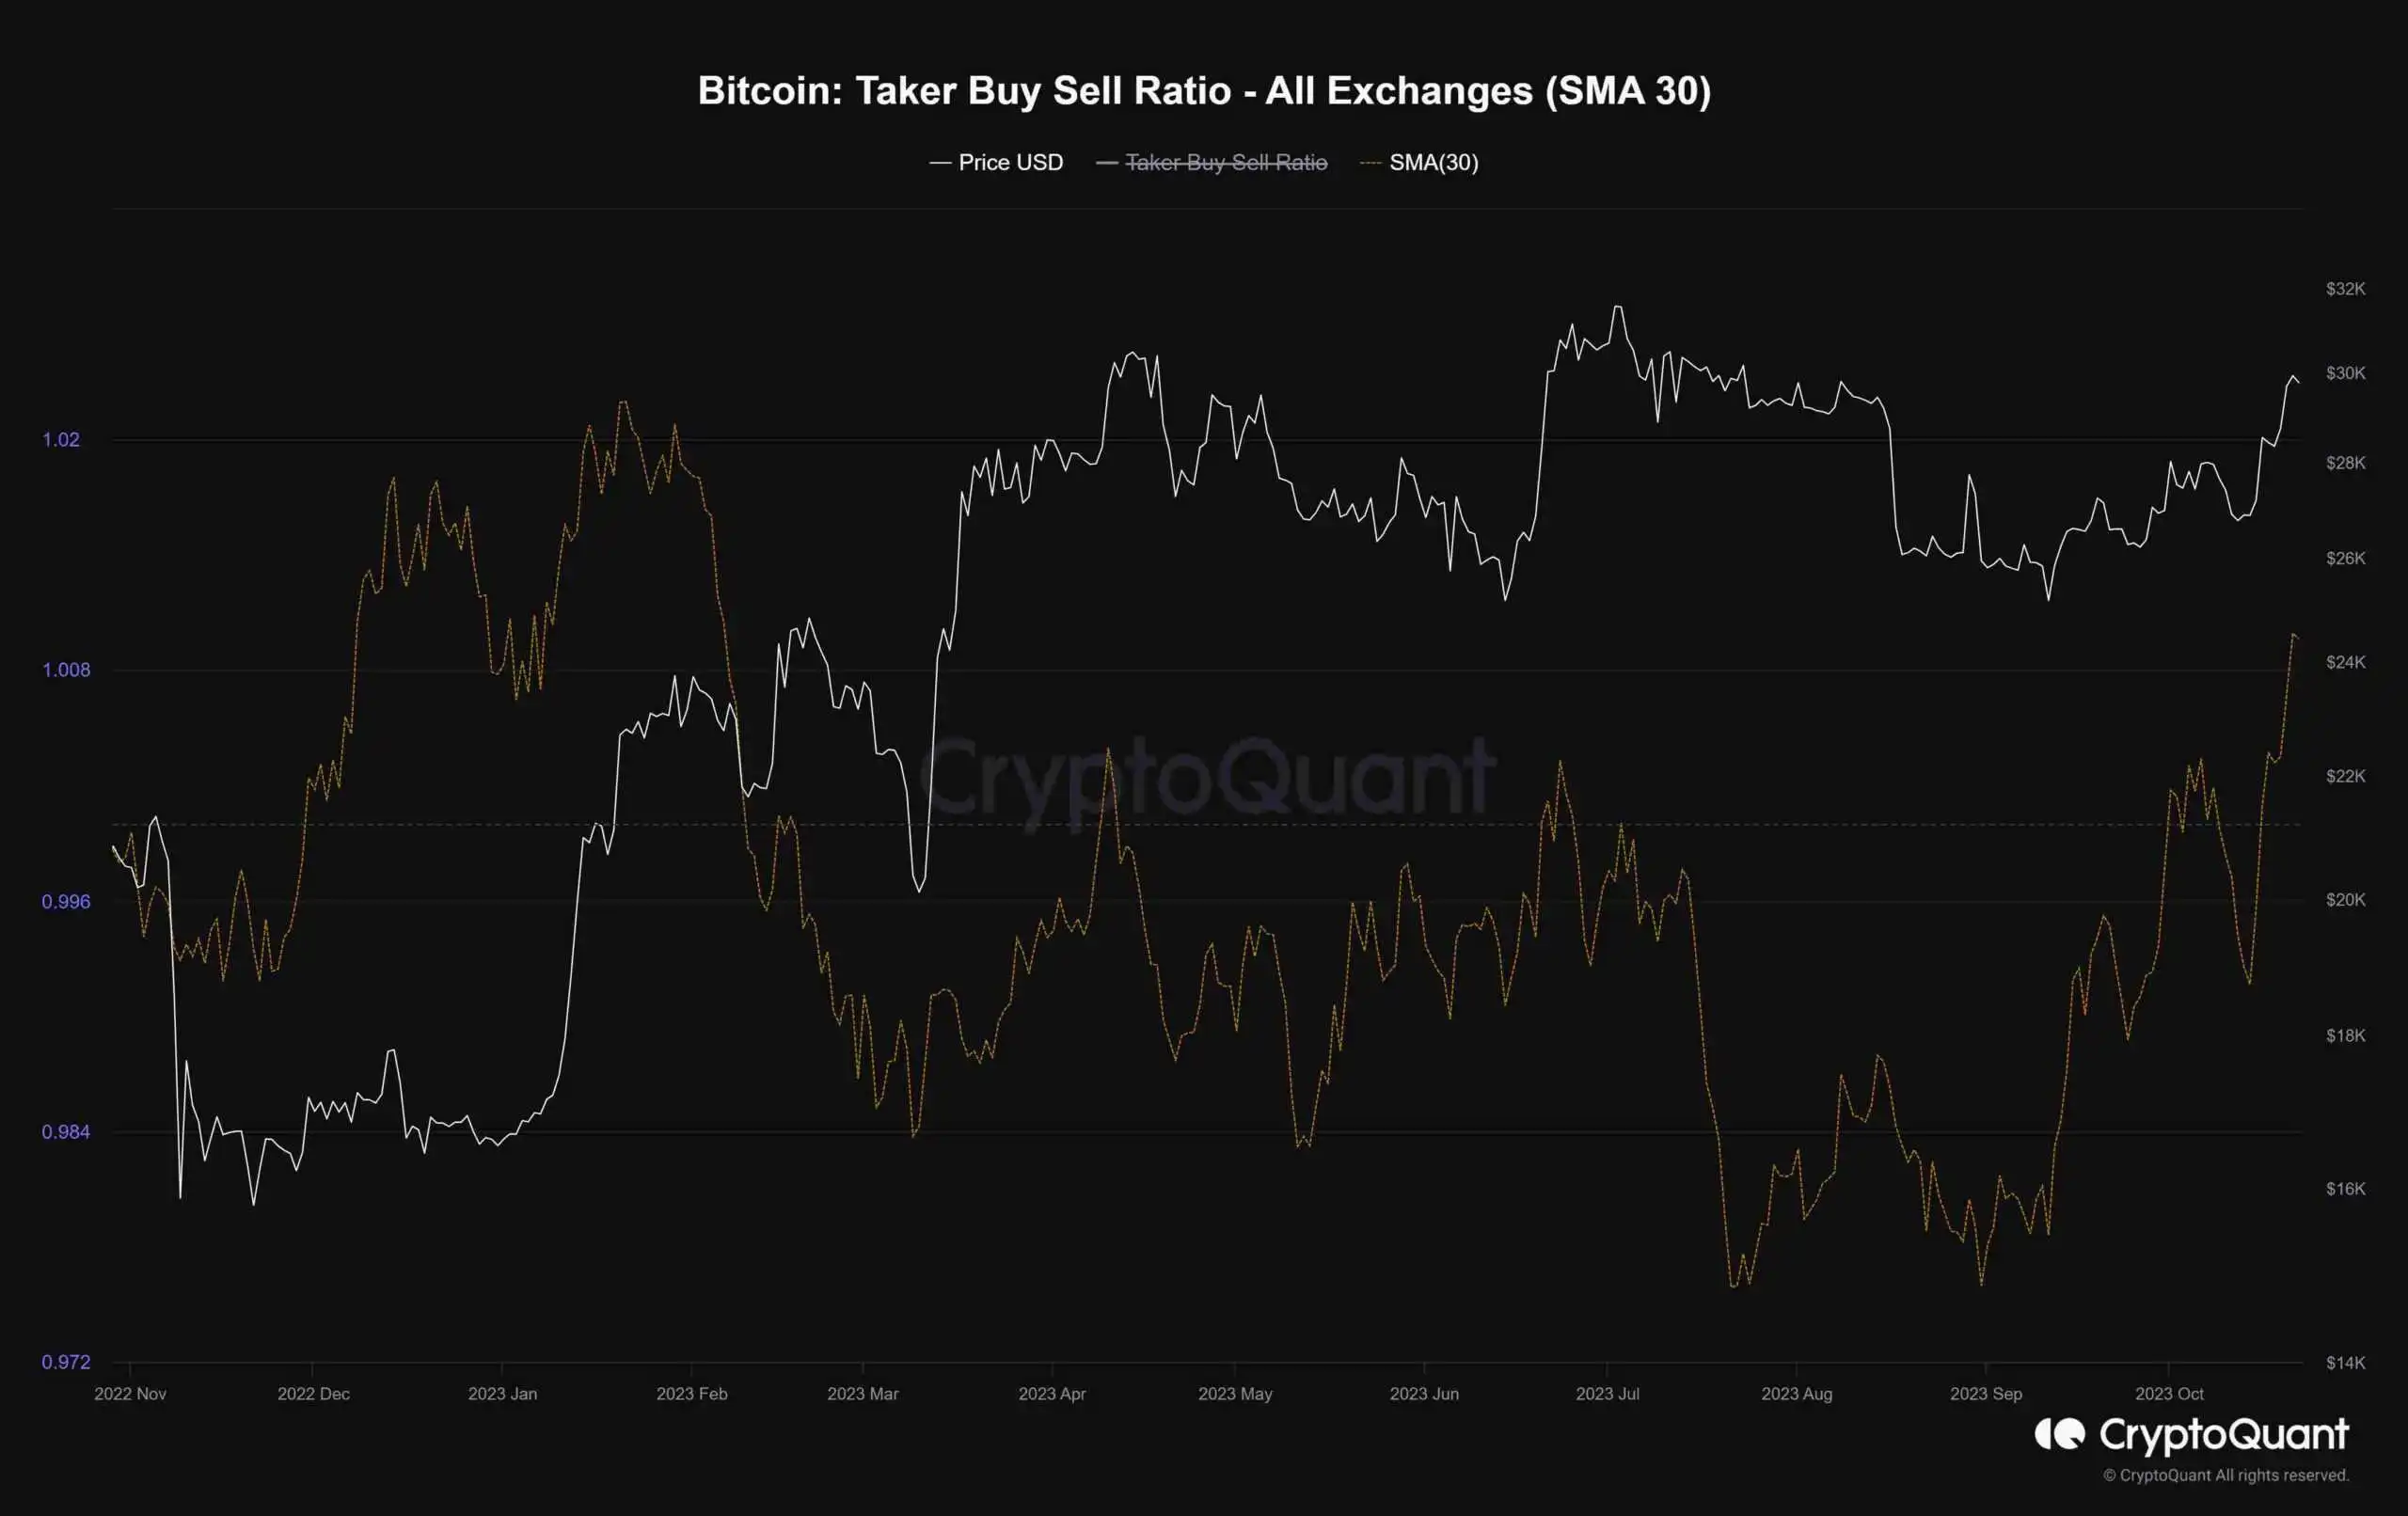
The chart below illustrates the 30-day moving average of the Bitcoin Taker Buy-Sell ratio, a vital metric for uating sentiment in the futures market. This metric helps determine whether buyers or sellers are uting more aggressive orders.
The chart shows that the taker buy-sell ratio has been steadily increasing, surpassing 1, indicating a prevailing bullish sentiment in the futures market. This uptrend aligns perfectly with Bitcoin’s recent impulsive surge, pushing toward the $30K resistance level.
If this metric continues trending above 1, a bullish continuation in the short term can be anticipated. However, if the ratio fails to maintain this momentum, any bullish momentum may be unsustainable, potentially leading to increased market volatility.
 Source: CryptoQuant
免責事項:このページの情報は第三者から提供される場合があり、Gateの見解または意見を代表するものではありません。このページに表示される内容は参考情報のみであり、いかなる金融、投資、または法律上の助言を構成するものではありません。Gateは情報の正確性または完全性を保証せず、当該情報の利用に起因するいかなる損失についても責任を負いません。仮想資産への投資は高いリスクを伴い、大きな価格変動の影響を受けます。投資元本の全額を失う可能性があります。関連するリスクを十分に理解したうえで、ご自身の財務状況およびリスク許容度に基づき慎重に判断してください。詳細は免責事項をご参照ください。
コメント
0/400
コメントなし