
Date: Fri, Dec 26, 2025 | 06:30 PM GMT
The broader cryptocurrency market has been navigating a period of choppy and uncertain price action over the past several weeks, a phase that began after the sharp market-wide sell-off on October 10. During that correction, Ethereum (ETH) dropped nearly 28% over the last 60 days, applying sustained pressure across the altcoin sector — including ether.fi (ETHFI).
ETHFI has mirrored this weakness, sliding more than 31% over the same period. However, despite the sharp downtrend, recent price behavior suggests selling pressure may be easing. The token is now trading near a historically significant demand zone, where buyers have repeatedly stepped in before — raising the possibility that ETHFI could be approaching an inflection point.
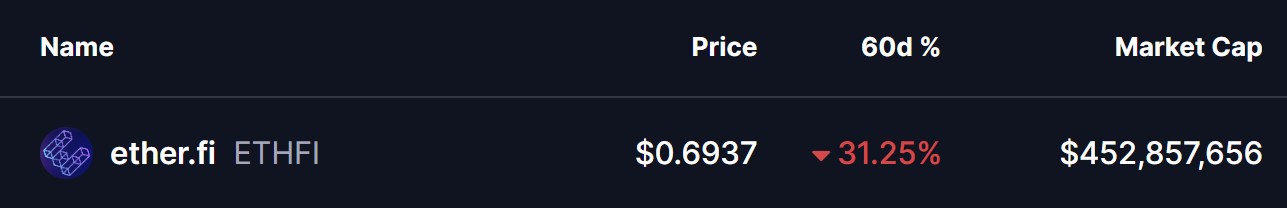
Source: Coinmarketcap
Double Bottom Pattern in Focus
On the daily timeframe, ETHFI appears to be forming a potential double-bottom structure — a classic reversal pattern that often signals exhaustion among sellers. The setup began after ETHFI was rejected from the $0.9233 resistance area, a move that triggered a sharp decline of nearly 28% and pushed price back toward the lower end of its range.
That sell-off dragged ETHFI into the $0.65 support zone, a level that has consistently acted as a strong demand area in the past. The chart now shows price revisiting this same region and stabilizing once again, suggesting buyers are actively defending it. The similarity between the first and second lows strengthens the case that a double-bottom base may be forming.
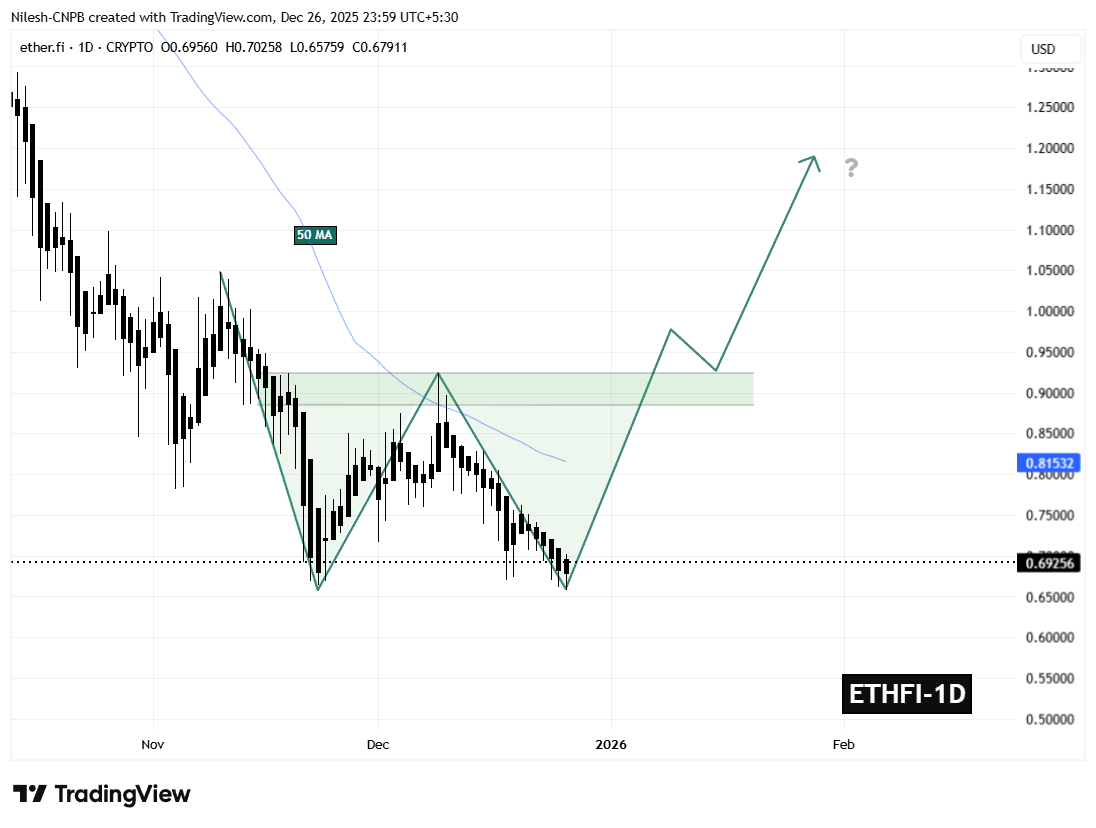
ETHFI Daily Chart/Coinsprobe (Source: Tradingview)
If this support continues to hold, the ongoing consolidation could mark the completion of the second bottom — a critical step in shifting momentum away from sellers and toward a potential trend reversal.
What’s Next for ETHFI?
The $0.65 support zone remains the most important level to monitor in the near term. As long as ETHFI holds above this area, the developing bullish structure remains valid and provides room for momentum to gradually rebuild.
On the upside, the first major challenge sits at the 50-day moving average near $0.8153. This level has repeatedly capped recovery attempts throughout the recent downtrend and now represents the initial test for buyers. A sustained move above this moving average would signal improving market structure and growing bullish confidence.
Beyond that, the $0.9233 neckline stands as the key confirmation level. A decisive breakout above this resistance would complete the double-bottom pattern and significantly strengthen the bullish outlook, potentially opening the door for a broader recovery move in the weeks ahead.
For now, ETHFI finds itself at a technically pivotal zone — one that could either reinforce the existing downtrend or mark the beginning of a meaningful rebound if buyers continue to defend support.
Disclaimer: The views and analysis presented in this article are for informational purposes only and reflect the author’s perspective, not financial advice. Technical patterns and indicators discussed are subject to market volatility and may or may not yield the anticipated results. Investors are advised to exercise caution, conduct independent research, and make decisions aligned with their individual risk tolerance.
Disclaimer: The information on this page may come from third parties and does not represent the views or opinions of Gate. The content displayed on this page is for reference only and does not constitute any financial, investment, or legal advice. Gate does not guarantee the accuracy or completeness of the information and shall not be liable for any losses arising from the use of this information. Virtual asset investments carry high risks and are subject to significant price volatility. You may lose all of your invested principal. Please fully understand the relevant risks and make prudent decisions based on your own financial situation and risk tolerance. For details, please refer to
Disclaimer.
Related Articles
Miners are no longer mining Bitcoin; they are selling electricity to AI.
Written by: Cathy, Plain Language Blockchain
Mining one Bitcoin costs $87,000. When sold, the market only pays you $67,000.
For each Bitcoin mined, you net a loss of $20,000. It’s not just losing on fees or electricity fluctuations; it’s a solid loss—losing $20,000 for every Bitcoin produced. This is the reality in March 2026. Data from Glassnode and MacroMicro both point to the same conclusion: Bitcoin mining, at current prices, is a losing business.
But miners aren’t just sitting around waiting to die. They’ve made a choice that the entire market didn’t expect—they’re stopping mining and selling electricity to AI.
Specifically, it’s not “stopping mining,” but rather emptying the Bitcoin treasury and pouring all funds into AI data centers, relegating mining to a side gig.
Since Bitcoin dropped from 126,000 in October 2025
PANews25m ago
Aptos unlocks $10.88 million worth of APT, but 69% of the supply is currently staked – which side will have the advantage?
After approving the proposal to limit the maximum supply of Aptos (APT) five days ago, this altcoin is now preparing for a new token unlock – a factor that could add volatility to the market.
Although APT has experienced a slight increase of about 1% in the past 24 hours, the long-term outlook appears less positive as volume
TapChiBitcoin36m ago
Trump says Iran war is almost over, BTC needs to hold $70,000. What do technicals say?
U.S. President Trump stated on March 10th that the Iran war is "almost over," leading to a cooling of geopolitical risk sentiment and driving cryptocurrencies like BTC to reverse and break above $70,000. Market expectations for the end date of the war have significantly increased, and risk assets are generally rising. Reflecting on the airstrike on February 28th, the market had wiped out $12.8 billion, and most indicators remain neutral with a key resistance at $74,000. Noticing that oil prices have fallen below $100, which may further support risk assets. Today's U.S. CPI data will influence market sentiment.
動區BlockTempo59m ago
Bitcoin faces short-term pressure approaching $70,000 ahead of US CPI data release
On March 11, Bitcoin price dropped over 2% due to market cautiousness. Economists expect US CPI data to be slightly higher than last month, although this data does not reflect the impact of rising oil prices, and Bitcoin's short-term response may remain stable. Tensions in the Middle East could lead to increased safe-haven demand. The market should pay attention to changes in key support and resistance levels to prepare for potential volatility.
GateNews1h ago
Arthur Hayes warns: Bitcoin may dip below $60,000 in the short term, but still has the potential to reach $500,000 in the long term
Cryptocurrency industry executive Arthur Hayes warns that Bitcoin may experience a short-term pullback to $60,000, but remains optimistic about its long-term potential, expecting the price to reach $500,000 to $750,000 by the end of 2026. He emphasizes that geopolitical tensions and high interest rates will influence BTC's movement, and investors should be cautious in responding to short-term fluctuations.
GateNews1h ago
Ethereum Price News: Network Activity Hits Record High, Why Is ETH Price Still Under Pressure?
Ethereum network activity hits a record high, but prices have not kept pace, with daily active addresses approaching 2 million. Capital flow has become the main driving force, with inflows to trading platforms surpassing Bitcoin. Although ETH accounts for 52% of stablecoin supply, the market remains focused on capital movement. It is expected that by 2026, ETH prices could rebound to $3,000.
GateNews1h ago