
Date: Fri, Dec 26, 2025 | 06:30 PM GMT
The broader cryptocurrency market has been navigating a period of choppy and uncertain price action over the past several weeks, a phase that began after the sharp market-wide sell-off on October 10. During that correction, Ethereum (ETH) dropped nearly 28% over the last 60 days, applying sustained pressure across the altcoin sector — including ether.fi (ETHFI).
ETHFI has mirrored this weakness, sliding more than 31% over the same period. However, despite the sharp downtrend, recent price behavior suggests selling pressure may be easing. The token is now trading near a historically significant demand zone, where buyers have repeatedly stepped in before — raising the possibility that ETHFI could be approaching an inflection point.
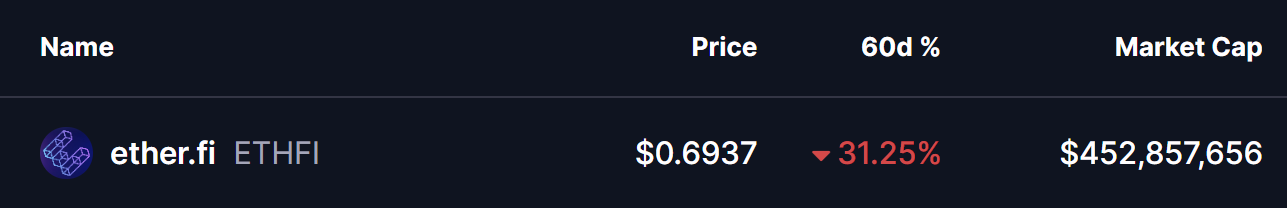
Source: Coinmarketcap
Double Bottom Pattern in Focus
On the daily timeframe, ETHFI appears to be forming a potential double-bottom structure — a classic reversal pattern that often signals exhaustion among sellers. The setup began after ETHFI was rejected from the $0.9233 resistance area, a move that triggered a sharp decline of nearly 28% and pushed price back toward the lower end of its range.
That sell-off dragged ETHFI into the $0.65 support zone, a level that has consistently acted as a strong demand area in the past. The chart now shows price revisiting this same region and stabilizing once again, suggesting buyers are actively defending it. The similarity between the first and second lows strengthens the case that a double-bottom base may be forming.
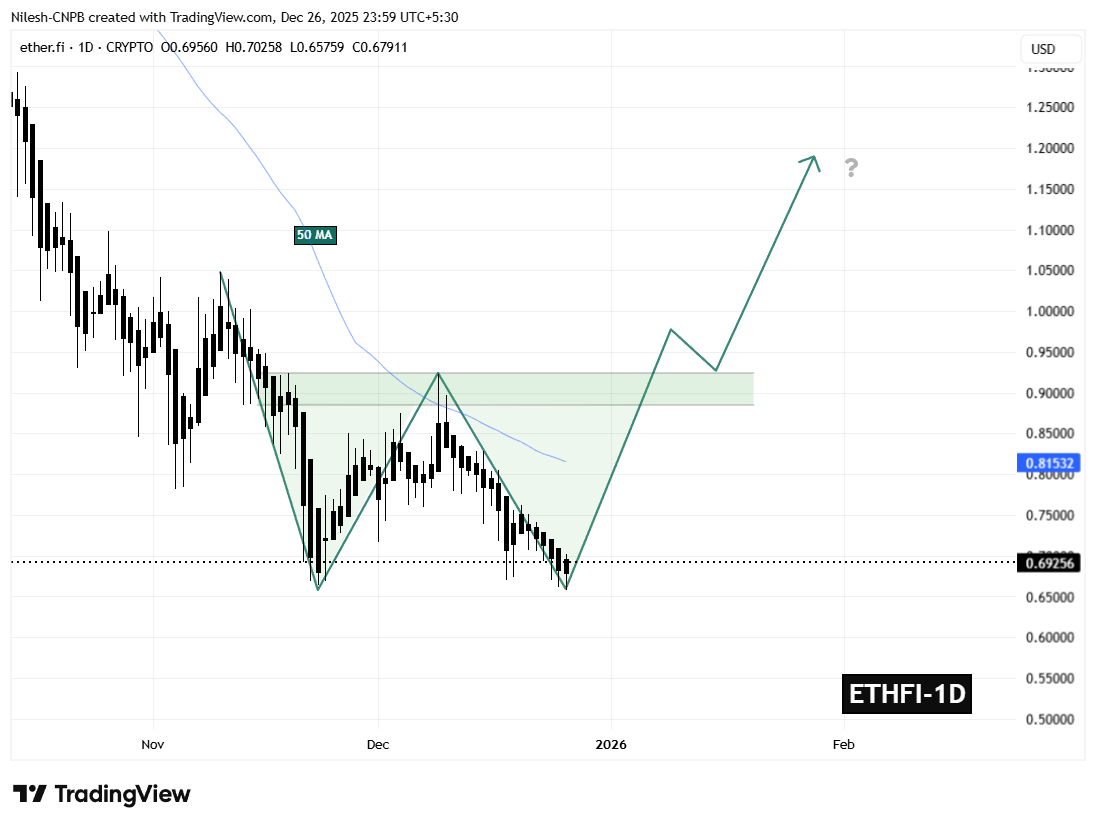
ETHFI Daily Chart/Coinsprobe (Source: Tradingview)
If this support continues to hold, the ongoing consolidation could mark the completion of the second bottom — a critical step in shifting momentum away from sellers and toward a potential trend reversal.
What’s Next for ETHFI?
The $0.65 support zone remains the most important level to monitor in the near term. As long as ETHFI holds above this area, the developing bullish structure remains valid and provides room for momentum to gradually rebuild.
On the upside, the first major challenge sits at the 50-day moving average near $0.8153. This level has repeatedly capped recovery attempts throughout the recent downtrend and now represents the initial test for buyers. A sustained move above this moving average would signal improving market structure and growing bullish confidence.
Beyond that, the $0.9233 neckline stands as the key confirmation level. A decisive breakout above this resistance would complete the double-bottom pattern and significantly strengthen the bullish outlook, potentially opening the door for a broader recovery move in the weeks ahead.
For now, ETHFI finds itself at a technically pivotal zone — one that could either reinforce the existing downtrend or mark the beginning of a meaningful rebound if buyers continue to defend support.
Disclaimer: The views and analysis presented in this article are for informational purposes only and reflect the author’s perspective, not financial advice. Technical patterns and indicators discussed are subject to market volatility and may or may not yield the anticipated results. Investors are advised to exercise caution, conduct independent research, and make decisions aligned with their individual risk tolerance.
Disclaimer: The information on this page may come from third parties and does not represent the views or opinions of Gate. The content displayed on this page is for reference only and does not constitute any financial, investment, or legal advice. Gate does not guarantee the accuracy or completeness of the information and shall not be liable for any losses arising from the use of this information. Virtual asset investments carry high risks and are subject to significant price volatility. You may lose all of your invested principal. Please fully understand the relevant risks and make prudent decisions based on your own financial situation and risk tolerance. For details, please refer to
Disclaimer.
Related Articles
Ethena Drops 15% from Weekly High — Are Deeper Losses Coming?
Price Drop: ENA falls 15% from $0.12 weekly high as sellers regain control.
Market Trend: Long-term bearish signals dominate despite short-term bullish momentum and volume spikes.
Next Support: Traders watch $0.085 as the key level for potential further losses or bounce.
Ethena —ENA,
CryptoNewsLand36m ago
Wintermute: From a 12-18 month perspective, BTC's current price is quite attractive
Wintermute analyzes market conditions, believing that macro factors dominate, and cryptocurrencies are showing resilience with weakened correlation to stocks. Currently, the leverage in the cryptocurrency market is relatively low, resulting in less selling pressure. Although there is still room for further decline, deleveraging seems to have passed, and whether the future performance can be sustained remains to be seen. The FOMC meeting is a recent catalyst.
GateNews46m ago
PI Token Maintains Bullish Trend as Anticipation for Pi Day Grows
PI token trades above $0.21 after rallying over 25% in the past 7 days as anticipation for the upcoming Pi Day on March 14 grows.
PiScan recorded 3 million PI deposits to exchanges in 24 hours, suggesting near-term profit taking which could reverse the bullish trend.
Pi Network’s PI token tr
CryptoNewsFlash51m ago
Glassnode Data: Most XRP Supply in Loss, What It Means for Investors
Glassnode data shows 36.8 billion XRP, nearly 60% of the circulating supply, is held at a loss, with unrealized losses reaching $50.8 billion.
XRP traded near $1.34, while futures volume jumped on BitMEX and Binance as ETF outflows and weak spot activity kept pressure on price.
Glassnode dat
CryptoNewsFlash1h ago
Is the 'Bitcoin Pyramid' Cracking? Peter Schiff Predicts Forced BTC Liquidations by MicroStrategy - U.Today
Peter Schiff criticizes Michael Saylor's Bitcoin strategy, labeling it a "Bitcoin pyramid." He argues that Saylor’s preferred stock, STRC, may force the first Bitcoin sale due to its dependence on cash from new investments or reserves to pay dividends, risking liquidation.
UToday1h ago
Pi Network Approaches Key Price Level — Breakout or Bull Trap Ahead?
Price Action: PI trades near $0.20 supply zone after short-term 5% rally.
Technical Signals: H4 chart bullish, but higher timeframe trends remain bearish.
Trading Strategy: Watch $0.1857 support and $0.216 resistance for breakout or bull trap confirmation.
Pi Network has shown
CryptoNewsLand1h ago