
Date: Fri, Dec 26, 2025 | 06:30 PM GMT
The broader cryptocurrency market has been navigating a period of choppy and uncertain price action over the past several weeks, a phase that began after the sharp market-wide sell-off on October 10. During that correction, Ethereum (ETH) dropped nearly 28% over the last 60 days, applying sustained pressure across the altcoin sector — including ether.fi (ETHFI).
ETHFI has mirrored this weakness, sliding more than 31% over the same period. However, despite the sharp downtrend, recent price behavior suggests selling pressure may be easing. The token is now trading near a historically significant demand zone, where buyers have repeatedly stepped in before — raising the possibility that ETHFI could be approaching an inflection point.
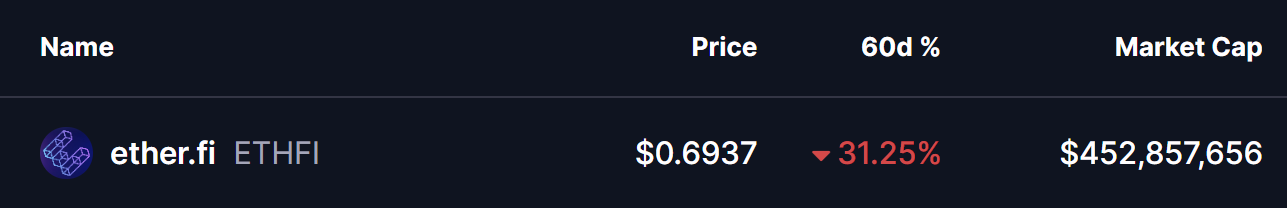
Source: Coinmarketcap
Double Bottom Pattern in Focus
On the daily timeframe, ETHFI appears to be forming a potential double-bottom structure — a classic reversal pattern that often signals exhaustion among sellers. The setup began after ETHFI was rejected from the $0.9233 resistance area, a move that triggered a sharp decline of nearly 28% and pushed price back toward the lower end of its range.
That sell-off dragged ETHFI into the $0.65 support zone, a level that has consistently acted as a strong demand area in the past. The chart now shows price revisiting this same region and stabilizing once again, suggesting buyers are actively defending it. The similarity between the first and second lows strengthens the case that a double-bottom base may be forming.
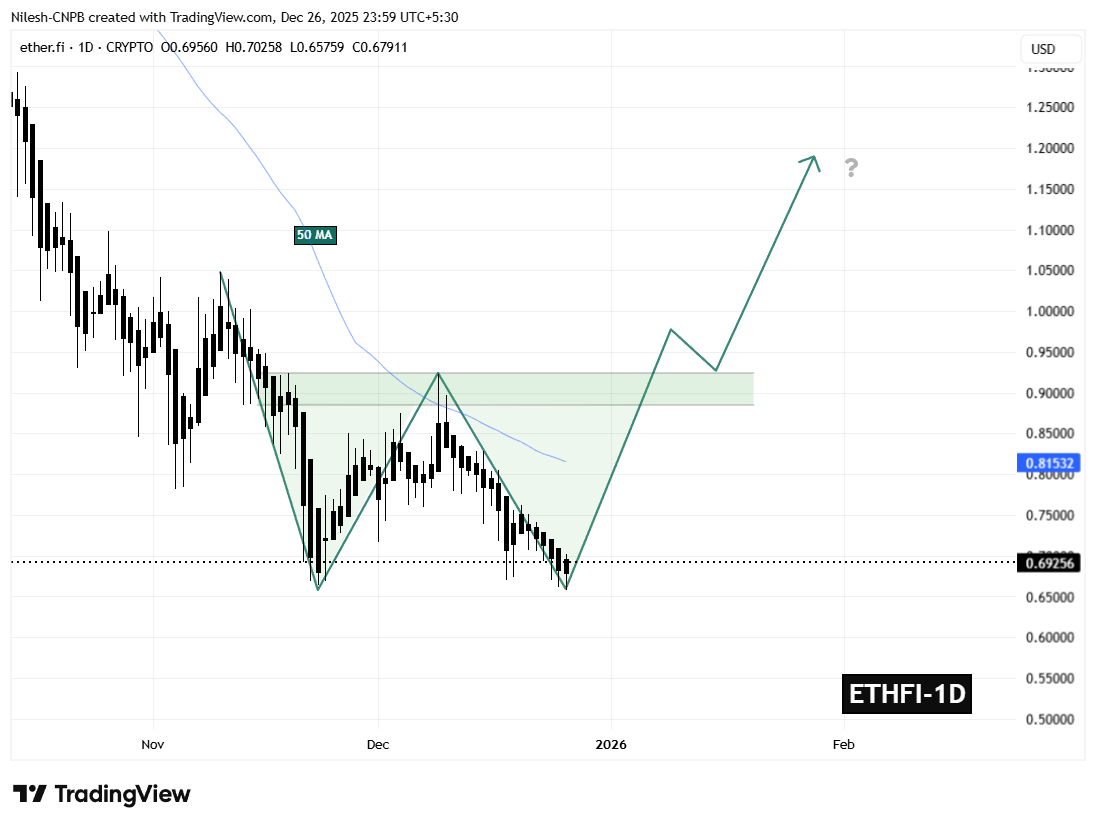
ETHFI Daily Chart/Coinsprobe (Source: Tradingview)
If this support continues to hold, the ongoing consolidation could mark the completion of the second bottom — a critical step in shifting momentum away from sellers and toward a potential trend reversal.
What’s Next for ETHFI?
The $0.65 support zone remains the most important level to monitor in the near term. As long as ETHFI holds above this area, the developing bullish structure remains valid and provides room for momentum to gradually rebuild.
On the upside, the first major challenge sits at the 50-day moving average near $0.8153. This level has repeatedly capped recovery attempts throughout the recent downtrend and now represents the initial test for buyers. A sustained move above this moving average would signal improving market structure and growing bullish confidence.
Beyond that, the $0.9233 neckline stands as the key confirmation level. A decisive breakout above this resistance would complete the double-bottom pattern and significantly strengthen the bullish outlook, potentially opening the door for a broader recovery move in the weeks ahead.
For now, ETHFI finds itself at a technically pivotal zone — one that could either reinforce the existing downtrend or mark the beginning of a meaningful rebound if buyers continue to defend support.
Disclaimer: The views and analysis presented in this article are for informational purposes only and reflect the author’s perspective, not financial advice. Technical patterns and indicators discussed are subject to market volatility and may or may not yield the anticipated results. Investors are advised to exercise caution, conduct independent research, and make decisions aligned with their individual risk tolerance.
Disclaimer: The information on this page may come from third parties and does not represent the views or opinions of Gate. The content displayed on this page is for reference only and does not constitute any financial, investment, or legal advice. Gate does not guarantee the accuracy or completeness of the information and shall not be liable for any losses arising from the use of this information. Virtual asset investments carry high risks and are subject to significant price volatility. You may lose all of your invested principal. Please fully understand the relevant risks and make prudent decisions based on your own financial situation and risk tolerance. For details, please refer to
Disclaimer.
Related Articles
BTC broke through $74,000 this week, with short-term holders' profits surging to $18.4 million per hour.
Gate News reported that on March 17, according to Glassnode data, Bitcoin price made a modest breakthrough above $74,000 this week, with short-term holder realized profit (STH-Realized Profit, 12-hour simple moving average) surging to $18.4 million per hour. This is consistent with the pattern observed in February: short-term holders continuously drain momentum from each bounce at the $70,000 level, absorbing upward momentum before any real breakout can form.
GateNews1h ago
Gold Shop Gold Purchase Loss 8%! Real Test "On-Chain Gold" Token PAXG Total Fees Crush Taiwan Bank Passbook
There are three ways for Taiwanese people to buy gold: Taiwan Bank Gold Passbook, gold shops, and on-chain gold token PAXG. Surveys show that despite PAXG appearing complex, its fees are actually the lowest, at approximately 1.2-3.2%. Gold shop transaction spreads reach as high as 8%, while Taiwan Bank is 2.3%. PAXG offers 24-hour liquidity, but the threshold for redeeming physical gold is high. Your choice should consider security, fees, and liquidity needs.
動區BlockTempo1h ago
ETH Price Chart Sees Bullish Pattern on Repeat, Is $30,000 ETH ATH a Possibility?
Pioneer altcoin ETH price chart sees bullish pattern on repeat.
Another expert expects $30,000 ATH target for ETH.
How high can the price of ETH go this year?
The crypto market grows steadily bullish once again as the price of Bitcoin (BTC) reclaims prices above the $74,00 price range an
CryptoNewsLand1h ago
Crypto Analyst Points out a Bullish Possibility for XRP Price
Crypto analyst Ali Charts predicts XRP could rise to $1.85, following a recent 3.25% increase. Despite cautious community sentiment, the token's price may surge in the coming months, although a correction to $1.49 is also anticipated.
TheNewsCrypto1h ago
Crypto Fear & Greed Index Rises to 28, Exits Extreme Fear Zone
Gate News bot message, the Crypto Fear & Greed Index climbed to 28 today, up from 23 yesterday and 13 last week, transitioning from Extreme Fear into Fear territory. Market sentiment demonstrates early signs of recovery, while participants maintain a cautious stance with limited risk appetite.
GateNews2h ago
