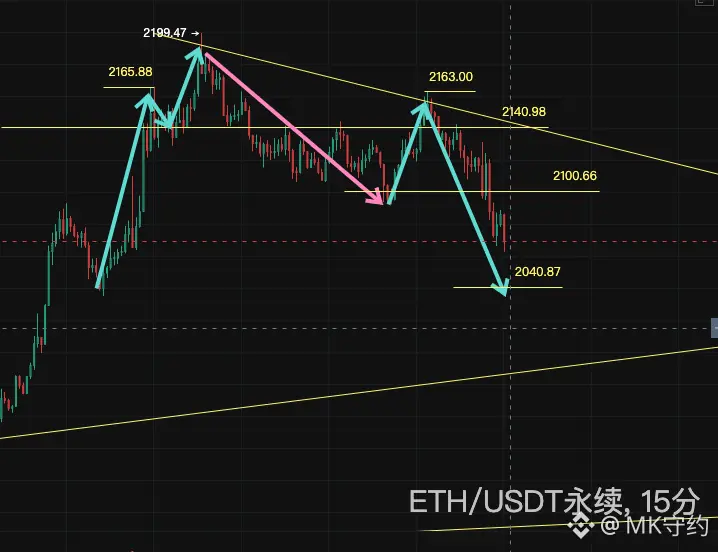
$ETH is live analyzing the market, and the trend is clear at a glance.
Looking at the smaller timeframe, the pink line—the downward test support—has broken, indicating that the previous rally to 2200 and the breakout trend are invalid.
Therefore, a rebound around 2155 can be considered for shorting.
The formation is a head and shoulders bottom, with the right shoulder forming. The right shoulder point is below 2165, so can we consider trading around 2165? Short below 2165, set a stop loss above 2165.
The first target below is 🎯 at 2100, so reduce your position—close half your positio