#95%ofAltsBelow200-daySMA
95% of Altcoins Still Below Their 200-Day SMA — Extreme Weakness or Classic Setup for Reversal?
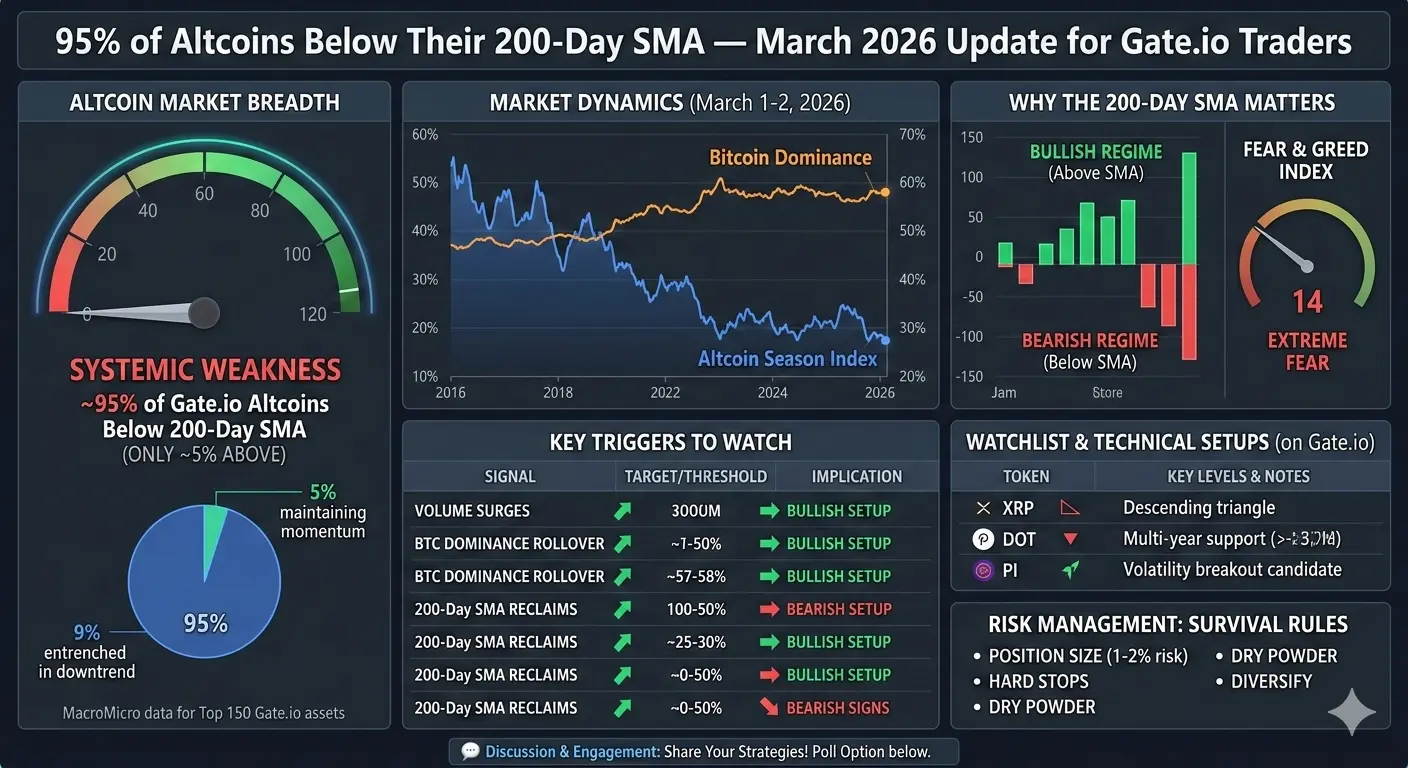
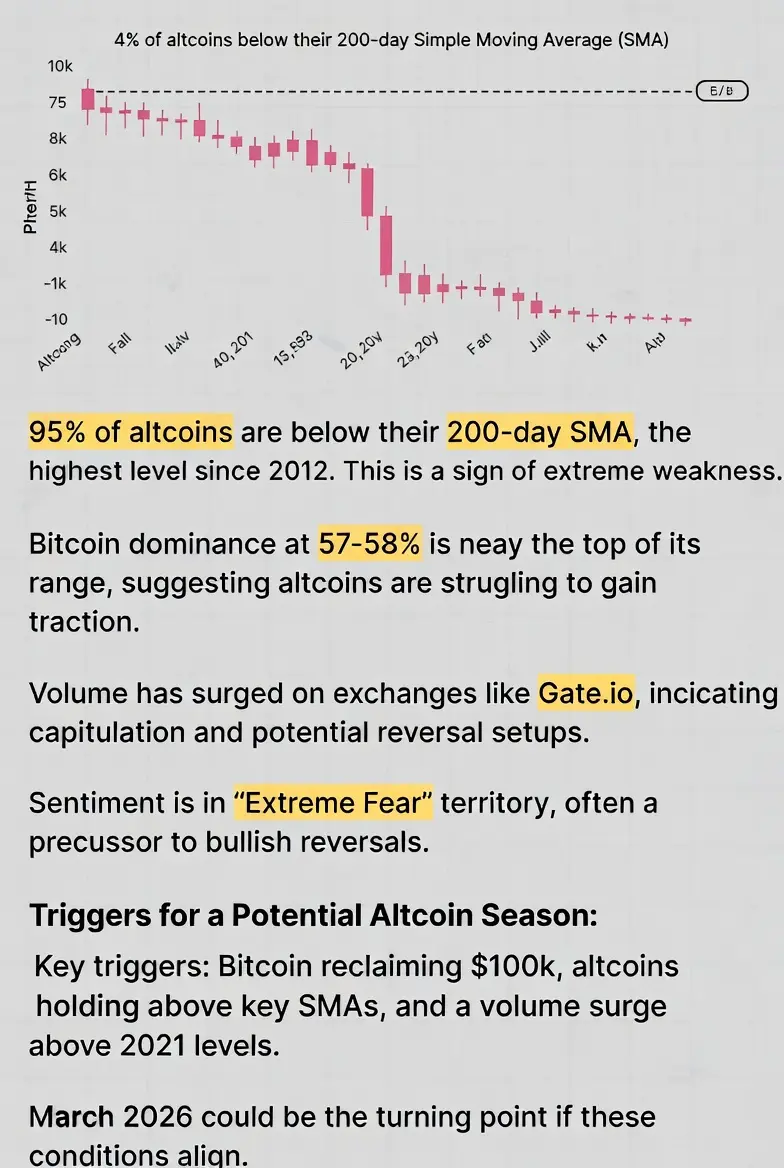
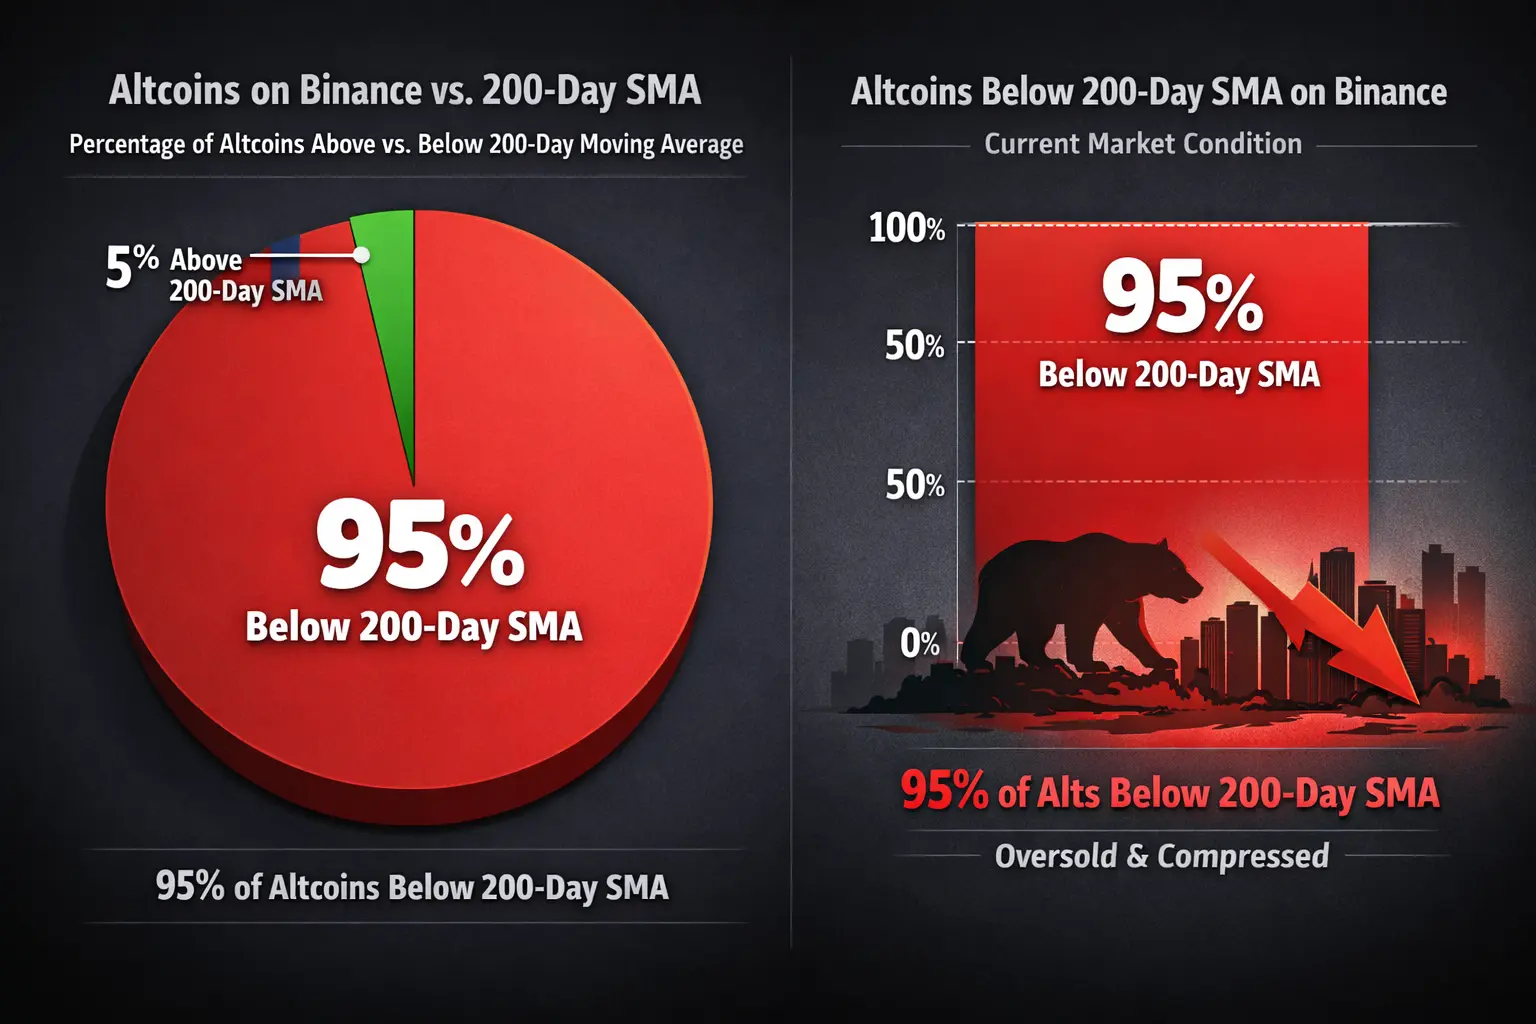
(Early March 2026 update: Only ~5% of Gate.io-listed altcoins trade above the 200-day SMA. Among the top 150 Gate.io crypto assets, only ~4.7–6.7% are above this key long-term trend line, according to MacroMicro data.)
1️⃣ The Current Reality — Market Breadth at Historic Lows
The altcoin market is experiencing one of the most extreme breadth contractions in recent cycles, indicating deep systemic weakness across nearly all altcoins. As of March 1–2, 2026:
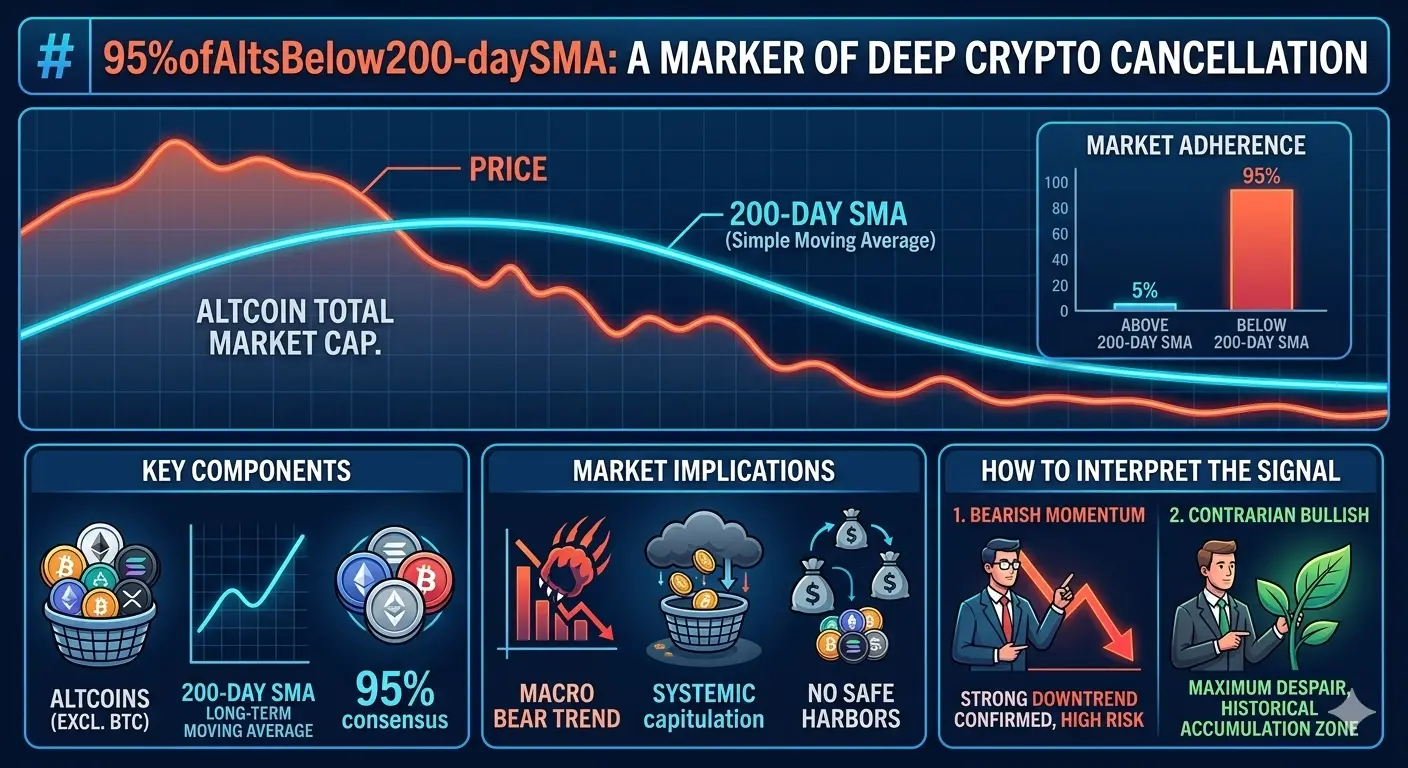
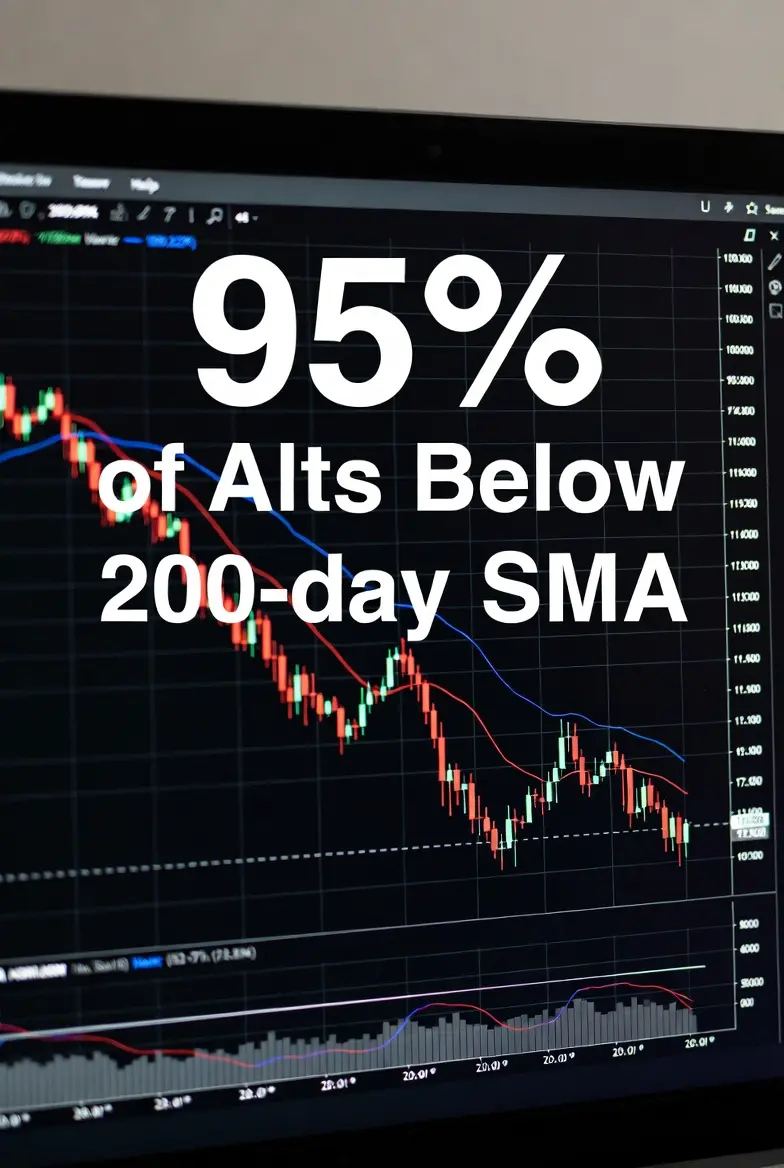
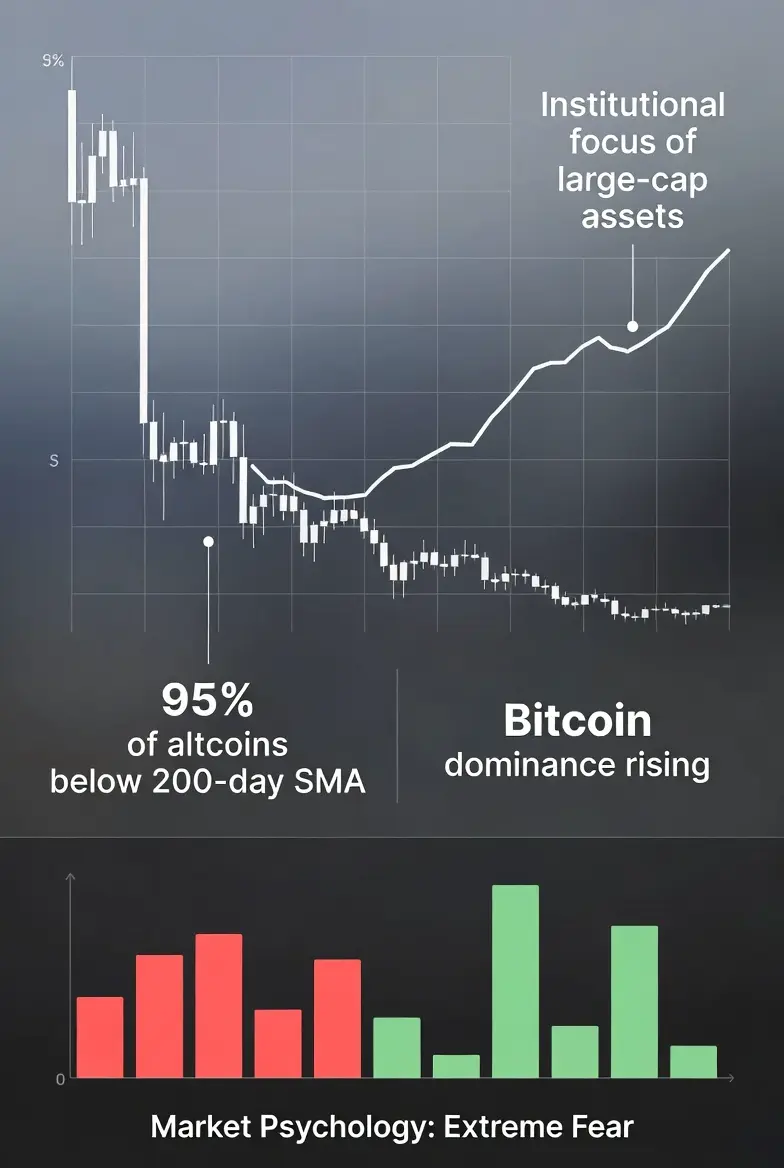
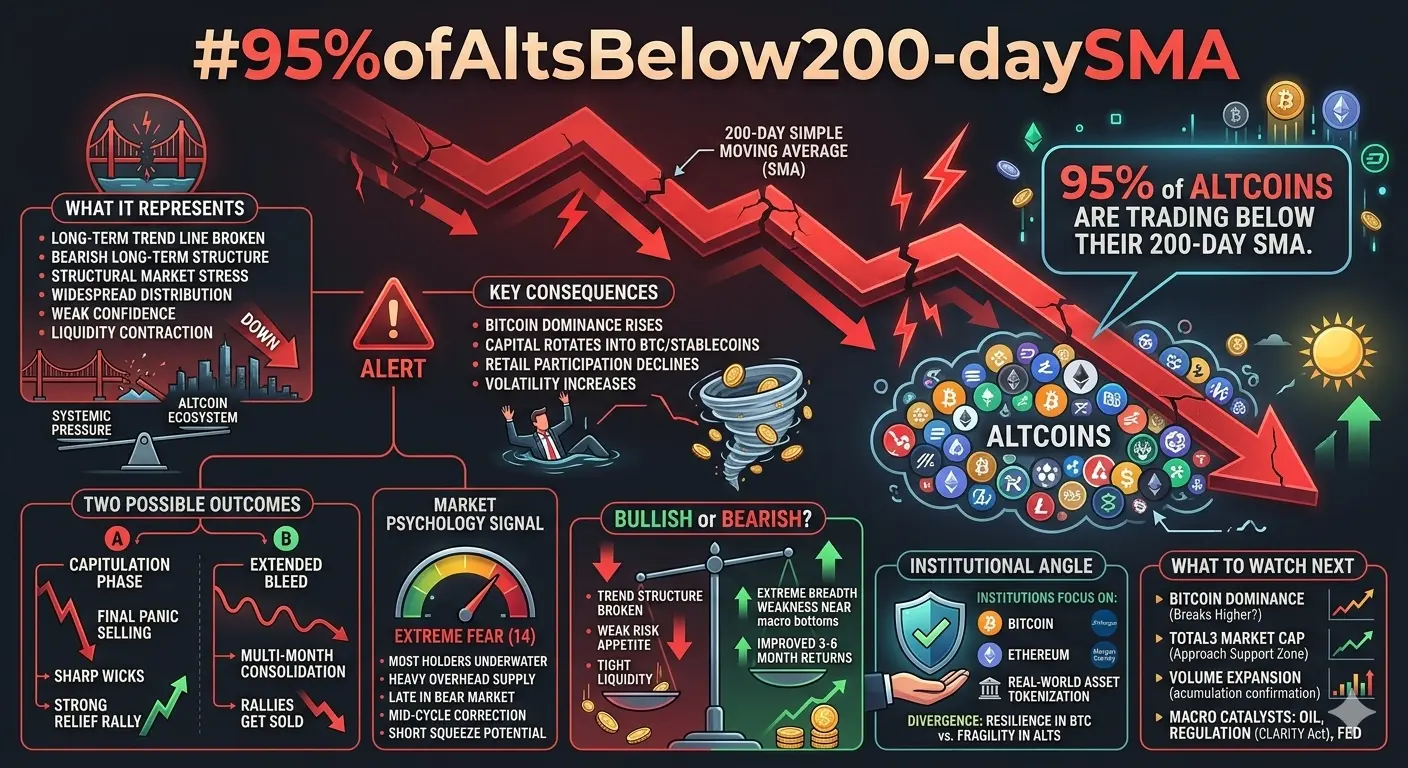
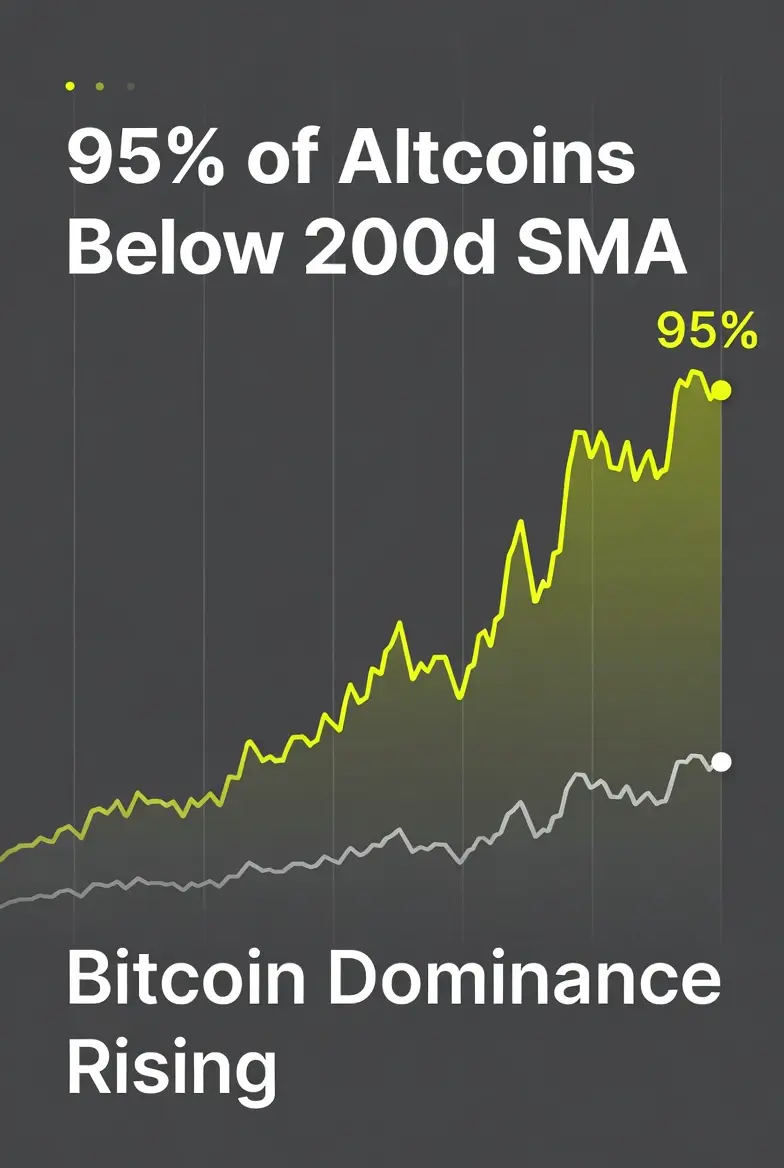
~95% of Gate.io-listed altcoins trade below their 200-day SMA, showing that nearly the entire sector is entrenched in a long-term downtrend.
Only ~5% of altcoins remain above the 200-day SMA, demonstrating that very few projects are maintaining any upward momentum.
Short-term metrics reflect similarly constrained conditions, with only 10–12% of cryptocurrencies above their 50-day moving average.
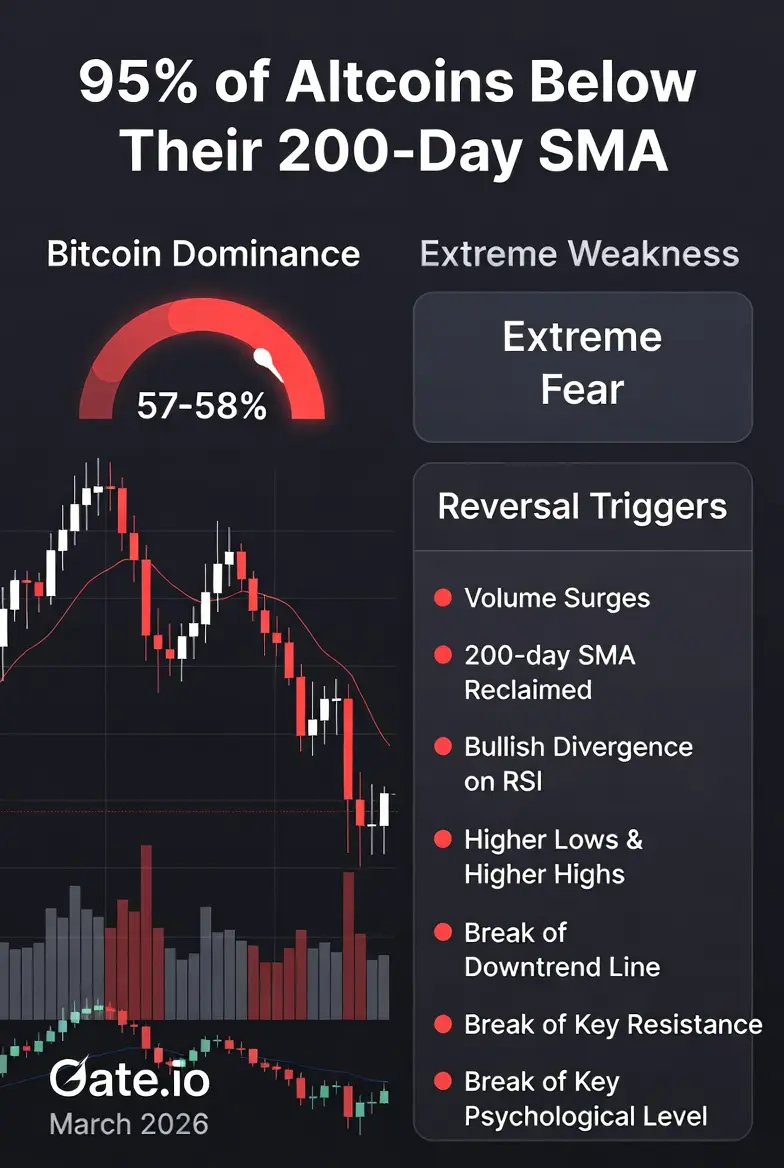
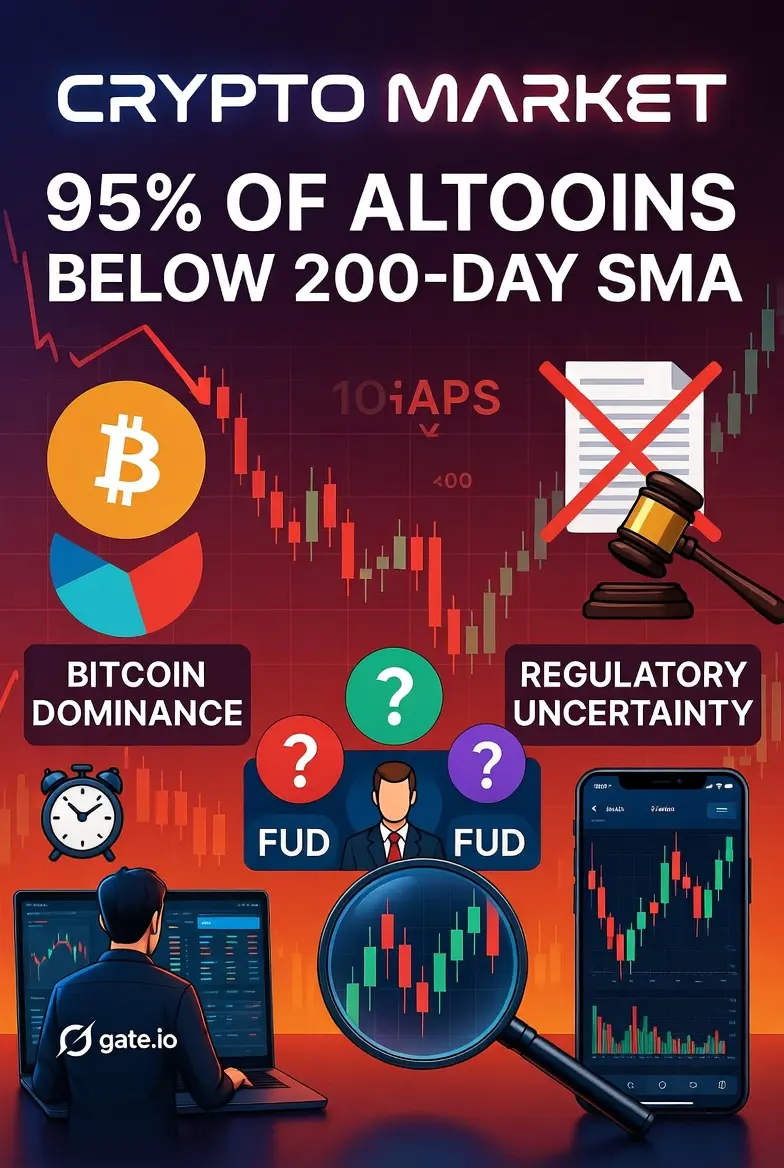
The Altcoin Season Index is in the low 20s–30s, far below the 75 threshold typically required to confirm an altseason. Bitcoin dominance on Gate.io sits elevated at ~57–58%, reinforcing a “BTC season” environment where altcoins underperform relative to Bitcoin.
The altcoin market capitalization (TOTAL2, excluding BTC) remains deeply suppressed, struggling to hold major long-term supports such as the 50-week and 200-week EMAs. Many mid-cap and small-cap altcoins are still down 70–95% from their cycle highs, highlighting the severity of this drawdown.
This is not isolated weakness; it is systemic capitulation, with market breadth readings signaling a level of oversold pressure rarely seen in recent years. Historically, such extreme conditions have coincided with the early phases of significant altcoin rotations once key triggers align.
2️⃣ Why the 200-Day SMA Matters — A Critical Market Benchmark
The 200-day Simple Moving Average (SMA) is one of the most respected trend filters in both crypto and traditional financial markets. Its significance lies in its ability to distinguish between risk-on and risk-off regimes:
Trading above the 200-day SMA typically indicates a long-term uptrend and institutional comfort, signaling a bullish regime.
Trading below the 200-day SMA generally reflects a prolonged downtrend or bear market conditions, indicating risk-off sentiment.
When 90–95% of altcoins remain below the 200-day SMA for an extended period, it is historically a classic contrarian extreme, often marking the exhaustion point of retail participation and the beginning of accumulation phases by long-term holders.
Historical context based on previous Gate.io cycles:
Cycle
Breadth <15% Duration
Outcome
Late 2018 bear market
~4–5 months
Sharp altcoin rotation after BTC stabilized
Early 2022 crash
~5 months
Altcoins surged once BTC dominance rolled over
Current down-leg
~5 months (Dec 2025–Mar 2026)
Potential for early recovery when structural triggers align
Sentiment overlay: The Crypto Fear & Greed Index currently sits at 14 (Extreme Fear). Historically, this is the peak despair zone, a phase where retail traders capitulate and smart capital often begins to quietly accumulate.
3️⃣ Key Triggers to Watch — Signals That Could Indicate a Turn
Entering positions prematurely in this environment is highly risky. Traders and analysts should focus on structural catalysts that historically precede meaningful reversals. Key signals include:
Volume Surges
A 2–5× surge in trading volume on alt/BTC or alt/USDT pairs on Gate.io, especially when accompanied by strong green closes, is typically the first real indication that demand is returning. Such spikes often mark the initial signs of buying pressure after prolonged capitulation.
Bitcoin Dominance Rollover
BTC dominance (~57–58%) is an important metric to monitor:
A stall or rejection near 58–59% could signal an impending rotation of capital into altcoins.
A decline below 55–56% historically acts as a textbook trigger for capital rotation from BTC into the broader altcoin market.
Mass Reclaim of the 200-Day SMA
When 20–30% or more of major altcoins on Gate.io flip back above the 200-day SMA with conviction volume, this often signals the start of a broader recovery phase. Early green without breadth confirmation should be interpreted cautiously, as fakeouts are common in distressed markets.
Relative Strength Plays
Some altcoins are already showing early decoupling from Bitcoin, which can be monitored for potential reversal setups:
Symbol
Technical Setup
Key Levels / Notes
XRP
Compressed at descending triangle apex
~$1.38–$1.40; breakout target $1.60–$2.00+
Polkadot (DOT)
Near multi-year support
Favorable risk-adjusted setup for accumulation
Pi Network (PI)
High-volatility breakout candidate
Reclaiming short-term EMAs after deep drawdown
Select Layer-1 / DeFi tokens
Inverse head-and-shoulders or forming golden crosses
Oversold RSI on weekly charts suggests early reversal potential
On-Chain & Market Extremes
Deeply negative funding rates on Gate.io altcoin pairs indicate strong selling pressure but also potential for short squeeze rallies.
Whale accumulation in select altcoins signals institutional positioning at discounted levels.
Oversold weekly RSI levels across multiple altcoins are historically reliable precursors to sharp mean-reversion rallies.
4️⃣ Risk Management — This Environment Demands Discipline
Altcoins remain high-beta instruments that amplify BTC moves. Key risks include:
Assets that appear cheap can continue to decline significantly. Many altcoins remain 70–95% below prior cycle highs, and further declines of 50% or more are possible in extreme washout scenarios.
Fake rallies and bull traps are common; early green often fades aggressively.
Leveraged positions are particularly vulnerable; small market swings of 3–5% can trigger liquidations.
Macro or geopolitical risks could extend altcoin underperformance.
Recommended survival rules:
Keep position size small (1–2% risk per trade).
Maintain hard stops below weekly or monthly support levels.
Retain significant dry powder — the best entries often appear after confirmation of a structural reversal.
Diversify across uncorrelated assets; avoid concentrating risk in a single narrative or sector.
5️⃣ Discussion & Engagement Prompts
Traders can use these questions to foster dialogue and assess market sentiment:
“95% of altcoins below 200-day SMA and Extreme Fear at 14 — are you waiting for BTC.D rollover and volume confirmation, or already accumulating select Gate.io names?”
“We are at the tail end of the typical 5-month sub-15% breadth window. Do you expect a March reversal, or more grinding weakness?”
Poll: With 95% of altcoins trading underwater on Gate.io, which strategy do you prefer?
(A) Patience for structural signals
(B) Hunting generational lows now
(C) BTC-only exposure until proven otherwise
“Extreme oversold breadth plus a 5-month historical minimum — is this a setup for violent rotation, or early-stage continuation of the bear trend?”
6️⃣ Closing Summary & Outlook
95% below 200-day SMA represents peak altcoin pain and a textbook contrarian extreme.
We are currently in a Bitcoin-dominant regime, with altcoins deeply oversold and widely hated.
March 2026 may be a pivotal inflection point, given the end of the 5-month weakness window, extreme Fear sentiment, and early relative strength hints in select altcoins.
Confirmation remains critical — nothing is guaranteed.
Are you waiting for 200-day SMA reclaims, quietly accumulating Gate.io-listed altcoins, or remaining in BTC/stablecoins?
Drop your strategies, watchlists, or favorite reversal candidates to compare insights and market perspective.
Optional next step: A curated list of 5–8 Gate.io altcoins, showing distance to 200-day SMA, key levels, and potential upside, would make this fully actionable for traders.
✅ Key Takeaways
Extreme systemic weakness across nearly all altcoins.
Contrarian signals suggest potential early rotation once BTC dominance softens.
Watch BTC.D, volume spikes, 200-day SMA reclaims, and relative strength setups.
Patience and risk management are paramount — the best entries often come after confirmation, not at despair extremes.
95% of Altcoins Still Below Their 200-Day SMA — Extreme Weakness or Classic Setup for Reversal?
(Early March 2026 update: Only ~5% of Gate.io-listed altcoins trade above the 200-day SMA. Among the top 150 Gate.io crypto assets, only ~4.7–6.7% are above this key long-term trend line, according to MacroMicro data.)
1️⃣ The Current Reality — Market Breadth at Historic Lows
The altcoin market is experiencing one of the most extreme breadth contractions in recent cycles, indicating deep systemic weakness across nearly all altcoins. As of March 1–2, 2026:
~95% of Gate.io-listed altcoins trade below their 200-day SMA, showing that nearly the entire sector is entrenched in a long-term downtrend.
Only ~5% of altcoins remain above the 200-day SMA, demonstrating that very few projects are maintaining any upward momentum.
Short-term metrics reflect similarly constrained conditions, with only 10–12% of cryptocurrencies above their 50-day moving average.
The Altcoin Season Index is in the low 20s–30s, far below the 75 threshold typically required to confirm an altseason. Bitcoin dominance on Gate.io sits elevated at ~57–58%, reinforcing a “BTC season” environment where altcoins underperform relative to Bitcoin.
The altcoin market capitalization (TOTAL2, excluding BTC) remains deeply suppressed, struggling to hold major long-term supports such as the 50-week and 200-week EMAs. Many mid-cap and small-cap altcoins are still down 70–95% from their cycle highs, highlighting the severity of this drawdown.
This is not isolated weakness; it is systemic capitulation, with market breadth readings signaling a level of oversold pressure rarely seen in recent years. Historically, such extreme conditions have coincided with the early phases of significant altcoin rotations once key triggers align.
2️⃣ Why the 200-Day SMA Matters — A Critical Market Benchmark
The 200-day Simple Moving Average (SMA) is one of the most respected trend filters in both crypto and traditional financial markets. Its significance lies in its ability to distinguish between risk-on and risk-off regimes:
Trading above the 200-day SMA typically indicates a long-term uptrend and institutional comfort, signaling a bullish regime.
Trading below the 200-day SMA generally reflects a prolonged downtrend or bear market conditions, indicating risk-off sentiment.
When 90–95% of altcoins remain below the 200-day SMA for an extended period, it is historically a classic contrarian extreme, often marking the exhaustion point of retail participation and the beginning of accumulation phases by long-term holders.
Historical context based on previous Gate.io cycles:
Cycle
Breadth <15% Duration
Outcome
Late 2018 bear market
~4–5 months
Sharp altcoin rotation after BTC stabilized
Early 2022 crash
~5 months
Altcoins surged once BTC dominance rolled over
Current down-leg
~5 months (Dec 2025–Mar 2026)
Potential for early recovery when structural triggers align
Sentiment overlay: The Crypto Fear & Greed Index currently sits at 14 (Extreme Fear). Historically, this is the peak despair zone, a phase where retail traders capitulate and smart capital often begins to quietly accumulate.
3️⃣ Key Triggers to Watch — Signals That Could Indicate a Turn
Entering positions prematurely in this environment is highly risky. Traders and analysts should focus on structural catalysts that historically precede meaningful reversals. Key signals include:
Volume Surges
A 2–5× surge in trading volume on alt/BTC or alt/USDT pairs on Gate.io, especially when accompanied by strong green closes, is typically the first real indication that demand is returning. Such spikes often mark the initial signs of buying pressure after prolonged capitulation.
Bitcoin Dominance Rollover
BTC dominance (~57–58%) is an important metric to monitor:
A stall or rejection near 58–59% could signal an impending rotation of capital into altcoins.
A decline below 55–56% historically acts as a textbook trigger for capital rotation from BTC into the broader altcoin market.
Mass Reclaim of the 200-Day SMA
When 20–30% or more of major altcoins on Gate.io flip back above the 200-day SMA with conviction volume, this often signals the start of a broader recovery phase. Early green without breadth confirmation should be interpreted cautiously, as fakeouts are common in distressed markets.
Relative Strength Plays
Some altcoins are already showing early decoupling from Bitcoin, which can be monitored for potential reversal setups:
Symbol
Technical Setup
Key Levels / Notes
XRP
Compressed at descending triangle apex
~$1.38–$1.40; breakout target $1.60–$2.00+
Polkadot (DOT)
Near multi-year support
Favorable risk-adjusted setup for accumulation
Pi Network (PI)
High-volatility breakout candidate
Reclaiming short-term EMAs after deep drawdown
Select Layer-1 / DeFi tokens
Inverse head-and-shoulders or forming golden crosses
Oversold RSI on weekly charts suggests early reversal potential
On-Chain & Market Extremes
Deeply negative funding rates on Gate.io altcoin pairs indicate strong selling pressure but also potential for short squeeze rallies.
Whale accumulation in select altcoins signals institutional positioning at discounted levels.
Oversold weekly RSI levels across multiple altcoins are historically reliable precursors to sharp mean-reversion rallies.
4️⃣ Risk Management — This Environment Demands Discipline
Altcoins remain high-beta instruments that amplify BTC moves. Key risks include:
Assets that appear cheap can continue to decline significantly. Many altcoins remain 70–95% below prior cycle highs, and further declines of 50% or more are possible in extreme washout scenarios.
Fake rallies and bull traps are common; early green often fades aggressively.
Leveraged positions are particularly vulnerable; small market swings of 3–5% can trigger liquidations.
Macro or geopolitical risks could extend altcoin underperformance.
Recommended survival rules:
Keep position size small (1–2% risk per trade).
Maintain hard stops below weekly or monthly support levels.
Retain significant dry powder — the best entries often appear after confirmation of a structural reversal.
Diversify across uncorrelated assets; avoid concentrating risk in a single narrative or sector.
5️⃣ Discussion & Engagement Prompts
Traders can use these questions to foster dialogue and assess market sentiment:
“95% of altcoins below 200-day SMA and Extreme Fear at 14 — are you waiting for BTC.D rollover and volume confirmation, or already accumulating select Gate.io names?”
“We are at the tail end of the typical 5-month sub-15% breadth window. Do you expect a March reversal, or more grinding weakness?”
Poll: With 95% of altcoins trading underwater on Gate.io, which strategy do you prefer?
(A) Patience for structural signals
(B) Hunting generational lows now
(C) BTC-only exposure until proven otherwise
“Extreme oversold breadth plus a 5-month historical minimum — is this a setup for violent rotation, or early-stage continuation of the bear trend?”
6️⃣ Closing Summary & Outlook
95% below 200-day SMA represents peak altcoin pain and a textbook contrarian extreme.
We are currently in a Bitcoin-dominant regime, with altcoins deeply oversold and widely hated.
March 2026 may be a pivotal inflection point, given the end of the 5-month weakness window, extreme Fear sentiment, and early relative strength hints in select altcoins.
Confirmation remains critical — nothing is guaranteed.
Are you waiting for 200-day SMA reclaims, quietly accumulating Gate.io-listed altcoins, or remaining in BTC/stablecoins?
Drop your strategies, watchlists, or favorite reversal candidates to compare insights and market perspective.
Optional next step: A curated list of 5–8 Gate.io altcoins, showing distance to 200-day SMA, key levels, and potential upside, would make this fully actionable for traders.
✅ Key Takeaways
Extreme systemic weakness across nearly all altcoins.
Contrarian signals suggest potential early rotation once BTC dominance softens.
Watch BTC.D, volume spikes, 200-day SMA reclaims, and relative strength setups.
Patience and risk management are paramount — the best entries often come after confirmation, not at despair extremes.