
RIVER has had one of the more compelling stories in crypto over the past week. After the recent airdrop and ecosystem announcements, the token attracted strong buying interest. that pushed it well above previous consolidation levels.
Now, as the initial hype settles, The chart is showing something that technical traders love to see: structure. Sjuul from AltCryptoGems indicated the move on X, noting that the RIVER price is still pushing higher after that textbook move. His assessment is simple but meaningful: it is a bullish chart
- The RIVER 12-Hour Chart Reveals Clean Structure
- Current Price Action and Key Levels
- What Comes Next for RIVER
The RIVER 12-Hour Chart Reveals Clean Structure
Looking at the 12-hour chart, the setup is clear. The RIVER price had been trading in a range between approximately $16.00 and $20.00 for several weeks, building a base after the initial launch volatility. The breakout from this range came with the recent airdrop news, pushing the RIVER price above $20.00 for the first time.
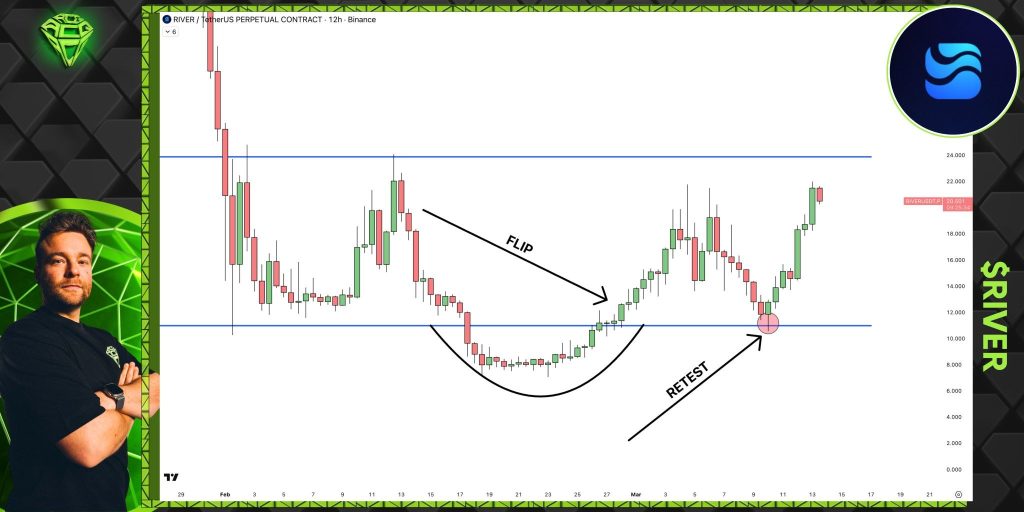
Source: X/@altcryptogems
What matters now is what happened next. Instead of reversing back into the range, the RIVER price held above the breakout level and began consolidating in a new, higher range. This is the textbook behavior that Sjuul references.
The chart labels a clear FLIP level where former resistance near $20.00 has now become support. Below this, a zone labeled RETEST appears, which shows where the price retraced to retest the breakout before proceeding with its uptrend. This shows that buyers are ready to buy the asset.
Current Price Action and Key Levels
The RIVER price currently trades at a level around $20.50, a level slightly above the turned support level. This price move took the token to a new high of around $24.00, a move that indicates the buyers’ commitment to taking River to new heights.
However, the current pullback from the new price high has been minor, and River currently trades significantly above the breakout level. The token currently faces resistance at the fresh price high of around $24.00. If the price breaks through this level, it could target the level of around $26.00 to $28.00.
On the other hand, the turned support level of around $20.00 currently acts as the token’’s initial support level. If the River price fails to stay above the level of $20.00, it could target the level of around $18.50, the former range high.
RIVER needs to stay significantly above the level of $20.00 for the bullish scenario to remain valid. If the price fails to stay above the level of $20.00, the breakout could be a false breakout.
Read Also: The Math Behind XRP Price Hitting $1,000+: Analyst Breaks Down the Numbers
**What Comes Next for RIVER **
The RIVER price now sits at a decision point. The trend still appears to favor the higher end as long as the level of $20.00 acts as support. If the price does rise, the next level to target would likely be around the level of $24.00, and then a breach of that level could lead to the level of $26.00 or more.
On the other hand, a breach of the level of $20.00 could jeopardize the current scenario, potentially taking the price back to the level of $18.50. For now, Sjuul’s assessment holds. The RIVER price is pushing higher after a textbook move, and the bullish structure remains intact.
Isenção de responsabilidade: As informações contidas nesta página podem ser provenientes de terceiros e não representam os pontos de vista ou opiniões da Gate. O conteúdo apresentado nesta página é apenas para referência e não constitui qualquer aconselhamento financeiro, de investimento ou jurídico. A Gate não garante a exatidão ou o carácter exaustivo das informações e não poderá ser responsabilizada por quaisquer perdas resultantes da utilização destas informações. Os investimentos em ativos virtuais implicam riscos elevados e estão sujeitos a uma volatilidade de preços significativa. Pode perder todo o seu capital investido. Compreenda plenamente os riscos relevantes e tome decisões prudentes com base na sua própria situação financeira e tolerância ao risco. Para mais informações, consulte a
Isenção de responsabilidade.
Related Articles
SHIB Apresenta Sinais de Alta à Medida que Gráfico Espelha Padrão de Rompimento de 455%
SHIB mostra um padrão de cunha descendente sinalizando um potencial rompimento altista em breve.
A configuração anterior de cunha acionou um rali de 455 por cento, sugerindo que a história poderia se repetir.
O rompimento requer volume forte e eliminação de resistência para confirmar o movimento.
Shiba Inu chamou a atenção dos traders novamente
CryptoNewsLand11m atrás
Bitcoin rompe 74K, ETF com 3 semanas consecutivas de fluxos líquidos positivos, o mercado cripto está a ficar mais otimista?
O mercado de criptomoedas registou uma subida generalizada esta manhã, com o Bitcoin a ultrapassar os 74.450 dólares, atingindo o nível mais alto desde fevereiro. Os ETF de Bitcoin spot norte-americanos apresentam entradas líquidas durante três semanas consecutivas, indicando uma confiança institucional reforçada. O Bitcoin tem apresentado uma performance superior à do ouro num contexto de instabilidade geopolítica, com o sentimento do mercado a recuperar para níveis neutros.
ChainNewsAbmedia12m atrás
Analista Independente: Preço das ações da Circle sobe quase 100% em três semanas, aproximando-se do nível de resistência
Gate News notícia: A 16 de março, o analista independente Markus Thielen divulgou um relatório gráfico indicando que Circle (CRCL) acumulou ganhos aproximados a 100% em menos de três semanas desde 25 de fevereiro, com o preço das ações a aproximar-se gradualmente dos níveis de resistência. O analista indicou que os indicadores técnicos actuais continuam a melhorar, a pressão de liquidações é relativamente controlável e os indicadores de sentimento também apresentam uma melhoria notória, mas o volume de negociação permanece em níveis reduzidos. O analista alertou os investidores para manter cautela com posicionamentos unidirecionais de baixa em mercados com movimentação limitada.
GateNews15m atrás
Trump cria aliança do Estreito de Ormuz, Bitcoin sobe acima de 74 mil dólares
Influenciado por notícias geopolíticas, o Bitcoin subiu durante o período de negociação asiático, atingindo uma máxima de 74,309 dólares, com o mercado focado na quebra dos 74,000 dólares. O plano de Trump de formar uma coligação multinacional para lidar com as exportações de petróleo iraniano pode impulsionar o Bitcoin ainda mais. Desde o conflito, o preço do BTC já rebateu 11%.
GateNews16m atrás
Baleia Cardano vende 380 milhões de ADA em três semanas, preço sob pressão pairando em 0,26 dólares, divergência entre alta e baixa intensifica-se
Nos últimos tempos, o Cardano (ADA) registou uma ligeira recuperação de preço, mas a detenção contínua por parte dos grandes detentores está exercendo pressão sobre o sentimento do mercado, com a estrutura geral ainda fraca. As baleias que detêm entre 10 milhões e 100 milhões de ADA já venderam aproximadamente 380 milhões de tokens, o sentimento dos investidores está deprimido, e a maioria dos detentores está em posição de perda. O preço atual está em torno de 0,264 dólares, enfrentando um teste do nível de suporte em 0,254 dólares; se for quebrado, pode sofrer uma queda adicional para 0,243 dólares; se quebrar a resistência em 0,269 dólares, há possibilidade de melhoria na estrutura do mercado.
GateNews32m atrás
ETF de Bitcoin impulsiona retorno de fundos com rebote forte, analistas apontam para alvo de 80 mil dólares
Bitcoin rebounded approximately 2.5% in recent periods, reaching a high of $74,000, primarily driven by five consecutive days of net inflows into U.S. spot ETFs, totaling $767.3 million. Analysis indicates that this rebound stems from spot ETF capital inflows, short covering, and active institutional buying. While the rebound is strong, analysts remain cautious about a sustained long-term bull market, with the key factors being the sustainability of capital inflows and easing geopolitical tensions.
MarketWhisper55m atrás
