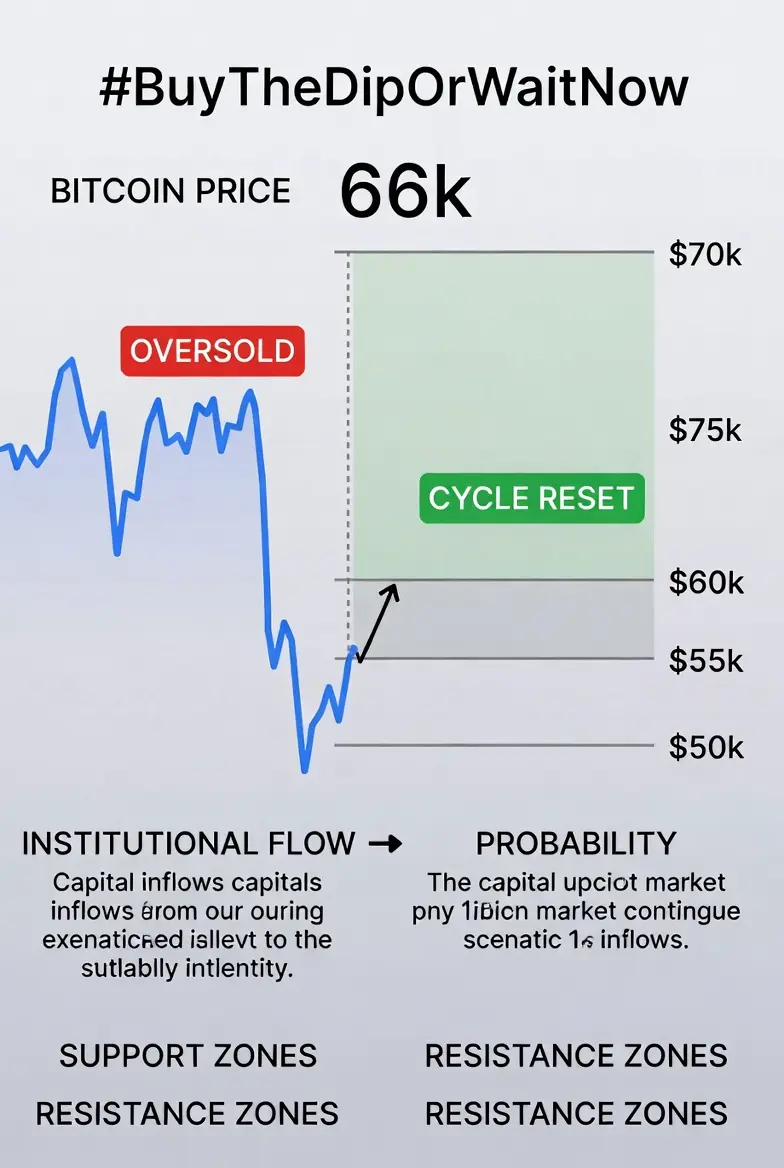
#BuyTheDipOrWaitNow?
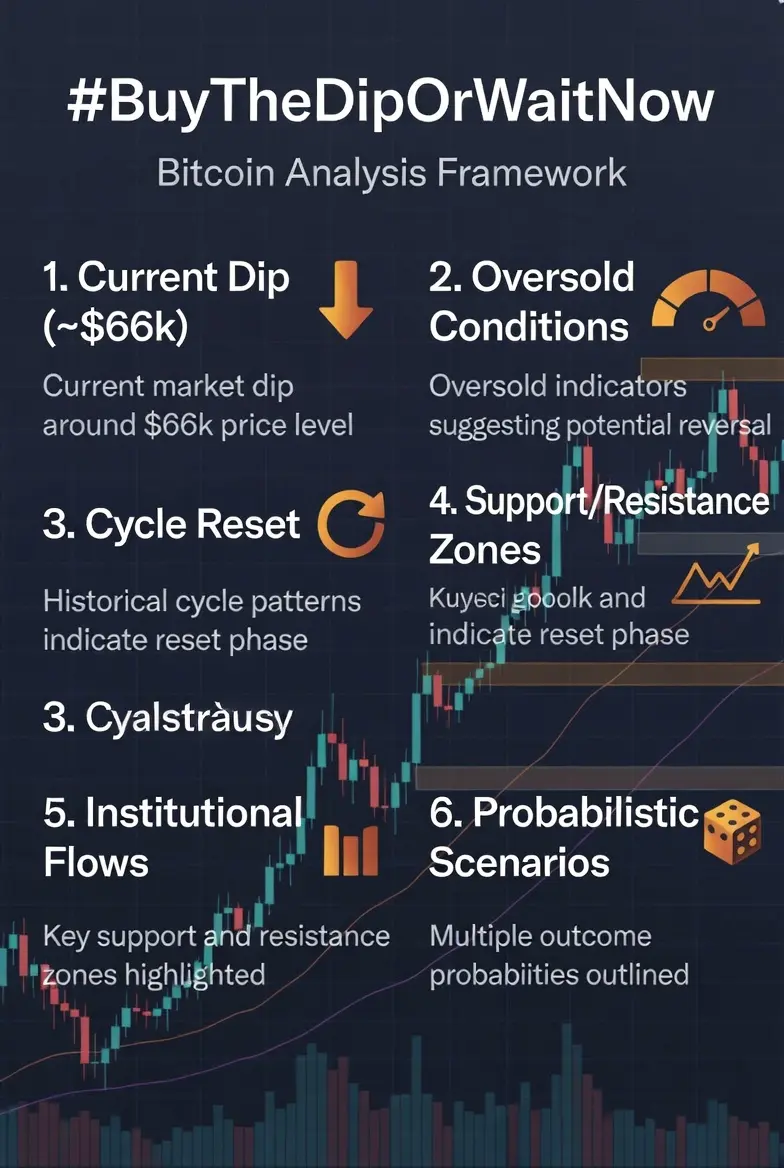
1. Current Structural Context
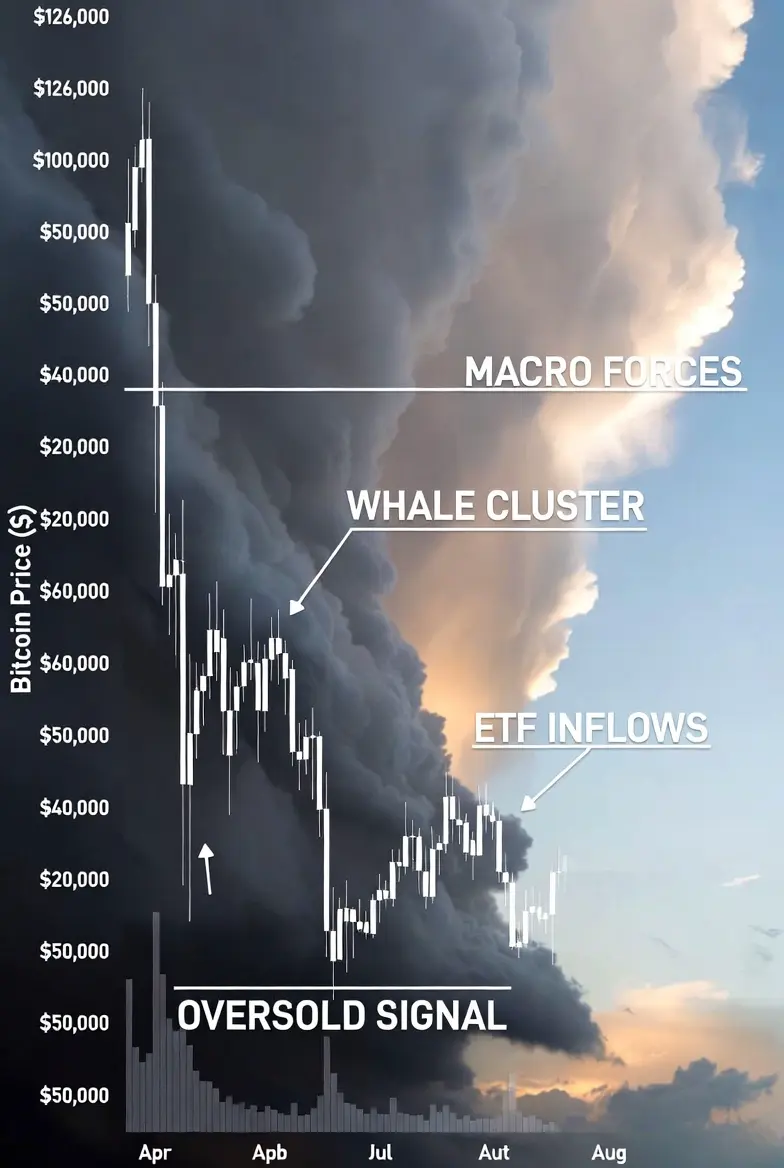
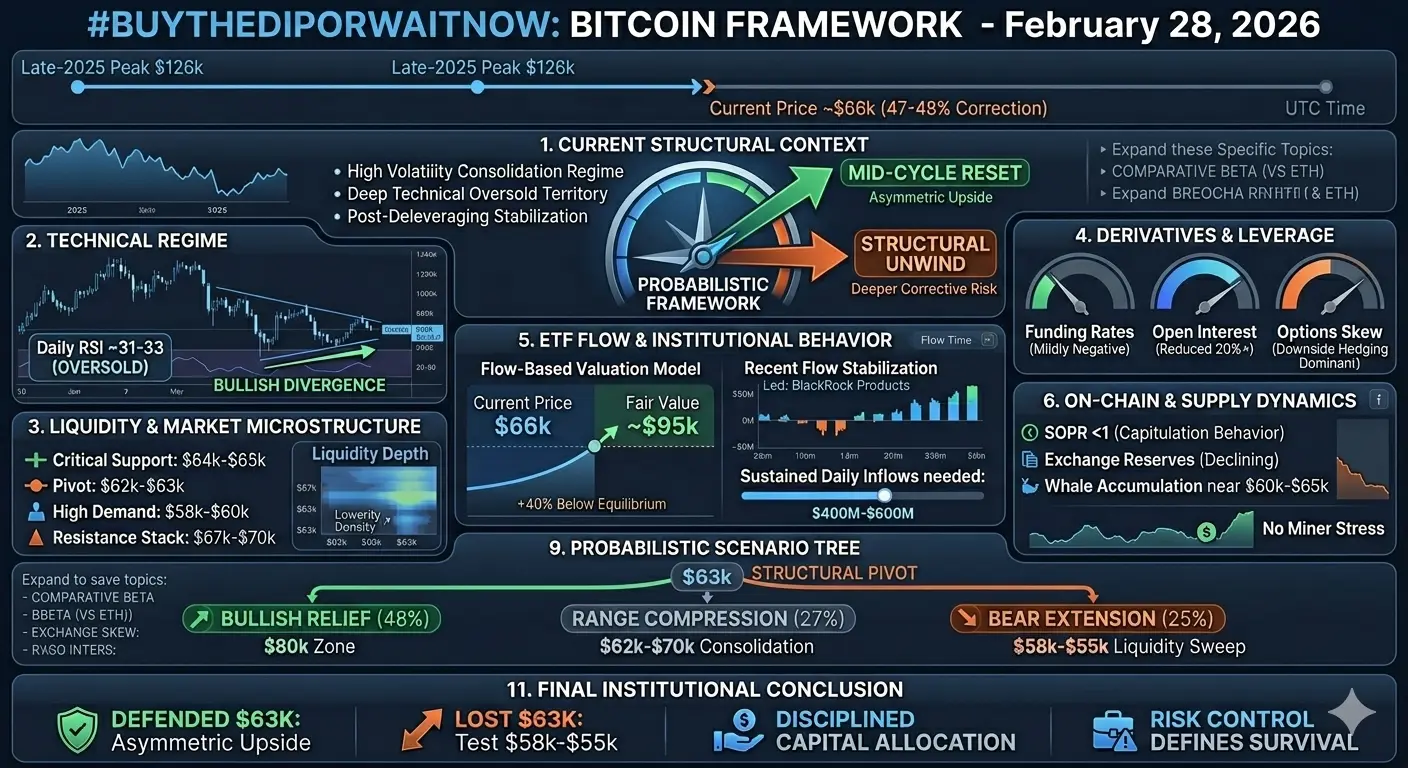
As of early February 28, 2026 (UTC), Bitcoin trades near $65,800–$66,000 following a ~47–48% correction from the late-2025 peak near $126,000.
This places the market in:
A high-volatility consolidation regime
Deep technical oversold territory
Post-deleveraging stabilization phase
Macro-uncertain but structurally intact cycle
The central question is no longer emotional (“Buy or wait?”) — it is probabilistic:
Is this a mid-cycle reset with asymmetric upside, or the beginning of a deeper structural unwind?
2. Technical Regime Assessment
Short-Term (1–4 weeks):
Daily RSI ~31–33 (oversold)
Bullish divergence visible on lower timeframes
Momentum deceleration (MACD histogram compression)
Volatility compression suggesting expansion ahead
Probability-weighted outcome: 45–55% chance of 8–15% relief rally if $63k–$64k holds.
Medium-Term (1–3 months):
Price remains below 50D and 200D dynamic resistance
Trend technically bearish until $68k–$70k reclaimed
Conclusion: Oversold bounce conditions exist, but structural confirmation requires higher-level reclaim.
3. Liquidity & Market Microstructure
Critical price zones:
Immediate support: $64k–$65k
Structural pivot: $62k–$63k
High-conviction demand: $58k–$60k
Resistance stack: $67k–$70k
Order book depth reveals thinner liquidity below $63k, increasing risk of temporary vacuum if breached.
However, open interest contraction suggests cascading liquidation risk is lower than during late-2025 leverage extremes.
The market is fragile, but not structurally unstable.
4. Derivatives & Leverage Environment
Funding rates remain mildly negative — indicating defensive positioning and short bias.
Open interest is materially reduced (20%+ below peaks), signaling deleveraging largely complete.
Options skew shows downside hedging still dominant.
Interpretation: Leverage excess has been flushed. Reflexive collapse risk diminished. Volatility expansion likely directional, not disorderly.
5. ETF Flow & Institutional Behavior
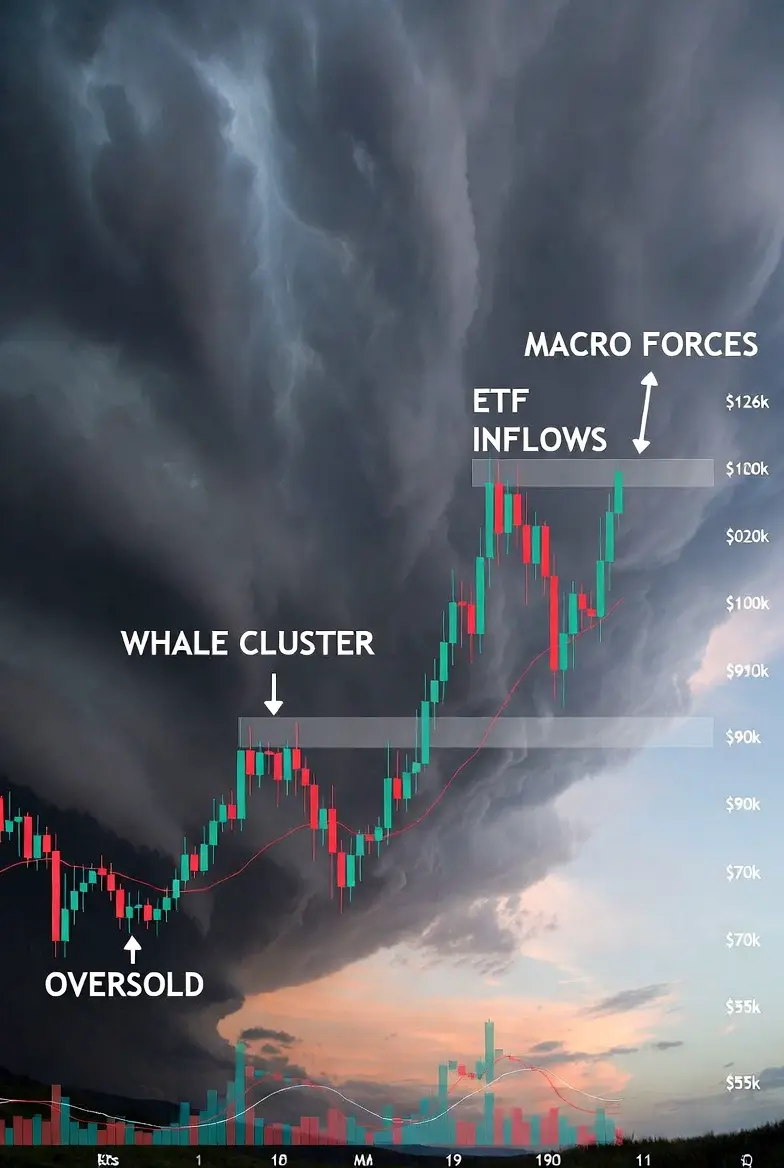
Recent spot ETF inflows have reversed a multi-week outflow streak, led primarily by BlackRock products.
Flow-based valuation modeling implies a fair value closer to $95k under sustained inflow conditions — placing current price roughly 40% below flow-implied equilibrium.
Key variable: Are inflows persistent or temporary?
If sustained above $400–$600M daily pace, probability of structural recovery increases materially.
6. On-Chain & Supply Dynamics
Indicators suggest:
SOPR <1 (capitulation behavior)
Long-term holder distribution slowing
Exchange reserves structurally declining
Whale accumulation clusters near $60k–$65k
Miner stress signals remain absent.
This resembles mid-cycle reset behavior more than terminal bear capitulation.
7. Macro Correlation Framework
Bitcoin remains highly correlated with:
Nasdaq (~0.7–0.8 beta)
Real yields (inverse sensitivity)
USD strength (DXY drag when elevated)
Primary macro risk: No confirmed global liquidity expansion yet.
Primary macro catalyst: Clear rate-cut pivot or easing cycle could accelerate capital rotation into risk assets.
Macro remains neutral-to-tight, not aggressively contractionary.
8. Cross-Cycle Statistical Positioning
Historical analogs (2017, 2021 post-halving mid-cycle resets):
At 45–50% drawdowns:
Average 6-month forward return ≈ +30%
Median ≈ +25%
Worst macro-adjusted case ≈ −18%
Current drawdown statistically aligns more with mid-cycle reset than structural top formation.
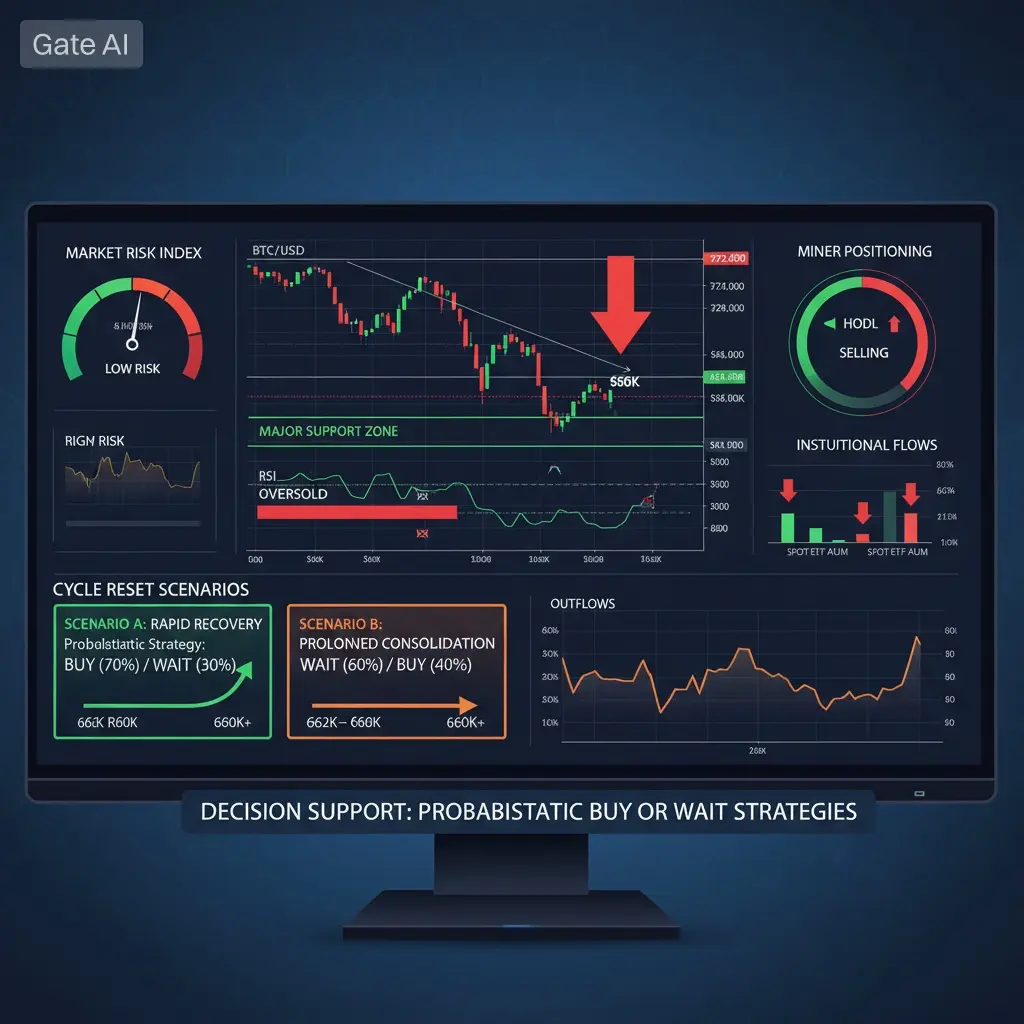
9. Probabilistic Scenario Tree
Short-Term (2–8 weeks):
Bullish Relief (48%): $63k holds → reclaim $68k–$70k → extension toward $80k zone.
Range Compression (27%): $62k–$70k multi-week consolidation.
Bear Extension (25%): Decisive break below $63k → liquidity sweep toward $58k–$55k.
Medium-Term (3–6 months):
Recovery toward $85k–$95k (≈42%)
Extended base formation (≈38%)
Deeper corrective regime (<$55k, ≈20%)
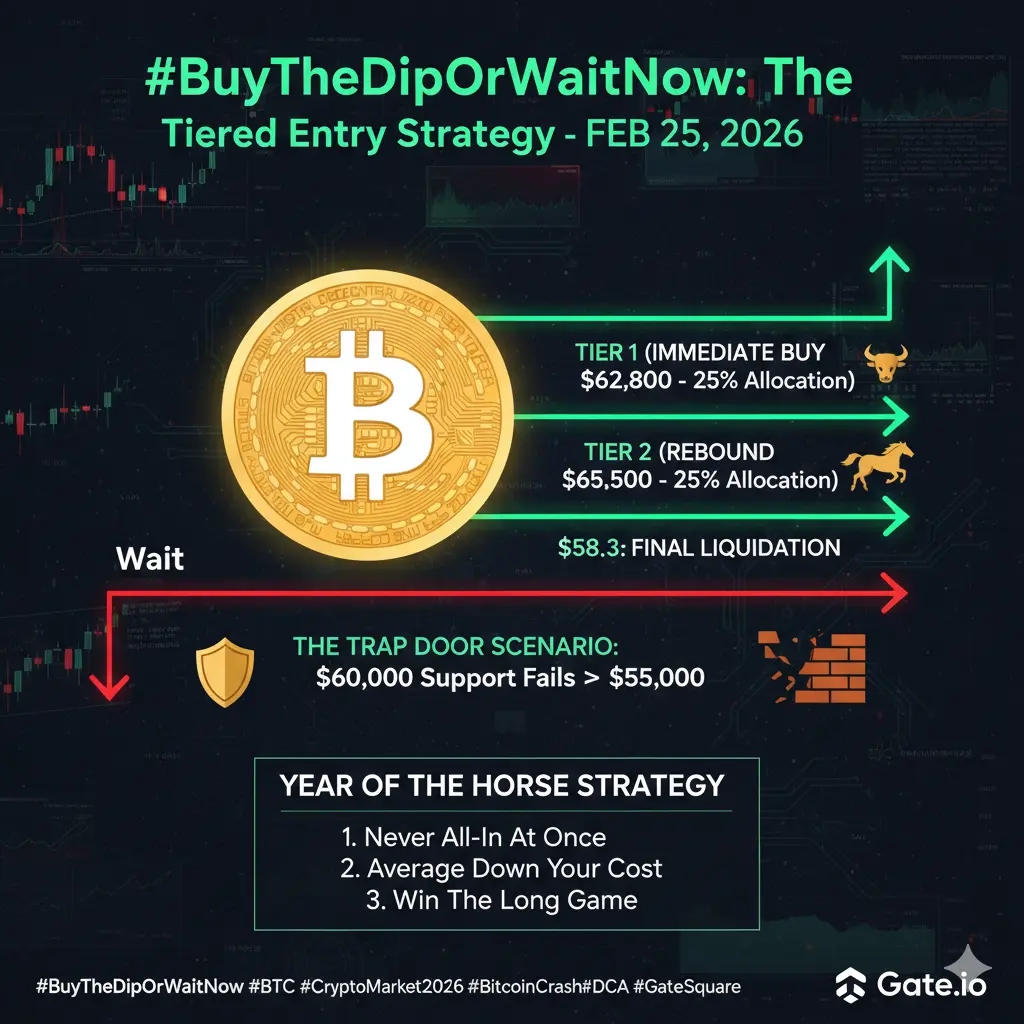
10. Capital Allocation & Risk Discipline Model
Rather than binary decision-making:
Structured scaling approach:
Partial exposure in oversold compression zone
Additional allocation on structural confirmation above $70k
Reserve liquidity for asymmetry below $60k
Maintain hedging flexibility
Risk Management Parameters:
Controlled position sizing
Avoid full allocation pre-confirmation
Preserve 25–40% liquidity buffer
Protect against macro event volatility
Volatility is opportunity only when sized properly.
11. Asymmetry & Expected Value Framing
At ~$66k:
Downside to structural stress zone (~$55k): −17%
Upside to flow-implied valuation ($95k): ~+44%
Risk/reward skew moderately positive — conditional upon $63k structural defense.
The edge lies not in prediction, but in disciplined probabilistic positioning.
Final Institutional Conclusion
The #BuyTheDipOrWaitNow question dissolves under structured analysis.
This is not a binary choice. It is a regime evaluation.
Current regime characteristics:
Deep oversold technicals
Leverage reset largely complete
Early ETF flow stabilization
No miner capitulation
Macro uncertainty unresolved
Volatility compression near expansion
The decisive structural pivot remains $63k.
If defended: Asymmetric upside probability increases meaningfully into Q2.
If lost: Short-term liquidity vacuum likely tests $58k–$55k before stabilization.
The advantage belongs to disciplined capital allocators — not emotional participants.
Volatility is the mechanism.
Liquidity is the catalyst.
Structure defines timing.
Risk control defines survival.
1. Current Structural Context
As of early February 28, 2026 (UTC), Bitcoin trades near $65,800–$66,000 following a ~47–48% correction from the late-2025 peak near $126,000.
This places the market in:
A high-volatility consolidation regime
Deep technical oversold territory
Post-deleveraging stabilization phase
Macro-uncertain but structurally intact cycle
The central question is no longer emotional (“Buy or wait?”) — it is probabilistic:
Is this a mid-cycle reset with asymmetric upside, or the beginning of a deeper structural unwind?
2. Technical Regime Assessment
Short-Term (1–4 weeks):
Daily RSI ~31–33 (oversold)
Bullish divergence visible on lower timeframes
Momentum deceleration (MACD histogram compression)
Volatility compression suggesting expansion ahead
Probability-weighted outcome: 45–55% chance of 8–15% relief rally if $63k–$64k holds.
Medium-Term (1–3 months):
Price remains below 50D and 200D dynamic resistance
Trend technically bearish until $68k–$70k reclaimed
Conclusion: Oversold bounce conditions exist, but structural confirmation requires higher-level reclaim.
3. Liquidity & Market Microstructure
Critical price zones:
Immediate support: $64k–$65k
Structural pivot: $62k–$63k
High-conviction demand: $58k–$60k
Resistance stack: $67k–$70k
Order book depth reveals thinner liquidity below $63k, increasing risk of temporary vacuum if breached.
However, open interest contraction suggests cascading liquidation risk is lower than during late-2025 leverage extremes.
The market is fragile, but not structurally unstable.
4. Derivatives & Leverage Environment
Funding rates remain mildly negative — indicating defensive positioning and short bias.
Open interest is materially reduced (20%+ below peaks), signaling deleveraging largely complete.
Options skew shows downside hedging still dominant.
Interpretation: Leverage excess has been flushed. Reflexive collapse risk diminished. Volatility expansion likely directional, not disorderly.
5. ETF Flow & Institutional Behavior
Recent spot ETF inflows have reversed a multi-week outflow streak, led primarily by BlackRock products.
Flow-based valuation modeling implies a fair value closer to $95k under sustained inflow conditions — placing current price roughly 40% below flow-implied equilibrium.
Key variable: Are inflows persistent or temporary?
If sustained above $400–$600M daily pace, probability of structural recovery increases materially.
6. On-Chain & Supply Dynamics
Indicators suggest:
SOPR <1 (capitulation behavior)
Long-term holder distribution slowing
Exchange reserves structurally declining
Whale accumulation clusters near $60k–$65k
Miner stress signals remain absent.
This resembles mid-cycle reset behavior more than terminal bear capitulation.
7. Macro Correlation Framework
Bitcoin remains highly correlated with:
Nasdaq (~0.7–0.8 beta)
Real yields (inverse sensitivity)
USD strength (DXY drag when elevated)
Primary macro risk: No confirmed global liquidity expansion yet.
Primary macro catalyst: Clear rate-cut pivot or easing cycle could accelerate capital rotation into risk assets.
Macro remains neutral-to-tight, not aggressively contractionary.
8. Cross-Cycle Statistical Positioning
Historical analogs (2017, 2021 post-halving mid-cycle resets):
At 45–50% drawdowns:
Average 6-month forward return ≈ +30%
Median ≈ +25%
Worst macro-adjusted case ≈ −18%
Current drawdown statistically aligns more with mid-cycle reset than structural top formation.
9. Probabilistic Scenario Tree
Short-Term (2–8 weeks):
Bullish Relief (48%): $63k holds → reclaim $68k–$70k → extension toward $80k zone.
Range Compression (27%): $62k–$70k multi-week consolidation.
Bear Extension (25%): Decisive break below $63k → liquidity sweep toward $58k–$55k.
Medium-Term (3–6 months):
Recovery toward $85k–$95k (≈42%)
Extended base formation (≈38%)
Deeper corrective regime (<$55k, ≈20%)
10. Capital Allocation & Risk Discipline Model
Rather than binary decision-making:
Structured scaling approach:
Partial exposure in oversold compression zone
Additional allocation on structural confirmation above $70k
Reserve liquidity for asymmetry below $60k
Maintain hedging flexibility
Risk Management Parameters:
Controlled position sizing
Avoid full allocation pre-confirmation
Preserve 25–40% liquidity buffer
Protect against macro event volatility
Volatility is opportunity only when sized properly.
11. Asymmetry & Expected Value Framing
At ~$66k:
Downside to structural stress zone (~$55k): −17%
Upside to flow-implied valuation ($95k): ~+44%
Risk/reward skew moderately positive — conditional upon $63k structural defense.
The edge lies not in prediction, but in disciplined probabilistic positioning.
Final Institutional Conclusion
The #BuyTheDipOrWaitNow question dissolves under structured analysis.
This is not a binary choice. It is a regime evaluation.
Current regime characteristics:
Deep oversold technicals
Leverage reset largely complete
Early ETF flow stabilization
No miner capitulation
Macro uncertainty unresolved
Volatility compression near expansion
The decisive structural pivot remains $63k.
If defended: Asymmetric upside probability increases meaningfully into Q2.
If lost: Short-term liquidity vacuum likely tests $58k–$55k before stabilization.
The advantage belongs to disciplined capital allocators — not emotional participants.
Volatility is the mechanism.
Liquidity is the catalyst.
Structure defines timing.
Risk control defines survival.