10x Research Year-End Warning: Since the October FOMC meeting, Bitcoin ETF has experienced a cumulative outflow of $5.7 billion, and Ethereum ETF has seen an outflow of $2.6 billion. However, Bitcoin futures open interest has only decreased slightly by 1.8%, while funding rates have increased by 3.7%, indicating remaining traders are shifting towards higher leverage long positions. Volatility has dropped sharply, with Bitcoin’s 30-day implied volatility falling from 55% to 35%.
Dual Pressure from Bitcoin ETF Outflows and Stablecoin Reductions
Data from 10x Research shows continuous outflows from Bitcoin and Ethereum ETFs, exerting pressure on crypto assets. Over the past 7 days, Bitcoin outflows amounted to -$940 million, placing it in the 7th percentile; over the past 30 days, outflows totaled -$857 million, in the 11th percentile. Since the October FOMC meeting, Bitcoin ETF has accumulated a total outflow of $5.7 billion; since the December FOMC meeting, the total outflow is $1.3 billion. After an $3.5 billion outflow in November, Bitcoin ETFs experienced another $1.1 billion outflow in December.
Ethereum’s situation is even more severe. Over the past 7 days, outflows reached -$179 million, in the 23rd percentile; over the past 30 days, outflows totaled -$385 million, in the 26th percentile. Since the October FOMC meeting, Ethereum ETF has seen a total outflow of $2.6 billion; since the December FOMC, the outflow is $800 million. 10x Research notes that without the $9.5 billion inflow during the July to August Bitmain hype, ETH ETF’s inflows in 2025 would be negative.
The trend of stablecoin issuance reduction continues, signaling a slightly bearish outlook. Tether USDT’s market cap remains at $186.8 billion, unchanged from a week ago, with a trading volume of $65.3 billion, 21% below average. Circle USDC’s market cap is $76.3 billion, down 0.9% week-over-week, with a trading volume of $8.9 billion, 11% below average. 10x Research emphasizes that the stablecoin issuance indicator is in the 5th percentile, a very negative signal. Last week, stablecoins shrank by $700 million, with only $2 billion issued over the past 30 days.
Since September, crypto capital inflows have slowed significantly; without inflows, there is no upward risk. So far this year, the crypto market has seen a total inflow of $136.7 billion, with $80.4 billion from stablecoins, $45.2 billion into Bitcoin (including ETFs, futures, and MSTR), and $11.1 billion into Ethereum. 10x Research points out that, in the absence of strong macroeconomic or crypto-specific catalysts, capital flows, rather than market narratives, have driven price movements.
Institutional Logic Behind Volatility Collapse
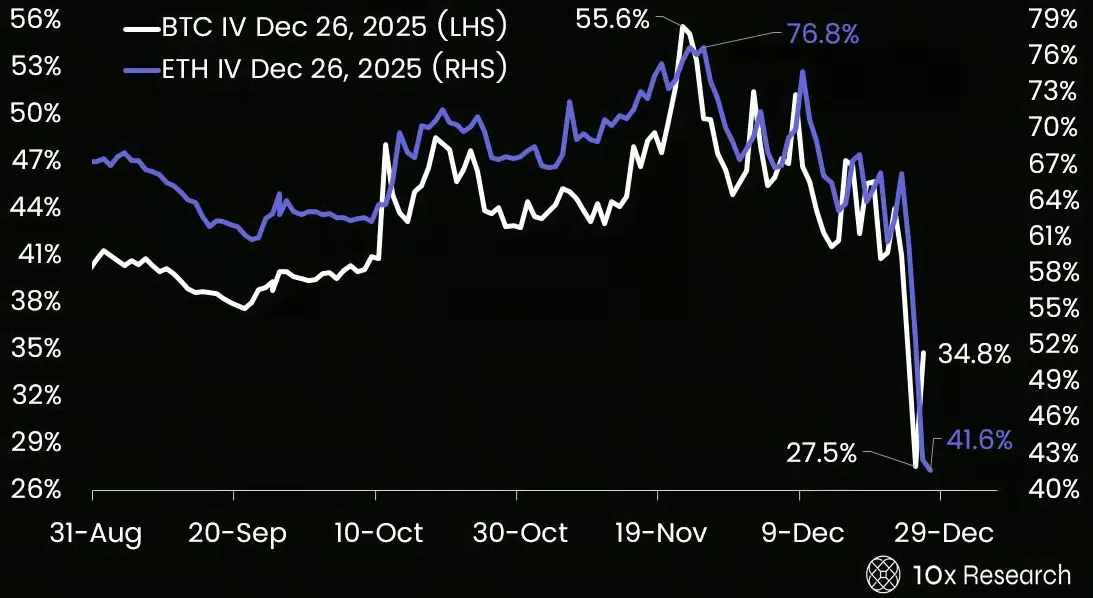
(Source: 10x Research)
10x Research observes that implied volatility for Bitcoin and Ethereum has sharply declined toward the end of the year. Bitcoin’s 30-day realized volatility is 38.2%, below its 30-day average of 45%, a decrease of 7%. Ethereum’s 30-day realized volatility is 61.2%, below its 30-day average of 66.6%, down 5 percentage points. This decline in volatility typically signals a shift in market structure.
Compared to a week ago, Bitcoin’s implied volatility curve has shifted downward across all maturities, with the largest drop in near-term contracts, flattening the curve. This reflects reduced demand for short-term protection and lower expectations for short-term volatility, consistent with a weakening spot market trend. Bitcoin’s skewness across the curve has narrowed in negative value, indicating decreased demand for downside puts, while demand for calls has improved.
10x Research’s Three Key Findings
Futures Leverage Contradiction: Trading volume plummeted 47%, but open interest only decreased by 1.8%, while funding rates rose 3.7%, indicating remaining traders are shifting toward high-leverage longs.
Volatility Selling Signal: Implied volatility dropped from 55% to 35%, suggesting traders are preparing for short-term consolidation rather than large-scale sell-offs.
Sentiment and Data Divergence: Fear index at 24%, indicating extreme fear, yet institutions are unwinding downside hedges and positioning for upside.
Ethereum options traders are also selling volatility, especially by selling large amounts of calls. Compared to a week ago, Ethereum’s implied volatility curve has shifted downward across all maturities, with the largest compression in near-term contracts. Ethereum’s skewness has increased significantly (from negative to near neutral/positive), especially in medium- and long-term contracts, indicating reduced demand for downside puts and increased interest in upside calls. Traders appear to be unwinding downside hedges and selectively positioning for upside or range-bound moves.
January Reversal: Technical and Timing Outlook
10x Research’s technical analysis shows that Bitcoin’s downtrend still exists but is likely to reverse upward in January. The Relative Strength Index (RSI) for Bitcoin is 43%, signaling a bullish signal; the stochastic indicator is at 30%, signaling a bearish signal. Bitcoin is 4.5% away from triggering a trend reversal; the current trend remains bearish. Key short-term support/resistance levels are $88,421. Major bullish/bearish levels are $98,759.
Ethereum may also see a trend reversal to upside in January. Ethereum’s RSI is 44%, indicating a bullish signal; the stochastic indicator is at 23%, indicating a bearish signal. Ethereum is 5% away from triggering a trend reversal; the current trend remains bearish. Key short-term support/resistance levels are $2,991. Major levels are $3,363.
10x Research notes that, from a technical perspective, Bitcoin is trading near the middle of its indicator range, showing limited directional clarity. Traders should prepare to establish positions at the next key breakout levels. Currently, the analysis suggests a slightly higher probability of Bitcoin breaking above the January downtrend line. This differs from its previously bearish outlook since late October, indicating subtle changes in market structure.
Key catalyst timeline to watch: December 29 OP unlocks $10 million; January 9 employment data; January 13 CPI; January 15 tax deadline; January 27-28 FOMC meeting; January 30 government shutdown risk and Bitcoin options expiry. These events are densely packed, any of which could trigger a directional breakout.
Disclaimer: The information on this page may come from third parties and does not represent the views or opinions of Gate. The content displayed on this page is for reference only and does not constitute any financial, investment, or legal advice. Gate does not guarantee the accuracy or completeness of the information and shall not be liable for any losses arising from the use of this information. Virtual asset investments carry high risks and are subject to significant price volatility. You may lose all of your invested principal. Please fully understand the relevant risks and make prudent decisions based on your own financial situation and risk tolerance. For details, please refer to
Disclaimer.