Buying pressure pushed Bitcoin (BTC) above $90,000 at the beginning of the week, but the long upper wick on the candle indicates a clear increase in profit-taking pressure at higher prices. Bulls will strive to close the year above the opening price at the start of the year, around $93,000, while bears are likely to fiercely defend this important resistance level. The tug-of-war between the two sides could lead to increased market volatility in the short term.
The next big question for investors is how Bitcoin will perform in 2026. In an interview with CNBC, Bitwise Investment Director – Mr. Matt Hougan – stated that BTC is likely to continue “rising” next year. However, looking at the long-term decade timeframe, he believes that although returns are positive, it will be difficult to replicate the explosive phases of the past.
In this context, the market needs to pay special attention to the flow of capital into digital asset investment products, which are considered important indicators of investor sentiment recovery.
According to Mr. James Butterfill, Head of Research at CoinShares, cryptocurrency exchange-traded products have experienced a net outflow of up to $3.2 billion since October 10. This development indicates that “investor confidence has not truly returned,” he emphasized in the latest report.
So, do Bitcoin and the top altcoins have enough momentum to initiate a technical recovery? Let’s delve into the charts of the 10 largest-cap cryptocurrencies to find the answer.
Technical Analysis SPX
The S&P 500 (SPX) hit a new all-time high on Wednesday and continued to record a peak on Friday.
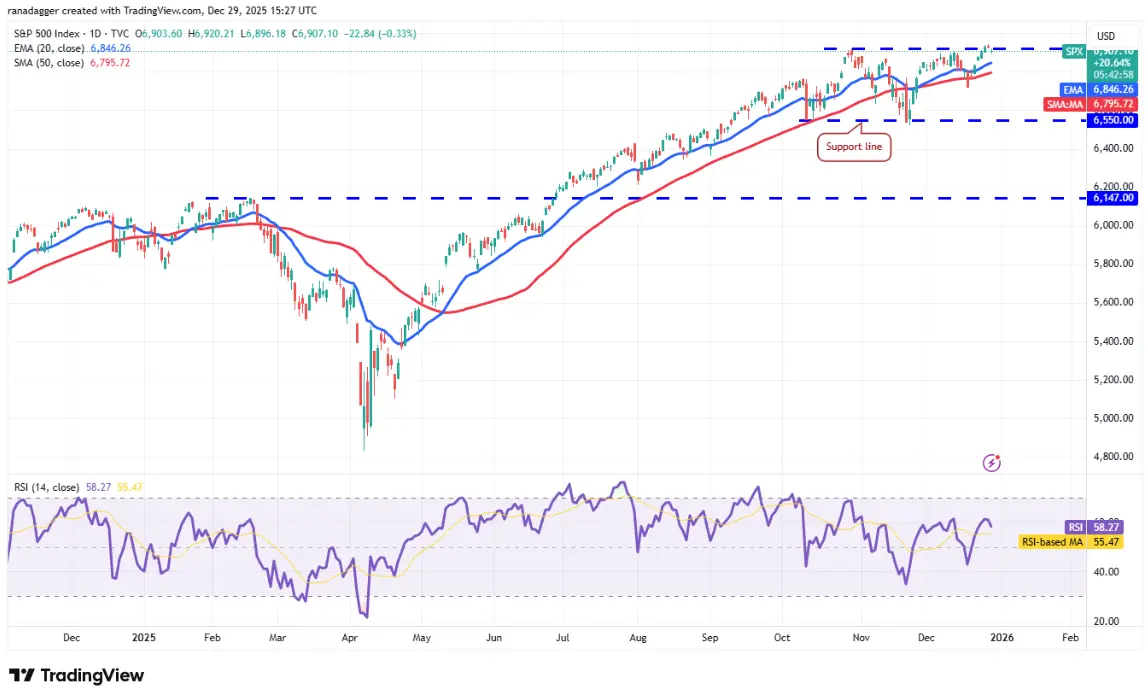 Daily SPX Chart | Source: TradingView If bulls can maintain above 6,920, the uptrend could resume. The index could then move up to 7,120 and subsequently to 7,290.
Conversely, if the price reverses from the current zone, it is likely to find support at moving averages. A strong bounce from these averages indicates that bulls still control the market, increasing the likelihood of a continued rally.
The bears will re-enter the game if they push the price below the support zone of 6,720. In that case, the index could slip to 6,550.
Technical Analysis DXY
The US Dollar Index (DXY) is witnessing a fierce tug-of-war between bulls and bears around the support level of 98.03.
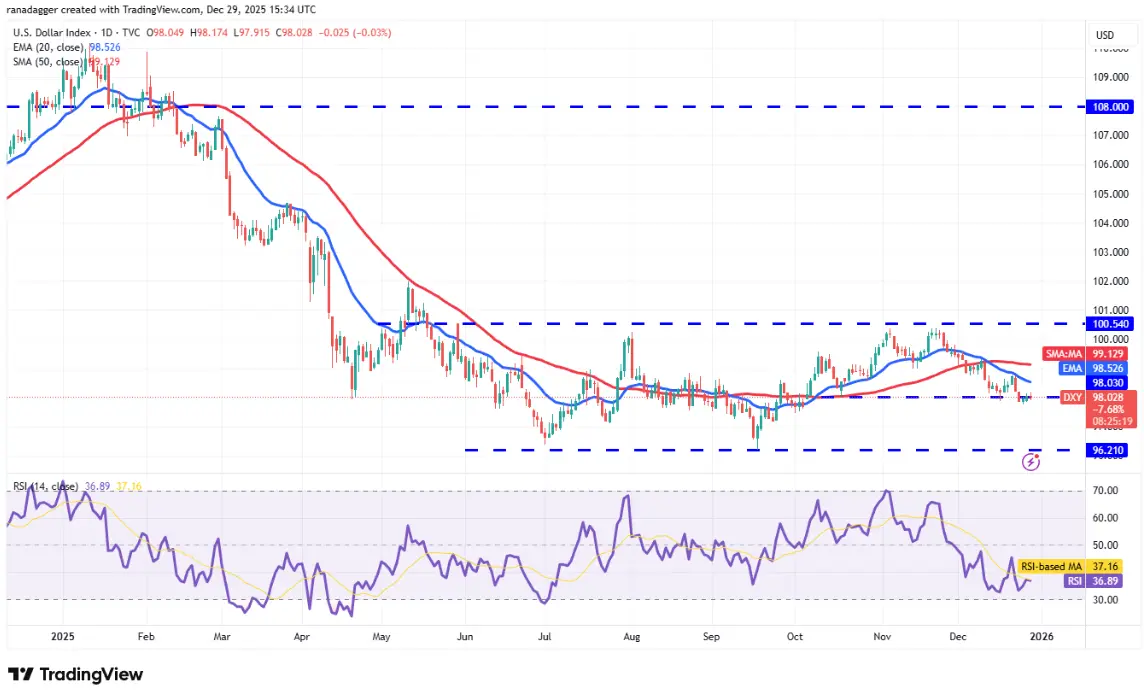 Daily DXY Chart | Source: TradingView Bulls need to push the price above the 20-day exponential moving average (EMA) at 98.52 to regain the advantage. This could lead the index toward the 50-day simple moving average (SMA) at 99.12 and then to the resistance zone above at 100.54.
Conversely, if the price reverses downward and breaks below 97.74, it indicates that bears are gaining control. The index could then decline to 97.46 and further to 97.20, reactivating the wide trading range from 96.21 to 100.54.
Technical Analysis BTC
BTC reversed from the 50-day SMA at $90,525, indicating that bears remain active at higher levels.
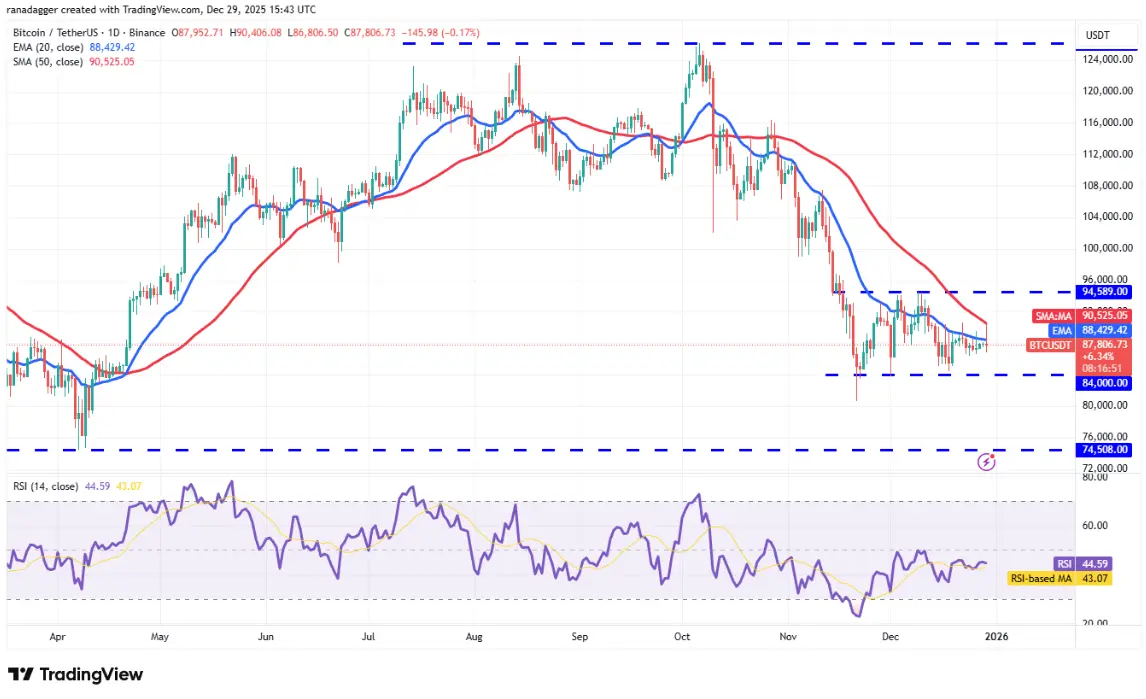 Daily BTC/USDT Chart | Source: TradingView Bears will attempt to pull the price back to the strong support zone at $84,000. Bulls are expected to defend this level fiercely, because if the price breaks below and closes under it, the BTC/USDT pair could fall to $80,600 and further down to $74,508.
On the upside, if the price rebounds from the current zone or from $84,000, it shows that bulls are still accumulating on dips. The first sign of strength will be a close above $90,600. Then, the pair could rise to the strong resistance zone above at $94,589.
Technical Analysis ETH
Ether (ETH) attempted to rise above the moving averages on Monday, but the bears held their ground.
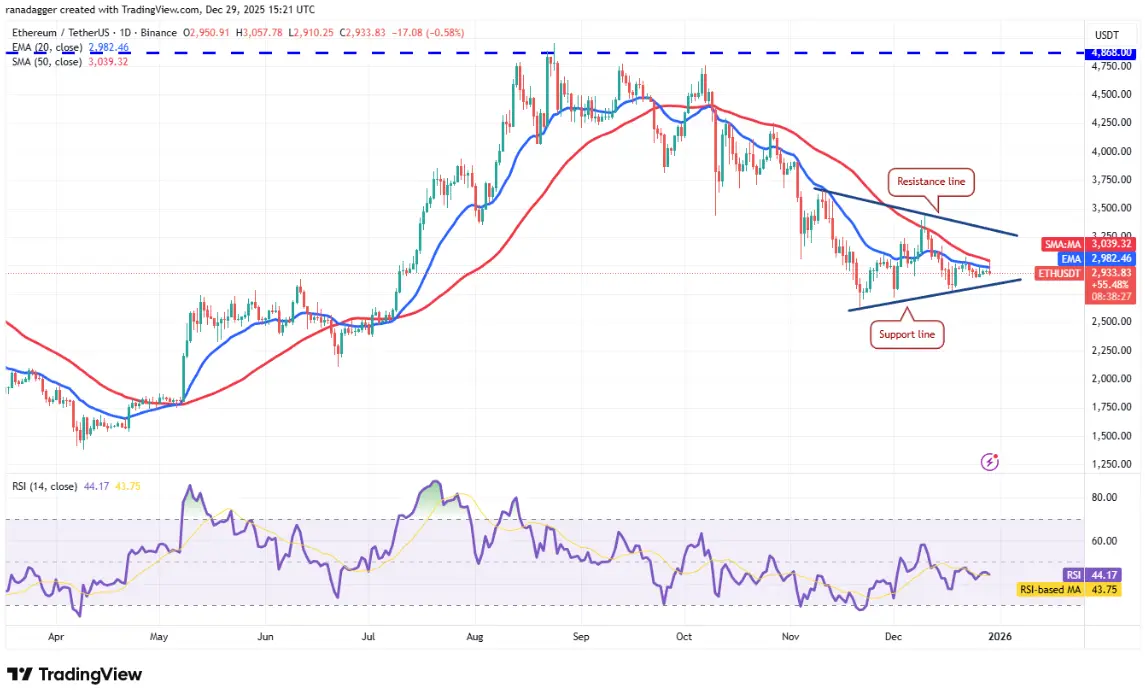 Daily ETH/USDT Chart | Source: TradingView Sellers will try to regain control by dragging Ether below the triangle support. If successful, this signals a resumption of the downtrend. ETH/USDT could then plunge to $2,623 and subsequently to $2,373.
Alternatively, if the price bounces from the support line and breaks above the moving averages, it indicates strong buying interest at lower levels. The pair could then move up toward the resistance level, where bears are expected to defend aggressively.
Technical Analysis BNB
BNB broke above the 20-day EMA at $858 on Sunday, but the technical recovery faces strong resistance at the 50-day SMA at $880.
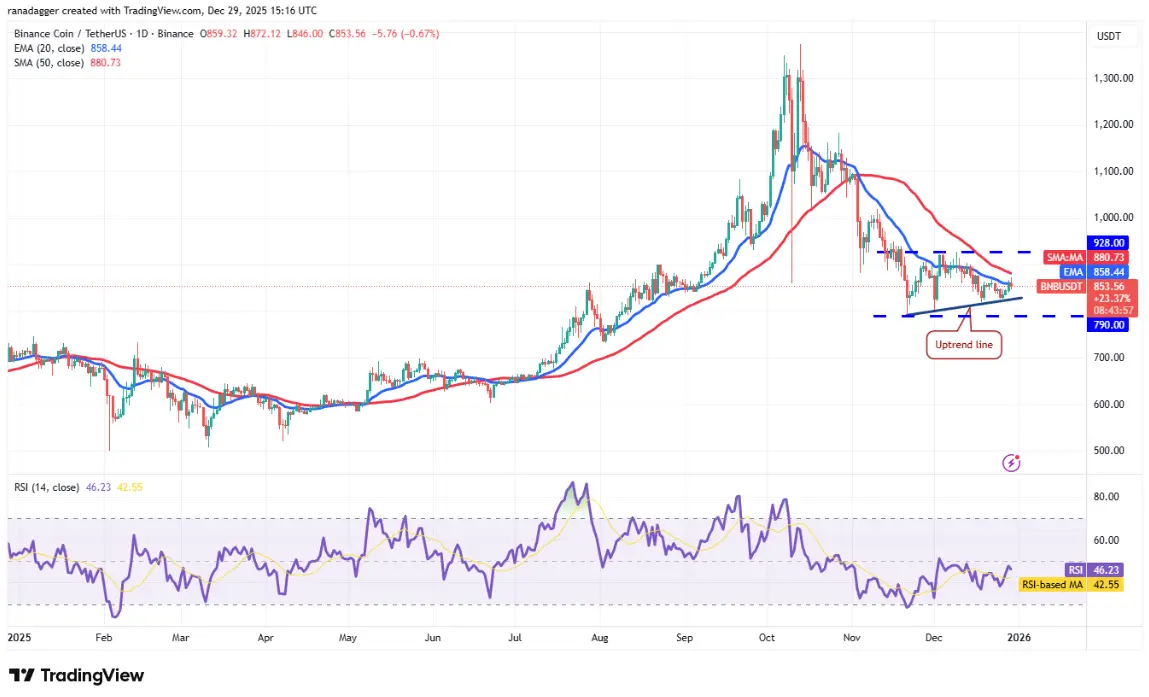 Daily BNB/USDT Chart | Source: TradingView If BNB price continues to weaken and breaks above the upward trendline, it suggests the BNB/USDT pair may continue to fluctuate between $790 and $928 for some time. The next decline could begin if the $790 level is breached.
Bulls need to push the price above the 50-day SMA to signal strength. Then, the pair could rise to the higher resistance zone at $928. Closing above $928 would complete the ascending triangle pattern, with a target theoretically around $1,066.
Technical Analysis XRP
Bulls are trying to initiate a recovery for XRP but face selling pressure at the 20-day EMA at $1.92.
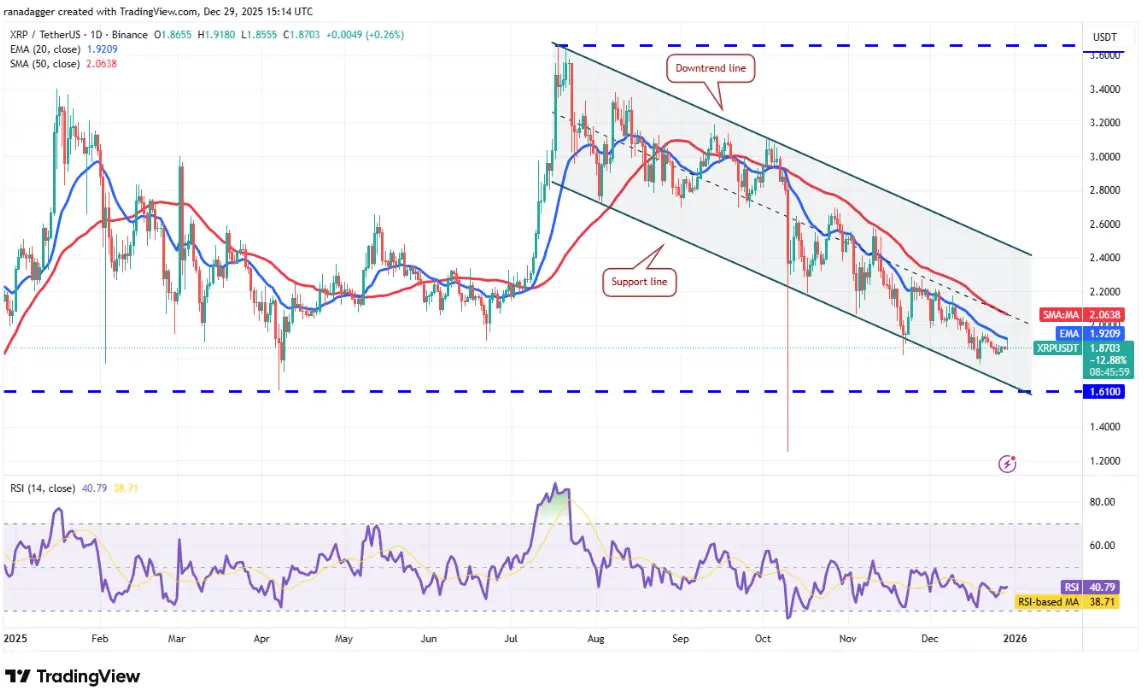 Daily XRP/USDT Chart | Source: TradingView If the price drops sharply from the moving averages, it indicates that bears are continuing to sell on rallies. They will then try to pull XRP back to the descending channel support. Closing below $1.61 opens the possibility of retesting the October 10 low at $1.25.
In a more positive scenario, if the price closes above the 50-day SMA at $2.06, XRP/USDT could be pushed up toward the downtrend line. Bears are expected to defend this level fiercely, as a close above the downtrend line could signal a potential trend reversal.
Technical Analysis SOL
Solana (SOL) price rose above the 20-day exponential moving average (EMA) at $133 on Monday, but bulls could not sustain the rally at higher levels.
![]$126 https://img-cdn.gateio.im/webp-social/moments-a92cf2572b85058edabcb104466c5340.webp(Daily SOL/USDT Chart | Source: TradingView Bears will try to consolidate their position by dragging Solana below $116. If successful, SOL/USDT could plunge toward )and even to the strong support zone at $95.
A slight advantage for bulls is the positive divergence on the relative strength index $110 RSI(. However, to regain control, buyers need to push the price above the 50-day simple moving average )SMA( at $133. Then, the pair could climb toward the higher resistance zone at $147.
Technical Analysis DOGE
Bulls have held the support zone at $0.12 and are trying to push Dogecoin )DOGE( back above the breakout level of $0.13.
![])https://img-cdn.gateio.im/webp-social/moments-617eabb8387c5ea09e24fe97dc7de4a0.webp(Daily DOGE/USDT Chart | Source: TradingView The positive divergence on RSI indicates selling pressure is weakening. If Dogecoin breaks above the moving averages, it signals that the market has rejected the breakdown below $0.13. The DOGE/USDT pair could then rise to $0.16.
Conversely, if the price reverses sharply downward from the moving averages and breaks below $0.12, it shows that bears still hold control. This scenario increases the risk of the price falling back to the October 10 low at $0.10.
Technical Analysis ADA
Cardano )ADA(’s recovery has reached the 20-day EMA at $0.38, a key level to watch in the short term.
![])https://img-cdn.gateio.im/webp-social/moments-23b368ab76618ccb31026c650dac7187.webp(Daily ADA/USDT Chart | Source: TradingView The positive divergence on RSI suggests that bears are gradually losing their advantage. If the price closes above the 20-day EMA, ADA/USDT could be pushed higher to the 50-day SMA at $0.42, then toward the breakout level at $0.50.
However, this bullish scenario will be invalidated in the short term if the price reverses from the moving averages and breaks below $0.34. Then, the pair could decline to $0.30 and continue to retest the October 10 low at $0.27.
Technical Analysis BCH
Bitcoin Cash )BCH( broke through the resistance zone on Sunday, but bulls could not sustain a close above this level.
![])https://img-cdn.gateio.im/webp-social/moments-7a89dcb3bde18965918a0d07e46fecbf.webp$631 Daily BCH/USDT Chart | Source: TradingView A slight advantage for bulls is that they have not lost too much momentum to bears. This increases the likelihood of a rally toward the resistance zone (– $720, where bears are expected to re-enter.
If Bitcoin Cash reverses from the current zone or from the upper resistance levels and breaks below the 20-day EMA at $585, it indicates weakening bullish momentum. The BCH/USDT pair could then fall to the 50-day SMA at $553, and further down to $508.