Solana now holds above $120 as ETF demand remains steady while futures traders build short positions near major support.
Solana currently holds above $120, which is interesting because this is happening during a tense phase for the market.
ETF demand has been relatively steady, with futures traders leaning defensive. Price action now sits between firm support and stubborn resistance and the next move depends on how these forces resolve.
Solana Holds Above $120 as ETF Demand Stays Active
Solana currently holds above $120 even after a near 2% drop earlier this week. This level has acted as a short-term floor and buyers are stepping in near that zone, but confidence looks thin.
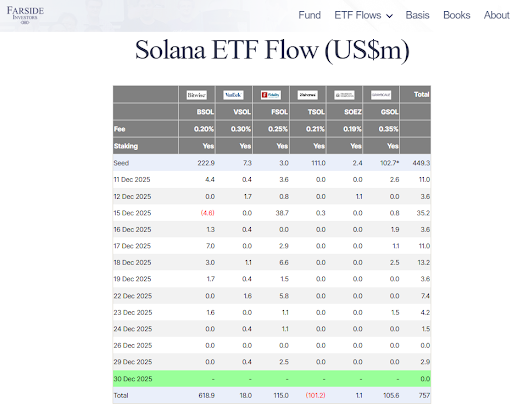
ETF demand stays steady despite price weakness on Solana | source: FarSide
Meanwhile, Solana focused ETFs continue to attract capital and last week saw $13.14 million in inflows. That figure dropped from $66.55 million the week before, and slower inflows tend to indicate market caution rather than an exit.
Monday added another $2.93 million while Friday showed flat flows and these numbers show steady interest rather than aggressive buying.
Retail Traders Turn Defensive as Futures Activity Rises
Meanwhile, derivatives data tells a different story. Futures Open Interest climbed to $7.68 billion according to data from Coinglass. This is notable because the prior day showed $7.54 billion.
In all, rising Open Interest means that fresh capital is entering the market.
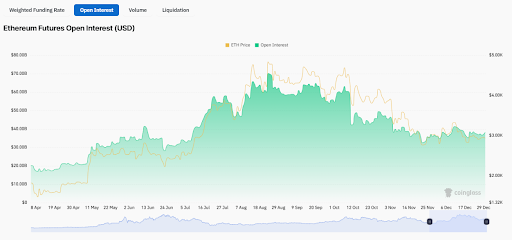
Open interest has been in a steady rise for a while | source: Coinglass
Direction matters more than size and the long-to-short ratio trended lower. As of writing, short positions now make up about 52.5% of open trades and this has marked a jump from below 50% a day earlier.
Many traders are now betting on downside moves and this stance indicates caution rather than confidence.
Price Structure Remains Fragile Near $120
According to the charts, Solana trades inside a descending wedge on the daily chart.
The two trendlines are now converging as price compresses, and analysts say that such structures often come before heavy moves in any direction.
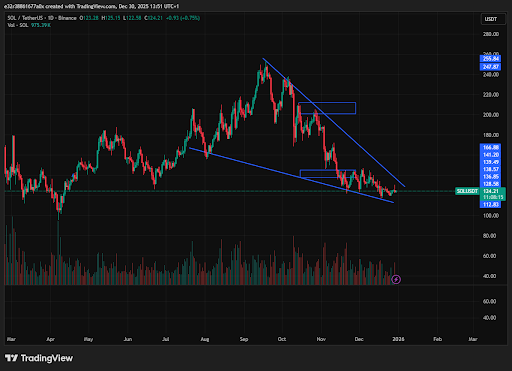
Solana trades in a descending wedge | source: TradingView
A recent rejection near $130 pushed the price lower. That move increased pressure on support near $115.
This level aligns with the lower wedge boundary, and a failure to hold $115 could expose deeper levels.
Related Reading: Solana ETFs Start Strong In 2025, Showing Institutional Demand Beyond Bitcoin Exposure
Indicators Offer No Clear Answer Yet
According to the charts, the technical indicators are showing mixed signals. For example, the Relative Strength Index sits near 41, which is below the neutral 50 line.
In sum, selling pressure still outweighs buying interest.
The RSI movement has also been flat so far, as buyers have not shown strong conviction. This keeps the short-term outlook cautious, especially considering how the MACD shows the opposite.
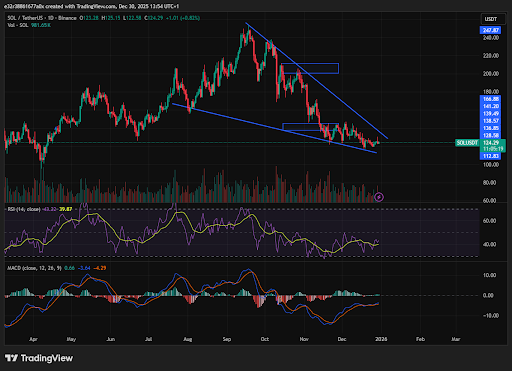
MACD and RSI throw mixed signals | source: TradingView
The indicator bounced off its signal line recently and is now drifting closer to zero. This indicates that selling pressure may ease.
Overall, these signals do not confirm a breakout. They show balance shifting slowly and traders often wait for price confirmation rather than indicator hints before making decisions.
Disclaimer: The information on this page may come from third parties and does not represent the views or opinions of Gate. The content displayed on this page is for reference only and does not constitute any financial, investment, or legal advice. Gate does not guarantee the accuracy or completeness of the information and shall not be liable for any losses arising from the use of this information. Virtual asset investments carry high risks and are subject to significant price volatility. You may lose all of your invested principal. Please fully understand the relevant risks and make prudent decisions based on your own financial situation and risk tolerance. For details, please refer to
Disclaimer.