The Bitcoin rally in 2025 is based on a strong liquidity foundation, but the actual picture in the final quarter shows several notable changes. Some analysts point out that global liquidity indicators remain at record levels and believe the upward wave will continue. Meanwhile, according to high-frequency tracking data from CrossBorder Capital, the rally peaked in early November, with the US liquidity cycle beginning to reverse.
Both perspectives are based on actual data. The question is whether absolute liquidity levels matter more than their direction, and what this means for Bitcoin as we move into 2026.
Record highs, but momentum is waning
Data from the Bank for International Settlements (BIS) shows that 2025 started with real expansion: cross-border bank credit in foreign currencies reached $34.7 trillion in Q1, with USD, EUR, and JPY credit increasing by 5–10% compared to the same period last year.
By the end of June, BIS’s global liquidity index still indicated foreign currency credit increased by 6% in USD and 13% in EUR compared to the same period. This is the context that bullish Bitcoin advocates cite to affirm that liquidity hit record highs and remained elevated in the first half of the year.
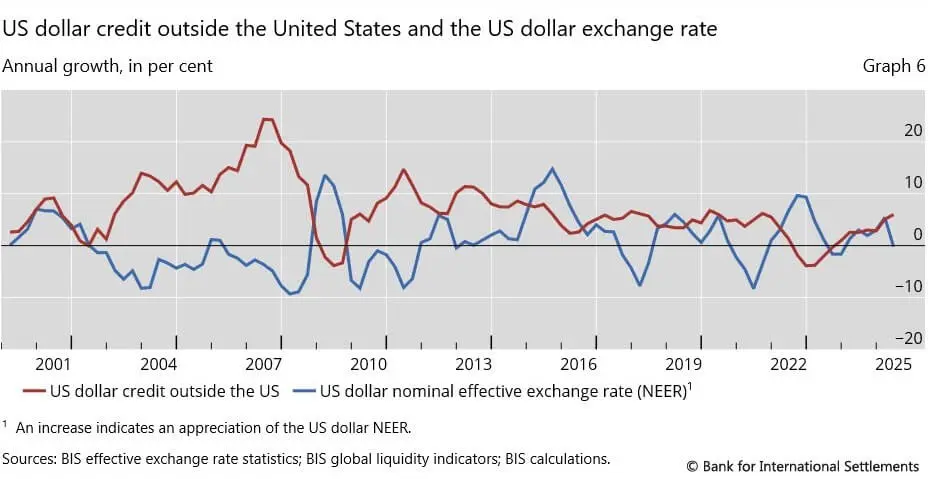 US dollar credit outside the US and USD exchange rates show annual growth rates from 2001 to 2025. However, according to CrossBorder Capital’s proprietary data, which aggregates central bank balance sheets, shadow banking flows, and credit momentum to estimate global liquidity, the story in Q4 is different.
Michael Howell’s October note states: “Global liquidity reached nearly a record level of around $185 trillion but is struggling to increase further,” with waning momentum due to Fed quantitative tightening, China’s slower money printing, and the USD no longer being as weak as before, affecting shadow monetary base.
An update on 12/5 estimates global liquidity at $187.3 trillion, up $750 billion in a week but still below the early November peak, indicating recent growth has “stalled.”
By 12/23, the research group confirmed: “Global liquidity decreased again last week,” estimated to have fallen by $592 billion to $186.2 trillion, with both short-term and long-term growth indicators reversing. Howell added that liquidity has declined by about $1.8 trillion since early November, and the US liquidity cycle appears to have peaked.
In summary, global liquidity remains high, but Q4 has been flat or slightly contracting, no longer creating new monthly highs. Absolute levels are still elevated, but the trend in the final quarter is downward or sideways.
US net liquidity tightening
The mechanisms tracked by crypto traders under the term “net liquidity” (total Fed assets minus Treasury accounts, minus reverse repos) clarify domestic developments.
- The Fed’s balance sheet report shows total assets decreased by about $132 billion over the last two quarters, to $6.6 trillion at the end of September, with securities holdings down $126 billion.
- Treasury accounts increased by roughly $440 billion since the debt ceiling deal mid-year, while quantitative tightening reduced reserves by about $450 billion.
- At the same time, the Fed’s overnight reverse repo facility, which held over $2 trillion in 2022, nearly zeroed out for the first time in years, removing a large liquidity buffer.
These factors, combined with the USD weakening by about 10% in 2025 (according to DXY), eased global liquidity, but recent USD recovery has limited liquidity growth in November and December.
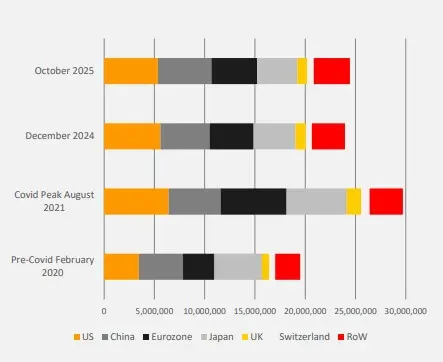 The chart shows changes in central bank balance sheets of major economies from February 2020 (pre-COVID-19) to October 2025, illustrating periods of easing and tightening | Image: Global Liquidity Indexes### Overall Perspective
Overall, global liquidity surged from late 2024 to mid-2025, remaining near record levels, providing a solid foundation for the Bitcoin cycle rather than relying on a “bubble.” However, the strong upward momentum, especially from the unwinding of the Fed’s reverse repo base, has now ended.
Net US liquidity in Q4 has stagnated or slightly declined due to quantitative tightening, larger Treasury accounts, and the “exhaustion of repo reserves,” offsetting earlier gains. Howell’s data shows that since early November, total global liquidity has stopped setting new highs and has decreased.
Thus, both sides are correct in their individual claims: global liquidity remains high and at record levels, while US net liquidity has plateaued and contracted in Q4.
Key driving factors
- The Fed has ended quantitative tightening, stopped shrinking its balance sheet, and bought some short-term bonds, easing reserve depletion pressures.
- The boost from reverse repos has ended.
- Most additional momentum from money market funds withdrawing from the Fed’s reverse repo has passed, and this process is not repeating.
From now on, reserve changes depend on bond issuance and Fed policy actions, rather than a “$2 trillion reserve stock.” Liquidity levels are no longer being squeezed but are also not being mechanically pumped.
Factors such as bond issuance, Treasury accounts, and central bank policy decisions will determine whether global liquidity sustains or declines.
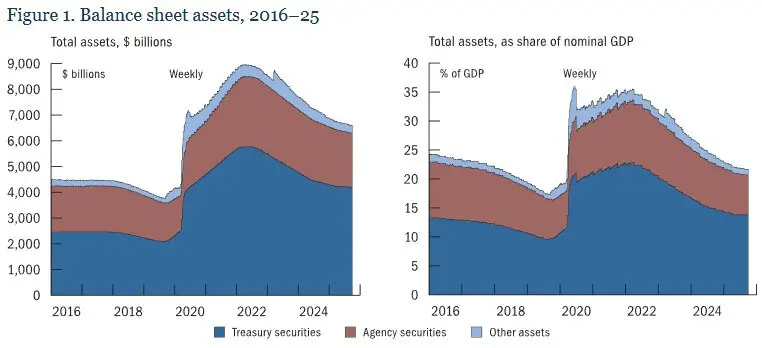 The Federal Reserve’s balance sheet from 2016 to 2025 shows expansion during the COVID-19 period, followed by quantitative tightening, reducing holdings to pre-pandemic levels.### Implications for Bitcoin
The path ahead may be “high but volatile”: global liquidity remains elevated but could decline slightly or recover depending on policy and USD movements.
Bitcoin continues to rely on the accumulated high liquidity from the first half of the cycle. However, the momentum in Q4 has shifted from strong support to a “mixed or weak” state. The next steps depend on how much the Fed cuts rates, whether the USD rebounds, and if other central banks inject liquidity again.
Data indicates that the liquidity wave initiating this cycle is still ongoing but no longer rising sharply. Bitcoin is not facing severe liquidity shortages but also lacks “fresh fuel” if policy decisions do not favor expansion.
This is not a bearish forecast but an assessment that the easiest part—leveraging the mechanical momentum from reverse repo and early-cycle liquidity—has passed. The next phase depends on policy, not just liquidity “pipelines.”
Shach Sanh
Disclaimer: The information on this page may come from third parties and does not represent the views or opinions of Gate. The content displayed on this page is for reference only and does not constitute any financial, investment, or legal advice. Gate does not guarantee the accuracy or completeness of the information and shall not be liable for any losses arising from the use of this information. Virtual asset investments carry high risks and are subject to significant price volatility. You may lose all of your invested principal. Please fully understand the relevant risks and make prudent decisions based on your own financial situation and risk tolerance. For details, please refer to
Disclaimer.