Date: Sat, Dec 27, 2025 | 10:25 AM GMT
Dash (DASH), the privacy-focused token, has struggled alongside the broader altcoin market over the past month, shedding nearly 35% of its value amid persistent selling pressure. However, price action is now starting to stabilize, with DASH trading in the green today and posting a modest 4% recovery. More importantly, the latest chart structure suggests that the recent rebound may not be just a short-lived bounce, but part of a developing bullish setup.
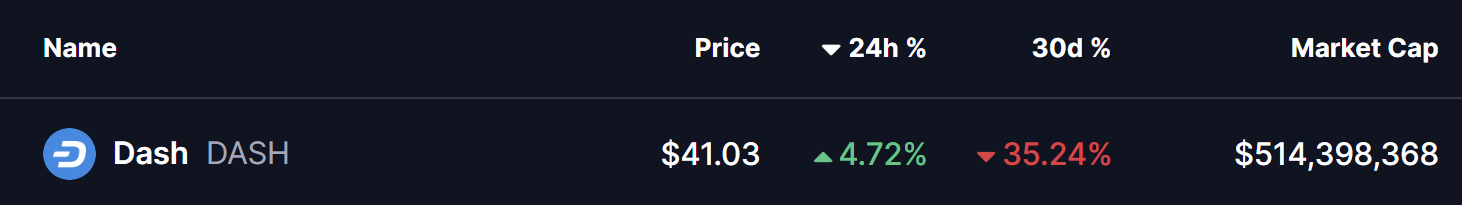
Source: Coinmarketcap
Harmonic Pattern Hints at Potential Upside
On the 4-hour timeframe, DASH is forming a Bearish Butterfly harmonic pattern. While the name may sound negative, this pattern typically allows for a strong upside move during its CD leg before price reaches the final reversal zone.
The structure began at Point X near $42.64, followed by a sharp decline into Point A. From there, DASH rebounded toward Point B, where sellers briefly reasserted control, before price dipped once again into Point C around $36.17. This region has since acted as a firm base, with buyers stepping in aggressively to defend the lows.
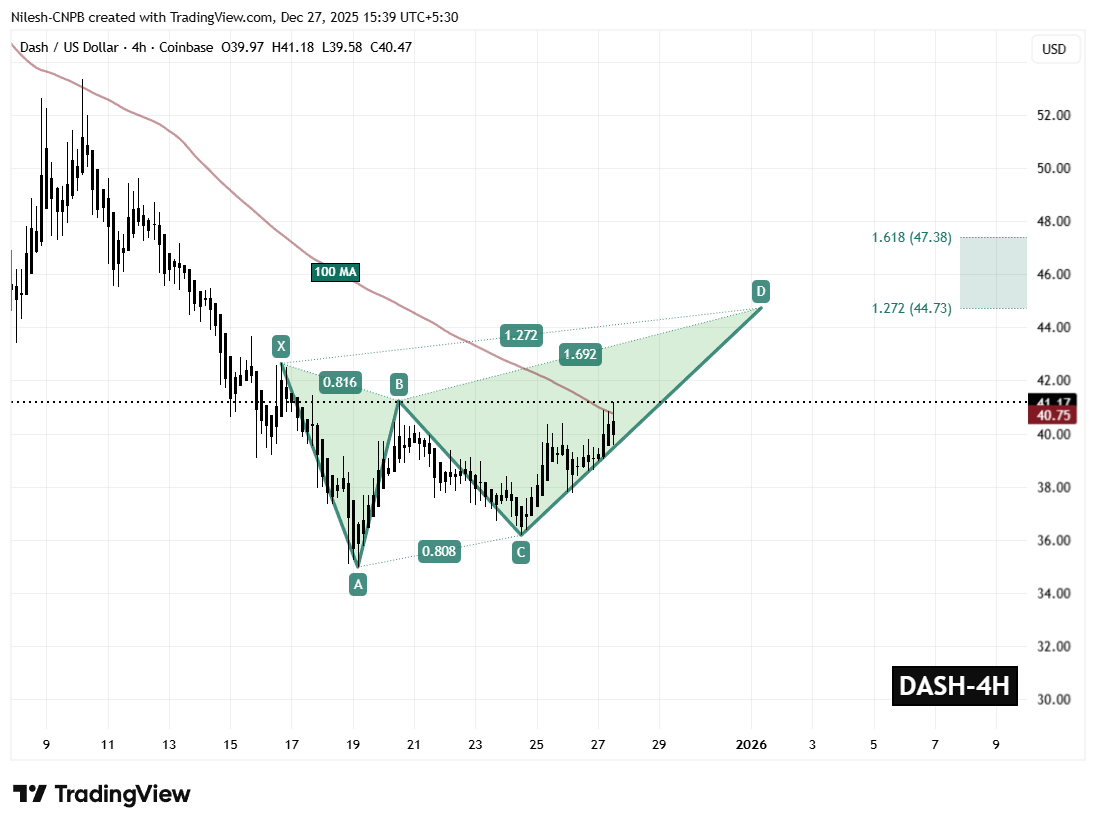
Dash (DASH) 4H Chart/Coinsprobe (Source: Tradingview)
From Point C, DASH has staged a steady recovery and is currently trading near $41.17. This move indicates improving momentum and suggests that the CD leg of the harmonic structure is actively unfolding.
Adding further strength to this setup is DASH’s successful reclaim of the 100-period moving average near $40.75. This level had previously acted as dynamic resistance throughout the downtrend, and flipping it into support marks a meaningful shift in short-term market structure.
What’s Next for DASH?
As long as DASH holds above the $39.58 support zone, the bullish harmonic structure remains intact. Continued strength above the 100 MA would likely reinforce buyer confidence and keep the CD leg in play.
If momentum persists, the Bearish Butterfly projection points toward the Potential Reversal Zone (PRZ) between $44.73 and $47.38. This area represents the typical completion zone for the pattern and offers an upside window of roughly 14% from current levels before sellers may attempt to regain control.
On the flip side, a breakdown below $39.58 would weaken the bullish outlook and risk invalidating the harmonic structure. Such a move could expose DASH to renewed downside pressure and delay any sustained recovery attempt.
For now, DASH’s ability to hold above reclaimed moving average support and continue building higher lows will be critical in determining whether this recovery can extend further in the sessions ahead.
Disclaimer: The views and analysis presented in this article are for informational purposes only and reflect the author’s perspective, not financial advice. Technical patterns and indicators discussed are subject to market volatility and may or may not yield the anticipated results. Investors are advised to exercise caution, conduct independent research, and make decisions aligned with their individual risk tolerance.
Disclaimer: The information on this page may come from third parties and does not represent the views or opinions of Gate. The content displayed on this page is for reference only and does not constitute any financial, investment, or legal advice. Gate does not guarantee the accuracy or completeness of the information and shall not be liable for any losses arising from the use of this information. Virtual asset investments carry high risks and are subject to significant price volatility. You may lose all of your invested principal. Please fully understand the relevant risks and make prudent decisions based on your own financial situation and risk tolerance. For details, please refer to
Disclaimer.
Related Articles
Bitcoin Breaks Through $73,000, Ethereum Surges to $2,200! Tom Lee: Stock Market May Have Hit Bottom This Month, Rising Oil Prices Could Be Bullish
Bitcoin briefly broke through $73,200 this morning, while Ethereum similarly surpassed $2,200. The fear index rose to 23, indicating extreme panic. Tom Lee stated on CNBC that the U.S. stock market may have already formed a bottom, tech stocks are performing well, rising oil prices could be favorable for U.S. stocks, and he believes the current situation will not become a systemic issue.
動區BlockTempo25m ago
TAO (Bittensor) Up 7.25% in 24 Hours
Gate News Update: On March 16, according to Gate's market data, as of the time of publication, TAO (Bittensor) is trading at 276.85 USD, up 7.25% in the past 24 hours, with a high of 291.45 USD and a low of 193.37 USD. The 24-hour trading volume reached 668 million USD. The current market cap is approximately 2.982 billion USD, an increase of 201 million USD compared to yesterday.
## Recent Important Updates on TAO:
1️⃣ **Positive Technical Signals Emerging in the Market**
Technical analysis indicates that TAO's price is forming an Adam-Eve pattern, which typically signals the formation of an uptrend. Analysts have observed that this technical pattern could help push TAO's price above 270 USD, which aligns with current price performance. The
GateNews25m ago
XRP Price Shows Significant Recovery, Is $3 Back On The Menu?
The price of XRP shows a pent-up bullish momentum in the RSI chart.
The token has also entered a decisive phase at the 200 EMA, which could push it above $3.
Ongoing upgrades, particularly ZKP integration, could drive greater institutional adoption of XRPL.
XRP staged a huge rally from $1.40 to
Blockzeit36m ago
USDC Rises Against the Trend: Trading Volume Surpasses USDT for the First Time, Leading Holdings in Five Countries
Mizuho Financial Group research shows that USDC's adjusted trading volume will reach $2.2 trillion in 2026, surpassing USDT's $1.3 trillion for the first time, demonstrating its growth in the stablecoin market. USDC performs better in regulated markets, while USDT maintains dominance in emerging markets, reflecting geographic differentiation in the stablecoin market. This phenomenon is closely related to the different regulatory strategies adopted by both.
MarketWhisper39m ago
Why Did Bitcoin Rise Today? Weekly Close Reclaims 70K, Crypto Czar Sends Anti-War Signal
Bitcoin closed last week above $70,000, marking its highest level since March. White House advisor Sacks' anti-war statement drove a market rebound, demonstrating the importance of cryptocurrency in the geopolitical environment. Technical analysis shows Bitcoin holding steady at key support levels, with potential for further gains toward $75,000 to $80,000. Markets remain vigilant about geopolitical risks, which could impact near-term movements.
MarketWhisper50m ago
Today the cryptocurrency fear and greed index rose to 23, with the market in a state of extreme panic.
Gate News, on March 16, according to Alternative.me data, the cryptocurrency fear and greed index rose to 23 today, compared to 15 yesterday, with the market in an "extreme panic state".
GateNews54m ago