
Date: Mon, Dec 29, 2025 | 04:10 PM GMT
The broader cryptocurrency market has seen a short-term pullback over the past few hours, with Bitcoin (BTC) slipping below the $87K level after briefly trading above $90K. This retracement has spilled over into major altcoins, including Avalanche (AVAX), which is also experiencing mild selling pressure.
AVAX is trading slightly in the red today, but beneath the surface, its price structure is beginning to tell a more constructive story. The 4-hour chart reveals a high-probability bullish setup that could hint at a stronger upside move once momentum fully shifts back in favor of buyers.
Source: Coinmarketcap
Power of 3 Pattern Takes Shape
On the 4-hour timeframe, AVAX appears to be forming a classic Power of 3 (PO3) pattern — a structure commonly linked to smart money accumulation and trend continuation. This pattern typically unfolds in three distinct phases: accumulation, manipulation, and expansion, often preceding a sharp directional move.
Accumulation Phase
During the accumulation phase, AVAX spent an extended period trading sideways within a defined range, capped by resistance near $14.80 and supported around $12.64. This tight consolidation reflected balance between buyers and sellers, allowing larger participants to quietly build positions while volatility remained compressed.
The prolonged range-bound action signaled that selling pressure was gradually being absorbed, even as the broader trend remained weak.
Manipulation Flush
The manipulation phase played out when AVAX briefly broke below the $12.64 support, triggering a sharp downside move toward the $11.31 area. This sudden drop resembles a classic liquidity sweep, where stop-loss orders and late sellers are flushed out before a reversal takes place.
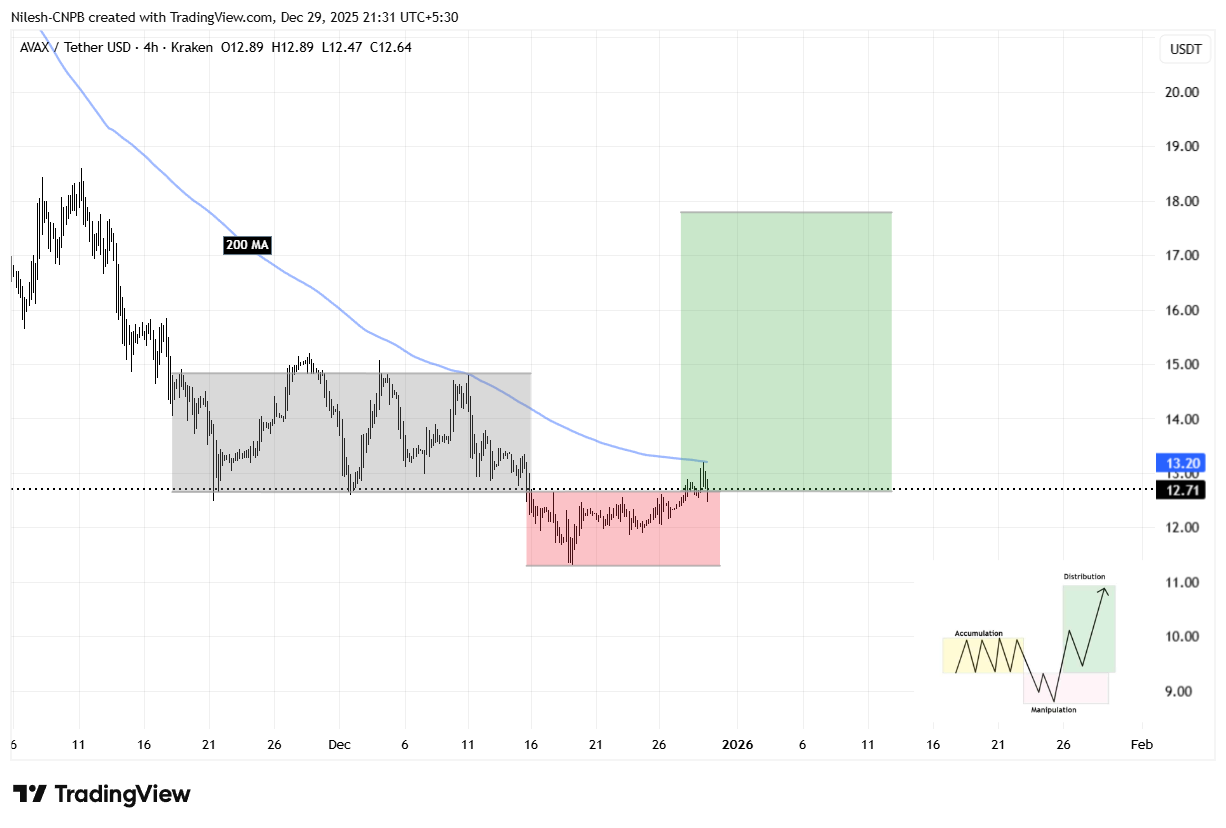
Avalanche (AVAX) 4H Chart/Coinsprobe (Source: Tradingview)
Expansion Phase Begins to Unfold
Following the sweep of lows, AVAX rebounded quickly and reclaimed the $12.64 level, signaling that buyers have stepped back in with conviction. This recovery suggests the early stages of the expansion phase may now be underway.
Price is currently pushing toward the 200-hour moving average near $13.20, a level that has consistently acted as dynamic resistance during the broader downtrend. A sustained move above this moving average would represent a meaningful shift in short-term momentum and strengthen the bullish reversal narrative.
What’s Next for AVAX?
If AVAX manages to break and hold above the 200-hour moving average, the next major resistance lies at $14.80 — the upper boundary of the prior accumulation range. A decisive reclaim of this zone would confirm a bullish breakout and likely attract fresh momentum participation.
Based on the Power of 3 structure, a successful breakout could open the door for a measured move toward the $18.29 region, derived from projecting the height of the accumulation range upward from the breakout point. This target aligns closely with the expansion zone highlighted on the chart.
That said, caution remains necessary. A failure to hold above $12.64 would weaken the expansion thesis and could force AVAX back into consolidation, delaying any meaningful upside continuation.
For now, AVAX sits at a technically critical inflection point. The structure suggests that smart money positioning may already be in progress, with the coming sessions likely to determine whether the expansion phase fully materializes.
Disclaimer: The views and analysis presented in this article are for informational purposes only and reflect the author’s perspective, not financial advice. Technical patterns and indicators discussed are subject to market volatility and may or may not yield the anticipated results. Investors are advised to exercise caution, conduct independent research, and make decisions aligned with their individual risk tolerance.
About Author: Nilesh Hembade is the Founder and Lead Author of Coinsprobe, with over 5 years of experience in the cryptocurrency and blockchain industry. Since launching Coinsprobe in 2023, he has been providing daily, research-driven insights through in-depth market analysis, on-chain data, and technical research.
Disclaimer: The information on this page may come from third parties and does not represent the views or opinions of Gate. The content displayed on this page is for reference only and does not constitute any financial, investment, or legal advice. Gate does not guarantee the accuracy or completeness of the information and shall not be liable for any losses arising from the use of this information. Virtual asset investments carry high risks and are subject to significant price volatility. You may lose all of your invested principal. Please fully understand the relevant risks and make prudent decisions based on your own financial situation and risk tolerance. For details, please refer to
Disclaimer.
Related Articles
Bitcoin Price Enters Critical Resistance Zone! Renowned Trader Eugene: Already Reversed to Go Long
The cryptocurrency market rebounded this morning, with Bitcoin briefly breaking through $74,000 to reach a new high. Known trader Eugene turned bullish, believing the market is showing resilience. Ethereum and Sol also gained, with over $300 million in liquidations across the network in the past 24 hours, mainly concentrated in Ethereum. Eugene maintains an optimistic outlook on the market, expecting that if Bitcoin can firmly hold above $74,000, it will drive an overall market rally.
ChainNewsAbmedia2m ago
MORPHO Rockets 9% – Key Resistance Could Determine the Next Move
MORPHO surged 9% as spot trading volume jumped 52 percent in 24 hours.
Price now tests a critical $2.08 supply zone that may trigger breakout or pullback.
Growing TVL supports bullish momentum, indicating rising user confidence and ecosystem participation.
Morpho — MORPHO, has captured t
CryptoNewsLand16m ago
ETH's current key resistance levels are $2,400 and $2,600
Gate News reported that on March 16, according to on-chain analyst Ali Charts' monitoring, Ethereum spot ETFs accumulated net inflows of 83,000 ETH over the past three weeks, valued at approximately $193 million. Meanwhile, ETH price has reclaimed the $2,200 level and established it as a support level, with key resistance levels currently at $2,400 and $2,600.
GateNews35m ago
CryptoQuant Analyst: Bitcoin Price Returns Above Fair Value, Short-Dominated Pattern Reversed
CryptoQuant analyst Axel Adler Jr stated that Bitcoin price has returned to fair value, with market structure significantly transformed compared to two weeks ago. The phase dominated by bears has ended, with prices rebounding above fair value, indicating a warming market.
GateNews51m ago
BTC Short-term Decline of 0.61%: Support Level Breakdown and Leveraged Liquidations Drive Cascading Price Decline
Between 2026-03-16 08:30 and 08:45 (UTC), BTC experienced significant price movement, with a 15-minute return rate of -0.61%. The price range was 72903.3 to 73366.4 USDT, with a volatility amplitude of 0.63%. This short-cycle decline was at the upper limit of normal price fluctuations, drawing market attention and indicating increased market volatility and heightened trading activity.
The primary driver of this price movement was BTC breaking through a key short-term support level, which triggered technical stop-loss orders and accelerated a chain reaction of selling pressure that further drove prices lower.
GateNews1h ago
Avalanche Hits Key Resistance – Is AVAX Headed Toward $8.25?
AVAX struggles at $9.77 resistance, signaling potential downward movement toward support.
Strong selling pressure dominates, supported by spot outflows and derivative short positions.
A drop to $8.25 could occur if resistance holds and buyers fail to push higher.
Avalanche — AVAX, has
CryptoNewsLand1h ago
