
**Date: **Mon, Jan 05, 2026 | 07:55 AM GMT
As 2026 kicks off, the broader cryptocurrency market is showing renewed stability. Ethereum (ETH) is up around 4% on the week, and improving sentiment is gradually spreading across major altcoins — including Ethena (ENA).
ENA has already surged more than 14% on a weekly basis, but the more important development is unfolding beneath the surface. While short-term strength is encouraging, the bigger story lies in the structure forming on the chart. Recent price action suggests a meaningful shift in market behavior — one that could mark the early stages of a bullish continuation if key resistance levels are reclaimed.
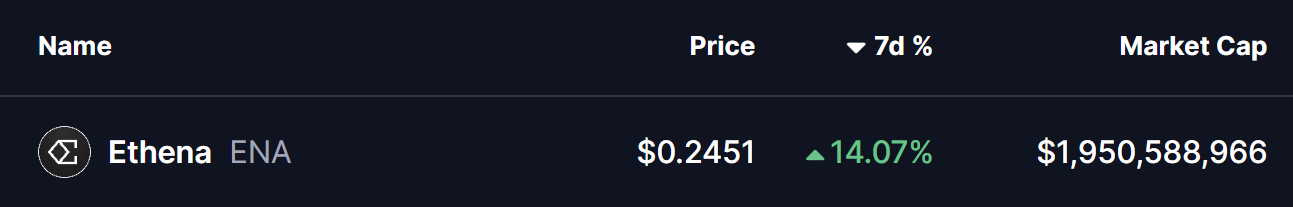
Source: Coinmarketcap
Rounding Bottom in Play
On the daily timeframe, ENA appears to be forming a rounding bottom pattern, a classic bullish reversal structure that typically develops after a prolonged corrective phase.
The setup began after ENA faced a firm rejection near the $0.3028–$0.2837 resistance zone late last month. That rejection triggered a sharp decline, dragging price down toward the $0.1935 area. Importantly, sellers failed to push price meaningfully lower from there, and strong demand emerged at those levels. Over time, ENA stabilized, volatility compressed, and price began to curl higher — completing the rounded base structure.
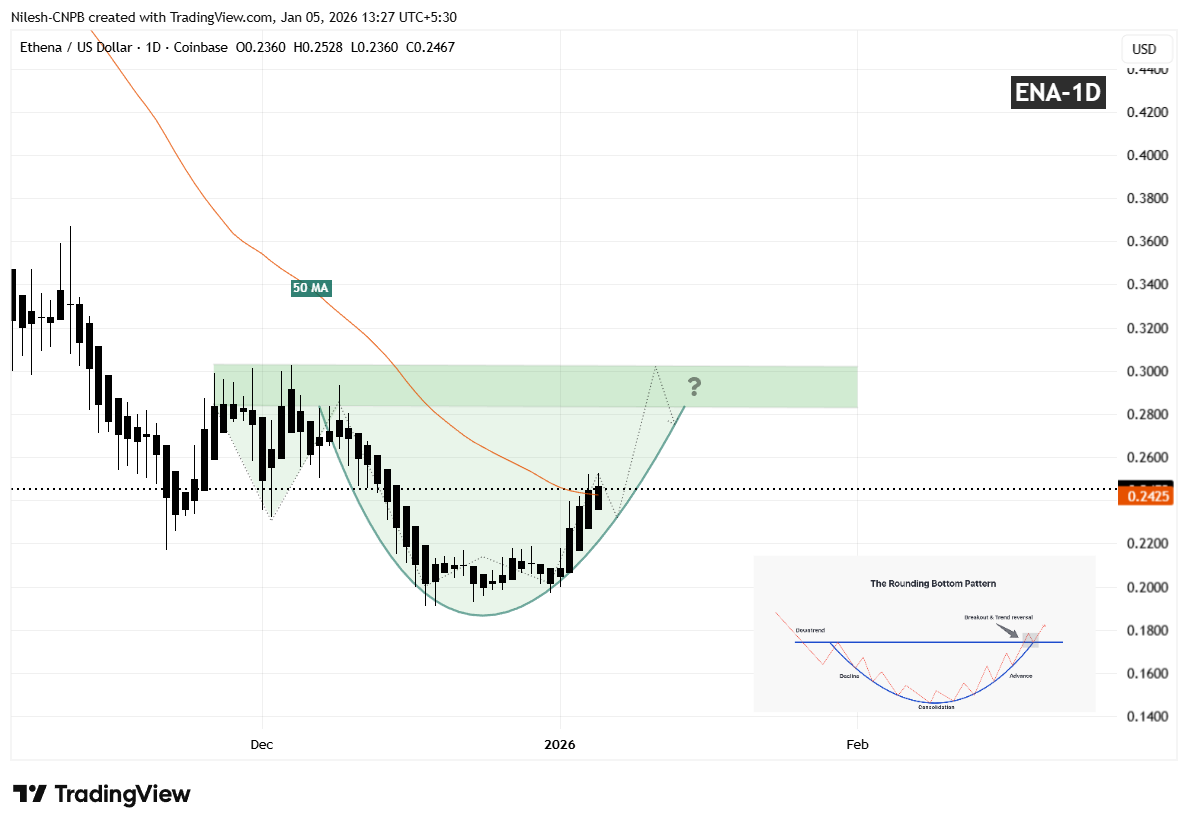
Ethena (ENA) Daily Chart/Coinsprobe (Source: Tradingview)
Since carving out that bottom, ENA has started to move higher in a smooth, rounded fashion, closely matching the textbook characteristics of a developing rounding bottom. The recent recovery has also brought price back toward the 50-day moving average near $0.2451, a level that previously acted as resistance and is now being tested as potential support.
What’s Next for ENA?
If ENA continues to hold above the 50-day MA, that level could act as a solid short-term base for further upside attempts. A clean and decisive breakout above the $0.3028–$0.2837 resistance zone, followed by sustained acceptance above it, would validate the entire reversal pattern and likely open the door for a broader bullish expansion phase.
Until such a breakout occurs, the pattern remains in development. Short-term consolidation or shallow pullbacks remain possible as price digests recent gains. However, as long as ENA continues to form higher lows above the established base, the broader bottoming structure remains intact and constructive.
For now, the chart suggests ENA is approaching a critical confirmation phase — one that could determine whether this recovery evolves into a sustained bullish trend as the new year unfolds.
Disclaimer: The views and analysis presented in this article are for informational purposes only and reflect the author’s perspective, not financial advice. Technical patterns and indicators discussed are subject to market volatility and may or may not yield the anticipated results. Investors are advised to exercise caution, conduct independent research, and make decisions aligned with their individual risk tolerance.
About Author: Nilesh Hembade is the Founder and Lead Author of Coinsprobe, with over 5 years of experience in the cryptocurrency and blockchain industry. Since launching Coinsprobe in 2023, he has been providing daily, research-driven insights through in-depth market analysis, on-chain data, and technical research.
Disclaimer: The information on this page may come from third parties and does not represent the views or opinions of Gate. The content displayed on this page is for reference only and does not constitute any financial, investment, or legal advice. Gate does not guarantee the accuracy or completeness of the information and shall not be liable for any losses arising from the use of this information. Virtual asset investments carry high risks and are subject to significant price volatility. You may lose all of your invested principal. Please fully understand the relevant risks and make prudent decisions based on your own financial situation and risk tolerance. For details, please refer to
Disclaimer.
Related Articles
On-chain analyst: Bitcoin market overheating phenomenon eliminated, but seller pressure remains unrelieved
On March 18, on-chain data analyst Axel released a report indicating that the Bitcoin market has moved out of an overheated state, but selling pressure still exists and no reversal signals have appeared. The MVRV Z-Score indicator has dropped to 0.674, suggesting that the bubble has been deflated; meanwhile, the aSOPR indicator remains below 1.0, indicating that the market is still in a loss-selling phase, with a rebound facing the risk of selling pressure.
GateNews4m ago
Ethereum Surges 25% in March, Institutional Buying and ETF Issuance Drive ETH Price Gains
Analysts point out that Ethereum has recently outperformed the S&P 500 index, though Federal Reserve policy decisions may impact its upward momentum. Despite prices remaining below last year's highs, institutional investors are actively increasing positions, demonstrating strengthened confidence in Ethereum, while the launch of new ETFs also reflects sustained market interest in digital assets and decentralized finance.
GateNews10m ago
Bitcoin Faces Obstacle at $75,000: Federal Reserve Meeting and Middle East Situation May Become Key Turning Points
Bitcoin's upward momentum weakened after touching $75,000, with market concerns about a near-term peak. Despite continued institutional accumulation pushing total open interest to $58 billion, prices face pressure from macro uncertainty. Bitcoin ETF inflows exceeding $1.5 billion support the price. Market focus remains on the Federal Reserve meeting and geopolitical situation, which may impact near-term trends.
GateNews27m ago
Why Does Ethereum Price "Rise with Bitcoin but Ignore Fundamentals"? Bitwise Reveals: 65% of Price Movement Determined by Bitcoin
Bitwise's research indicates that Ethereum's price movements are primarily driven by Bitcoin and macroeconomic liquidity, with relatively weak influence from on-chain fundamentals. The model shows that Bitcoin volatility can explain 65% of Ethereum's volatility, while accommodative monetary conditions and ETF fund flows also contribute to Ethereum's price. The current market views Ethereum as a "network commodity," and its price movements in the short term may still be dominated by Bitcoin and the liquidity environment.
GateNews32m ago
BitMine Stock Price Surges 16%: Ethereum Price Mismatch Creates Arbitrage Window, $24 Becomes Key Watershed
BitMine (BMNR) stock price has surged recently, with a single-day gain of nearly 14% on March 16, closely related to its held Ethereum assets. However, BMNR and Ethereum show a phase mismatch, leading to short-term decoupling. Institutional funds are arbitraging this opportunity, with significantly increased trading volume. The technical side shows positive signals, but key resistance is around the $24 level, with attention needed on breakthrough performance at this level and subsequent price action.
GateNews41m ago
