
Key Takeaways
-
SKY is forming a rounding bottom pattern on the daily chart
-
Price has rebounded strongly from the $0.0419 demand zone
-
Rising volume supports improving bullish momentum
-
A breakout above $0.0778 could confirm trend reversal
-
Pattern projection points toward the $0.11 region
Sky (SKY), the native governance and utility token of the Sky Protocol (formerly MakerDAO), has stepped into the spotlight after posting a strong daily move of over 8%, accompanied by a sharp 35% surge in trading volume. While the short-term momentum is drawing attention, the more compelling story is unfolding on the higher timeframe chart.
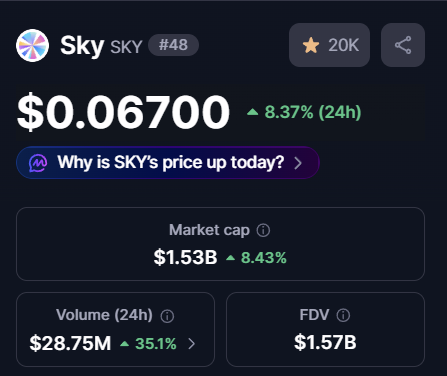
Source: Coinmarketcap
Price action is now forming a classic bullish reversal structure — one that often signals the transition from prolonged weakness into a new recovery phase.
Rounding Bottom Pattern Signals Trend Shift
On the daily timeframe, SKY appears to be completing a rounding bottom formation, a well-known bullish reversal pattern that typically develops after extended downtrends. This structure reflects a gradual shift in market psychology, where persistent selling pressure slowly fades and long-term accumulation begins to dominate.
Earlier in the trend, SKY faced repeated rejection near the $0.0778 neckline resistance, which triggered a steep sell-off. That decline ultimately bottomed near $0.0419, marking a critical demand zone where buyers aggressively stepped in and prevented further downside.
Since establishing this low, price action has steadily curved higher, forming a smooth rounded base. This gradual recovery — rather than a sharp V-shaped bounce — suggests healthier accumulation rather than short-term speculation.
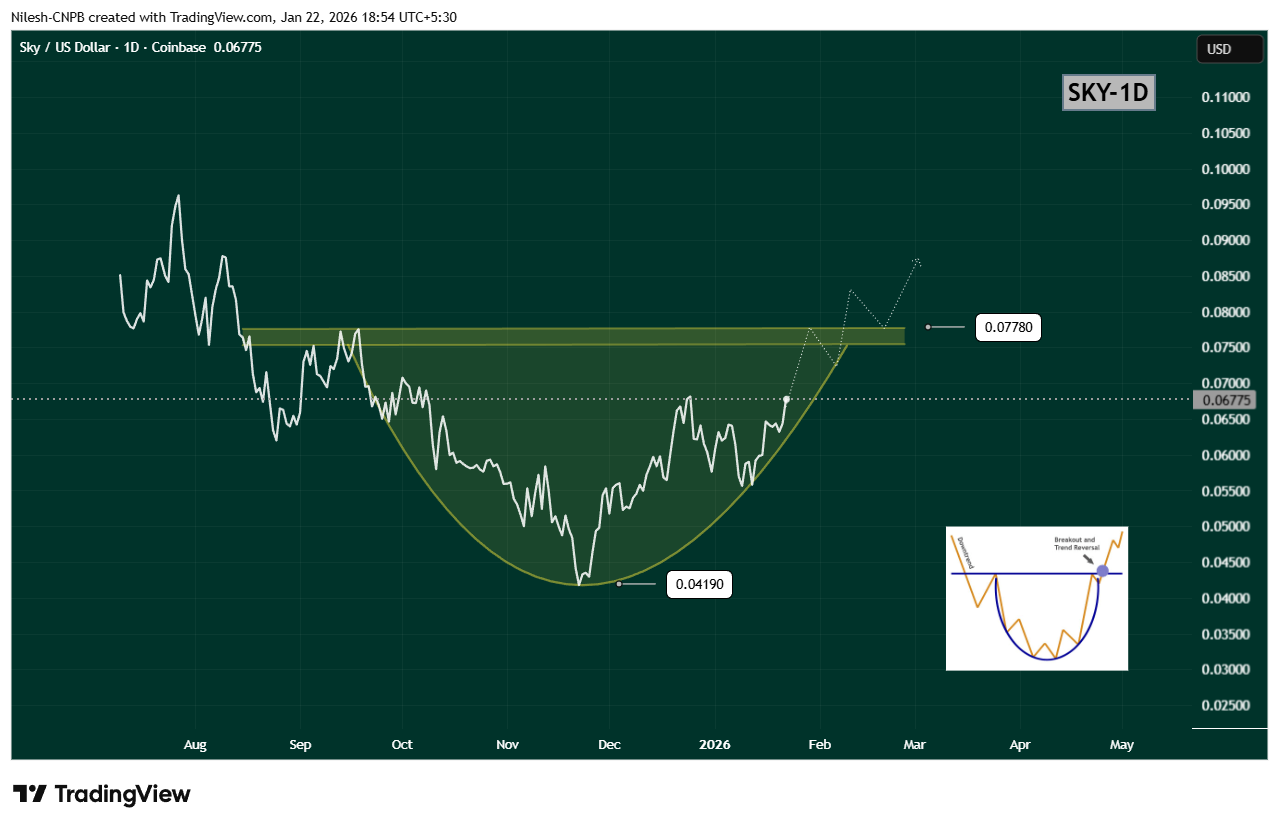
$SKY Daily Chart/Coinsprobe (Source: Tradingview)
Breakout Zone Comes Into Focus
Recent price action shows SKY reclaiming the $0.06933 region, a level that previously acted as resistance. This move strengthens the bullish structure and signals that buyers are gaining confidence ahead of a potential neckline test.
The key level to watch now is the $0.0778 resistance zone. A decisive daily close above this level would confirm the rounding bottom breakout and mark a clear shift in trend structure. Ideally, a breakout followed by a successful retest of this zone as support would further validate the bullish case.
Upside Projection and Risk Outlook
Based on the depth of the rounding bottom, the measured upside projection points toward the $0.11 region. Reaching this target would represent a potential 60–65% upside from current levels, aligning well with historical behavior of similar reversal patterns.
That said, patience remains important. Before any confirmed breakout, SKY could still experience short-term pullbacks or consolidation near the rising curve of the pattern. Such moves would not invalidate the bullish setup, as long as price continues to hold above recent higher lows.
A breakdown below the rounding base would weaken the structure, but for now, momentum favors the bulls.
Bottom Line
SKY is showing clear signs of a trend reversal in progress, with a rounding bottom pattern taking shape on the daily chart. Rising volume, improving structure, and a steady recovery toward neckline resistance all suggest that accumulation is underway.
If SKY can break and hold above $0.0778, the path opens toward the $0.11 region, signaling a broader bullish continuation. Until then, consolidation and minor pullbacks remain possible — but the overall structure is one that traders will be watching closely.
Disclaimer: The views and analysis presented in this article are for informational purposes only and reflect the author’s perspective, not financial advice. Technical patterns and indicators discussed are subject to market volatility and may or may not yield the anticipated results. Investors are advised to exercise caution, conduct independent research, and make decisions aligned with their individual risk tolerance.
About Author: Nilesh Hembade is the Founder and Lead Author of Coinsprobe, with over 5 years of experience in the cryptocurrency and blockchain industry. Since launching Coinsprobe in 2023, he has been providing daily, research-driven insights through in-depth market analysis, on-chain data, and technical research.
Disclaimer: The information on this page may come from third parties and does not represent the views or opinions of Gate. The content displayed on this page is for reference only and does not constitute any financial, investment, or legal advice. Gate does not guarantee the accuracy or completeness of the information and shall not be liable for any losses arising from the use of this information. Virtual asset investments carry high risks and are subject to significant price volatility. You may lose all of your invested principal. Please fully understand the relevant risks and make prudent decisions based on your own financial situation and risk tolerance. For details, please refer to
Disclaimer.
Related Articles
Bitcoin Breaks Through $74,000! 24-Hour Surge of 3.68%, ETFs Continue to Attract Capital, Multiple Factors Provide Support
Bitcoin broke through $74,000 on March 16th, with a gain of 3.68%, primarily driven by ETF capital inflows, halving supply effects, and geopolitical safe-haven demand. While market sentiment remains optimistic, short-term volatility is intensifying, and investors should carefully manage risk and monitor future support levels and selling pressure.
動區BlockTempo16m ago
Price Spreads Exceed 50%, Pre-Market Arbitrage on Crypto Stocks to Become New Business in Bear Market
Mysten Labs CEO Evan Sui believes that "bear markets" are not beneficial for the development of the cryptocurrency industry, as many projects face cash flow crises and may withdraw. However, data shows that over 80% of crypto startups are still in development, and bear markets can help focus the project teams' development efforts. The article explores the demand and potential entrepreneurial directions in the pre-market trading sector of tokens, pointing out that the crypto market lacks "bridge platforms" to integrate price differences between various trading markets, and recommends creating new platforms that meet market needs.
PANews28m ago
10x Research: Unusual Adjustments in Bitcoin On-Chain Capital Flows and Position Changes
10x Research posted a message on the X platform stating that Bitcoin prices are rising slowly, with abnormal capital flows appearing in the market. Recently, funding rates and risk indicators have undergone significant adjustments, market trends are being influenced by position structures, and changes in positions for Ethereum and Bitcoin require attention, with options trading before the end of March being particularly critical.
GateNews30m ago
BTC Short-term Rise 1.25%: Whale Buying and Key Level Breakthrough Drive Market Acceleration Upward
During 2026-03-16 03:30-03:45 (UTC), BTC recorded a +1.25% return with a price range of 72,851.9 to 74,300.0 USDT, reaching an amplitude of 1.99%. The K-line candle showed significant volume expansion during this period, with increased market attention and notable short-term volatility. Investors rapidly entered the market, with trading volume exceeding daily average levels, reflecting capital-driven momentum behind the price movement.
The primary drivers of this unusual movement were concentrated whale fund buying and a breakout through key technical levels. On-chain monitoring data showed 4 transactions each exceeding 1,000 BTC during the anomaly period.
GateNews45m ago