
Kaspa has been under heavy pressure, and price action over the past few days has pushed sentiment into extreme fear. That’s the backdrop for a bold statement from Travladd Crypto, who said that if KAS drops below $0.03, he plans to deploy $100,000 in one shot. His message was simple and emotional, but it carried a deeper point: if Kaspa fails at that level, then fundamentals may no longer matter in crypto at all.
The tweet landed at a moment when confidence across the market is thin. Kaspa has already sold off hard from the mid-$0.04 range, and price briefly dipped close to the level Travladd highlighted. This is no longer a calm pullback. It is a stress test.
Travladd’s comment is about conviction under pressure. He framed $0.03 as a line in the sand where fear peaks and patience disappears. His view is that Kaspa’s technology and network design should be enough to survive this phase. If price breaks down anyway, then the market may be proving that narratives and leverage matter more than substance.
That is why the tweet resonated. It reflects a wider frustration across crypto. Strong projects are getting dragged lower alongside everything else. For some traders, that creates hesitation. For others, it creates a moment to act.
- Kaspa Chart Breakdown: Where Price Stands Now
- Momentum Indicators: Early Signs of Relief
- Kaspa Price Outlook
Kaspa Chart Breakdown: Where Price Stands Now
The Kaspa price is trading just above $0.033, bouncing after a sharp selloff that briefly pushed price close to $0.03. This area now stands out as the most important support on the chart.
Support zones
- $0.030–$0.031: Major psychological and structural support. A clean break below this area would likely trigger another wave of stops.
- $0.026–$0.028: Next downside zone if $0.03 fails. This area lines up with the long wick from the recent flush.
Resistance zones
- $0.036–$0.037: First resistance where price was rejected during the breakdown.
- $0.040–$0.042: Strong supply zone. A reclaim would signal that sellers are losing control.
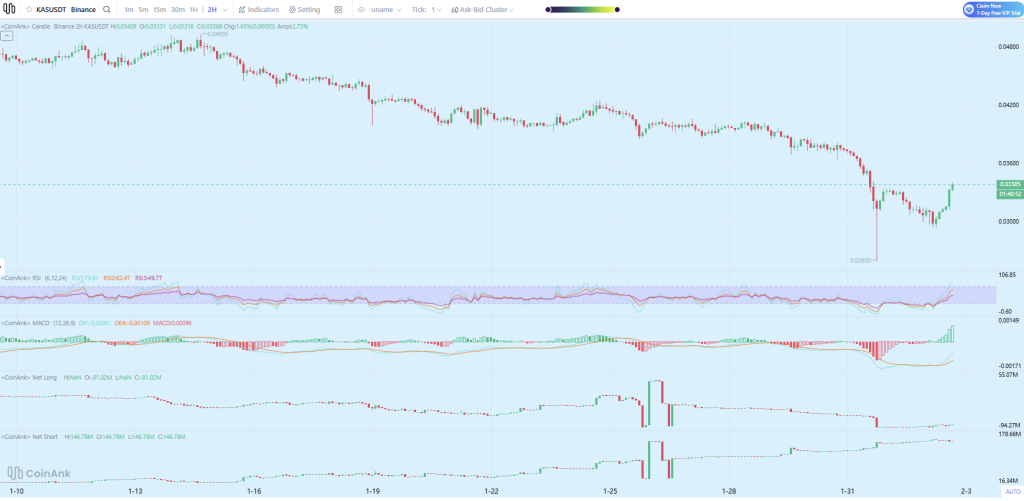
Source: CoinAnk
Right now, price is in recovery mode, but still well below prior structure.
Momentum Indicators: Early Signs of Relief
The RSI dipped into oversold territory during the selloff and has started to turn up. That points to short-term exhaustion from sellers, not a confirmed trend change. RSI still has room to move before hitting overheated levels.
The MACD shows a bullish curl forming after deep negative momentum. Histogram bars are shrinking, which hints that downside pressure is slowing. This often shows up during relief bounces, though confirmation needs follow-through.
Net positioning data shows short exposure dominating. Shorts increased aggressively during the breakdown, which helped push price lower. Over the last sessions, that pressure has stopped accelerating. This matters.
If price holds above $0.03 and pushes into resistance, short covering could fuel a sharp bounce. If support fails, those same shorts stay comfortable and downside opens fast.
Read also: Kaspa (KAS) vs BNB: This Comparison Makes BNB Look Uncomfortable
Kaspa Price Outlook
Kaspa is sitting at a crossroads.
If $0.03 holds, a rebound toward $0.036–$0.040 becomes likely. That move would fit a classic relief rally after forced selling.
If $0.03 breaks, downside could extend toward $0.028 and possibly $0.026 before buyers step in again. That scenario would fully test the conviction Travladd talked about.
For now, the market has paused just above the level that matters most. The next few sessions will decide whether this bounce grows into something larger or fades into another leg down.
Kaspa is no longer trading in a comfortable zone. It is trading where beliefs get tested.
Disclaimer: The information on this page may come from third parties and does not represent the views or opinions of Gate. The content displayed on this page is for reference only and does not constitute any financial, investment, or legal advice. Gate does not guarantee the accuracy or completeness of the information and shall not be liable for any losses arising from the use of this information. Virtual asset investments carry high risks and are subject to significant price volatility. You may lose all of your invested principal. Please fully understand the relevant risks and make prudent decisions based on your own financial situation and risk tolerance. For details, please refer to
Disclaimer.
Related Articles
Ethena Drops 15% from Weekly High — Are Deeper Losses Coming?
Price Drop: ENA falls 15% from $0.12 weekly high as sellers regain control.
Market Trend: Long-term bearish signals dominate despite short-term bullish momentum and volume spikes.
Next Support: Traders watch $0.085 as the key level for potential further losses or bounce.
Ethena —ENA,
CryptoNewsLand36m ago
Wintermute: From a 12-18 month perspective, BTC's current price is quite attractive
Wintermute analyzes market conditions, believing that macro factors dominate, and cryptocurrencies are showing resilience with weakened correlation to stocks. Currently, the leverage in the cryptocurrency market is relatively low, resulting in less selling pressure. Although there is still room for further decline, deleveraging seems to have passed, and whether the future performance can be sustained remains to be seen. The FOMC meeting is a recent catalyst.
GateNews46m ago
PI Token Maintains Bullish Trend as Anticipation for Pi Day Grows
PI token trades above $0.21 after rallying over 25% in the past 7 days as anticipation for the upcoming Pi Day on March 14 grows.
PiScan recorded 3 million PI deposits to exchanges in 24 hours, suggesting near-term profit taking which could reverse the bullish trend.
Pi Network’s PI token tr
CryptoNewsFlash51m ago
Glassnode Data: Most XRP Supply in Loss, What It Means for Investors
Glassnode data shows 36.8 billion XRP, nearly 60% of the circulating supply, is held at a loss, with unrealized losses reaching $50.8 billion.
XRP traded near $1.34, while futures volume jumped on BitMEX and Binance as ETF outflows and weak spot activity kept pressure on price.
Glassnode dat
CryptoNewsFlash1h ago
Is the 'Bitcoin Pyramid' Cracking? Peter Schiff Predicts Forced BTC Liquidations by MicroStrategy - U.Today
Peter Schiff criticizes Michael Saylor's Bitcoin strategy, labeling it a "Bitcoin pyramid." He argues that Saylor’s preferred stock, STRC, may force the first Bitcoin sale due to its dependence on cash from new investments or reserves to pay dividends, risking liquidation.
UToday1h ago
Pi Network Approaches Key Price Level — Breakout or Bull Trap Ahead?
Price Action: PI trades near $0.20 supply zone after short-term 5% rally.
Technical Signals: H4 chart bullish, but higher timeframe trends remain bearish.
Trading Strategy: Watch $0.1857 support and $0.216 resistance for breakout or bull trap confirmation.
Pi Network has shown
CryptoNewsLand1h ago