
The Litecoin (LTC) price is not breaking out right now. It is breaking down. A chart shared by Matthew Dixon is putting attention on one bearish setup: a possible bear flag.
This pattern shows up when a coin drops hard, then drifts sideways before sellers step back in. Litecoin now sits near the base of that structure, and the next move could decide if more downside follows.
A bear flag is a continuation setup. Price falls hard, then moves sideways or slightly upward in a tight channel. That pause can look calm, but it often acts like the market resetting before more selling.
Matthew Dixon pointed out that Litecoin may be doing exactly that. The chart shows a long consolidation that could be the “flag,” built after a major decline. The concern comes when the base breaks.
Here’s What The LTC Chart is Showing
On the chart, Litecoin appears to have slipped below a key support trendline. That support acted as the floor of the pattern for months.
When the LTC price breaks the lower boundary of a flag, it often signals that buyers are stepping back. Sellers regain control, and downside targets open quickly.
This is why the current level matters. Litecoin is sitting near a decision point, not a comfort zone. The RSI indicator on the chart is also leaning bearish. RSI measures buying strength versus selling strength.
Right now, the indicator sits near the lower range. Buying strength has faded. It is not deeply stretched, but buyers are no longer pushing price higher. Demand looks thin at this level.
_****Aave Makes More Money Than 5 DeFi Giants Combined… So Why Is AAVE Price Asleep?**
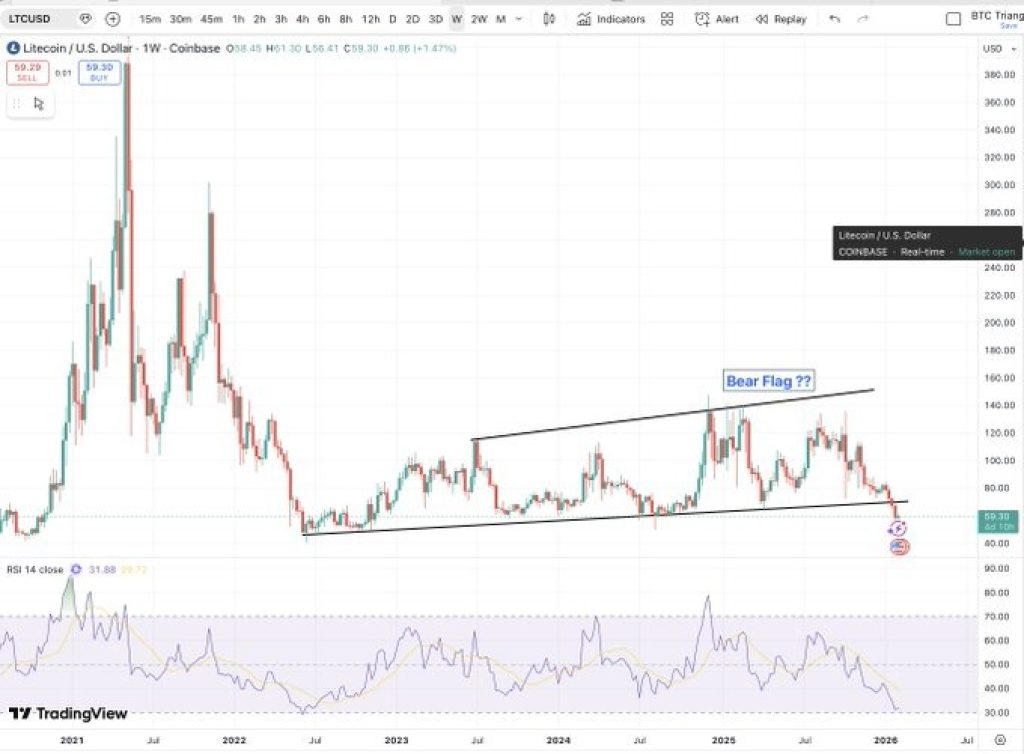
Source: X/MattewDixon
What Traders Watch Next For LTC
The key question is whether Litecoin can reclaim the broken trendline. If price moves back above support, the bear flag idea weakens.
If it stays below and continues to grind lower, the pattern remains active. That would keep pressure on the chart and increase the odds of another drop.
Litecoin does not need a crash tomorrow for this setup to matter. These patterns often play out slowly, then move fast once support fully gives way.
However, the Litecoin price structure looks fragile right now. The chart shared by Matthew Dixon highlights a possible bear flag, with support starting to fail.
Until price shows strength again, traders will treat this as a bearish setup, with the risk of further downside still on the table.
Disclaimer: The information on this page may come from third parties and does not represent the views or opinions of Gate. The content displayed on this page is for reference only and does not constitute any financial, investment, or legal advice. Gate does not guarantee the accuracy or completeness of the information and shall not be liable for any losses arising from the use of this information. Virtual asset investments carry high risks and are subject to significant price volatility. You may lose all of your invested principal. Please fully understand the relevant risks and make prudent decisions based on your own financial situation and risk tolerance. For details, please refer to
Disclaimer.
Related Articles
Chinese DeepSeek AI Predicts the Price of XRP and Solana If the Clarity Act Doesn’t Pass in 2026
The CLARITY Act may fail to become law this year if it doesn’t pass committee by the end of April, according to Galaxy Digital research. The main battle is over stablecoin rewards, which banks say could drain deposits
CaptainAltcoin3m ago
BTC 15-minute decline of 0.70%: Whale selling drives short-term pullback
2026-03-15 23:15 to 2026-03-15 23:30 (UTC), BTC price declined 0.70% in just 15 minutes, with a price range of 72464.7 to 73115.9 USDT and an intraday volatility of 0.89%. The anomaly occurred during the night when liquidity was lower, with concentrated short-term selling pressure triggering market attention, and price fluctuations notably intensified compared to daytime levels.
The primary driver of this anomaly was on-chain monitoring detecting multiple large BTC transfers flowing into exchanges, indicating that whales or institutions were conducting active selling operations, with selling pressure in liquidity
GateNews1h ago
Ethereum Eyes Bullish Breakout – Analysts Predict Potential Rally to $2,500 As Scarcity Increases
The cryptocurrency market is currently at a crucial technical juncture for ETH. The second largest digital asset is poised for a structural change, with Ethereum testing a critical resistance zone near $2,150 in mid-March 2026. A breakthrough above that level is the main signal technical analysts ne
BlockChainReporter1h ago
BTC 15-minute gain of 0.63%: ETF positive news combined with institutional fund inflows triggers breakthrough
From 2026-03-15 22:30 to 2026-03-15 22:45 (UTC), BTC rose 0.63% within 15 minutes, with a price range of 71926.4 to 72500.0 USDT and a volatility amplitude of 0.80%. During the same period, trading volume increased notably with buy-side dominance, market attention heated up, and fluctuation intensity exceeded the intraday average, reflecting rising sentiment and active short-term trading activity.
The main driver of this price movement is a macro positive catalyst: The US SEC released a positive statement regarding bitcoin ETF approval progress at 22:00, which directly bolstered
GateNews1h ago
Analyst Says Bitcoin Indicators Show Early Signs of Market Recovery
Stablecoin liquidity rose by ~$8B since February, signaling potential improved market trading conditions.
Inter-exchange Flow Pulse turned positive, indicating more Bitcoin moving to derivatives platforms.
Long-term holders retain ~79% of supply, showing gradual supply transfers rather
CryptoFrontNews3h ago
Dogecoin at a Turning Point — Will $0.094 Resistance Finally Break?
Dogecoin was trading between $0.0925 and $0.09173 with the price stabilizing around $0.0925.
The immediate $0.09443 resistance caps the current range. A move above this level could expand today’s trading activity.
Past historical price movements coincide with a number of trend support res
CryptoNewsLand4h ago