
Key Takeaways
-
SUI has dropped nearly 67% from its recent peak, placing it in a potential bottoming zone.
-
Current price action closely mirrors Solana’s 2025 bottoming fractal, which preceded a strong reversal.
-
A reclaim of the 50-day moving average could confirm a trend shift and open the door for a broader recovery.
SUI, the native token of Sui’s Layer-1 blockchain, has struggled to live up to its early hype in recent months, especially when compared to** Solana’s (SOL)** 2021 explosive performance. A broader market correction has only added pressure, dragging SUI nearly 50% lower over the past 90 days.
But zooming out and looking beneath the surface, the current price structure tells a more interesting story. On the charts, SUI is starting to resemble a bottoming fractal previously seen in Solana—a setup that eventually led to a sharp and sustained upside move.
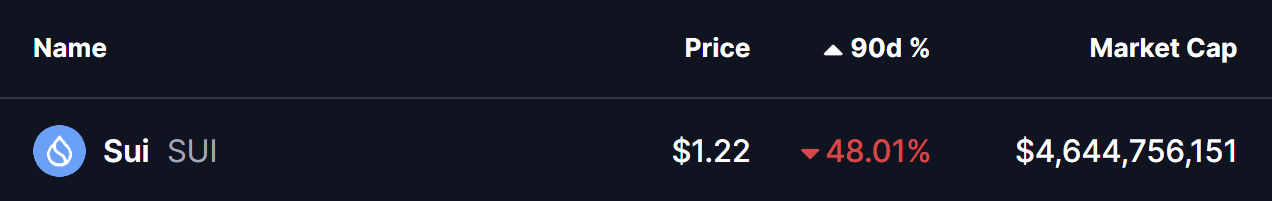
Source: Coinmarketcap
SUI Mirrors SOL’s Bottoming Path
A side-by-side comparison of SUI and SOL reveals striking similarities.
Back in early 2025, **Solana **topped near $295 before entering a sharp corrective phase. Price slipped below the 50-day moving average, signaling weakening momentum. The sell-off eventually stretched into a deep 67% drawdown, flushing out late longs and marking a clear sentiment reset.
That low proved pivotal.
Once SOL reclaimed its 50-day moving average, the trend structure flipped. What followed was a 163% rally, one of the most notable reversals of 2025.
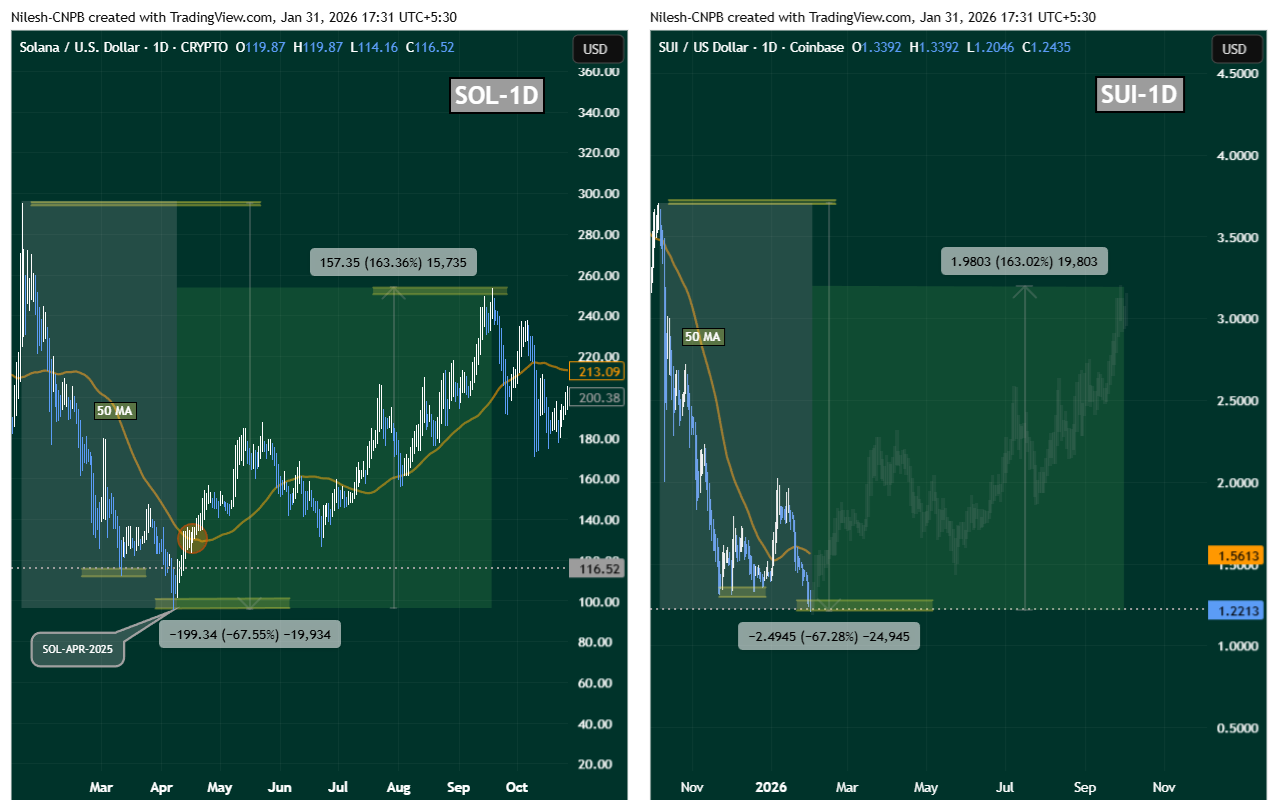
SOL and SUI Fractal Chart/Coinsprobe (Source: Tradingview)
SUI now appears to be following a similar script.
After peaking around $3.70 in October 2025, SUI entered a steep correction, losing its 50-day moving average and sliding into a nearly identical 67% drawdown. Momentum faded, volatility compressed, and price action began to flatten—classic characteristics of a market searching for a base.
What’s Next for SUI?
From a technical perspective, SUI is now sitting near a critical inflection zone around $1.20–$1.22, an area that could act as a potential bottom if buyers continue to defend it.
The first major confirmation bulls will want to see is a reclaim of the 50-day moving average, currently hovering near $1.56. A sustained move above this level would signal that bearish momentum is fading and that buyers are regaining control.
If that reclaim occurs, SUI could transition into a broader recovery phase. In a scenario where the SOL fractal continues to play out, upside expansion toward the $3.00–$3.20 region would come back into focus over the medium term.
Key Risk Note
While fractal comparisons can offer valuable context, they are not guarantees. Each asset trades within its own liquidity environment, sentiment cycle, and macro backdrop. For SUI, confirmation still matters—especially through moving average reclaims and consistent follow-through buying.
Until then, the structure suggests risk is compressing, not expanding.
Disclaimer: The views and analysis presented in this article are for informational purposes only and reflect the author’s perspective, not financial advice. Technical patterns and indicators discussed are subject to market volatility and may or may not yield the anticipated results. Investors are advised to exercise caution, conduct independent research, and make decisions aligned with their individual risk tolerance.
About Author: Nilesh Hembade is the Founder and Lead Author of Coinsprobe, with over 5 years of experience in the cryptocurrency and blockchain industry. Since launching Coinsprobe in 2023, he has been providing daily, research-driven insights through in-depth market analysis, on-chain data, and technical research.
Disclaimer: The information on this page may come from third parties and does not represent the views or opinions of Gate. The content displayed on this page is for reference only and does not constitute any financial, investment, or legal advice. Gate does not guarantee the accuracy or completeness of the information and shall not be liable for any losses arising from the use of this information. Virtual asset investments carry high risks and are subject to significant price volatility. You may lose all of your invested principal. Please fully understand the relevant risks and make prudent decisions based on your own financial situation and risk tolerance. For details, please refer to
Disclaimer.
Related Articles
Bitcoin Breaks Through $73,000, Ethereum Surges to $2,200! Tom Lee: Stock Market May Have Hit Bottom This Month, Rising Oil Prices Could Be Bullish
Bitcoin briefly broke through $73,200 this morning, while Ethereum similarly surpassed $2,200. The fear index rose to 23, indicating extreme panic. Tom Lee stated on CNBC that the U.S. stock market may have already formed a bottom, tech stocks are performing well, rising oil prices could be favorable for U.S. stocks, and he believes the current situation will not become a systemic issue.
動區BlockTempo20m ago
TAO (Bittensor) Up 7.25% in 24 Hours
Gate News Update: On March 16, according to Gate's market data, as of the time of publication, TAO (Bittensor) is trading at 276.85 USD, up 7.25% in the past 24 hours, with a high of 291.45 USD and a low of 193.37 USD. The 24-hour trading volume reached 668 million USD. The current market cap is approximately 2.982 billion USD, an increase of 201 million USD compared to yesterday.
## Recent Important Updates on TAO:
1️⃣ **Positive Technical Signals Emerging in the Market**
Technical analysis indicates that TAO's price is forming an Adam-Eve pattern, which typically signals the formation of an uptrend. Analysts have observed that this technical pattern could help push TAO's price above 270 USD, which aligns with current price performance. The
GateNews20m ago
XRP Price Shows Significant Recovery, Is $3 Back On The Menu?
The price of XRP shows a pent-up bullish momentum in the RSI chart.
The token has also entered a decisive phase at the 200 EMA, which could push it above $3.
Ongoing upgrades, particularly ZKP integration, could drive greater institutional adoption of XRPL.
XRP staged a huge rally from $1.40 to
Blockzeit31m ago
USDC Rises Against the Trend: Trading Volume Surpasses USDT for the First Time, Leading Holdings in Five Countries
Mizuho Financial Group research shows that USDC's adjusted trading volume will reach $2.2 trillion in 2026, surpassing USDT's $1.3 trillion for the first time, demonstrating its growth in the stablecoin market. USDC performs better in regulated markets, while USDT maintains dominance in emerging markets, reflecting geographic differentiation in the stablecoin market. This phenomenon is closely related to the different regulatory strategies adopted by both.
MarketWhisper34m ago
Why Did Bitcoin Rise Today? Weekly Close Reclaims 70K, Crypto Czar Sends Anti-War Signal
Bitcoin closed last week above $70,000, marking its highest level since March. White House advisor Sacks' anti-war statement drove a market rebound, demonstrating the importance of cryptocurrency in the geopolitical environment. Technical analysis shows Bitcoin holding steady at key support levels, with potential for further gains toward $75,000 to $80,000. Markets remain vigilant about geopolitical risks, which could impact near-term movements.
MarketWhisper46m ago
Today the cryptocurrency fear and greed index rose to 23, with the market in a state of extreme panic.
Gate News, on March 16, according to Alternative.me data, the cryptocurrency fear and greed index rose to 23 today, compared to 15 yesterday, with the market in an "extreme panic state".
GateNews49m ago