
Bitcoin accelerates to $60,000, with nearly $2.7 billion in liquidations across the network, and the “Trump rally” gains fully retraced. Analysts point out that the 200-day moving average is a key support level, but due to thin liquidity, no clear bottoming signal has yet appeared.
Bitcoin drops to $60,000, with $2.7 billion in liquidations worldwide
Due to continued pressure in the risk asset markets, Bitcoin ($BTC) has accelerated its decline from last night to today, dipping as low as $60,142, then oscillating around $64,000.
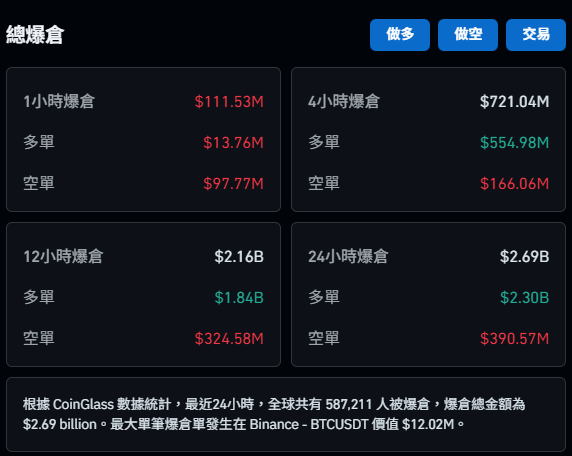
This wave of decline triggered a massive leverage wipeout, with total liquidations in the global cryptocurrency market approaching $2.7 billion, including $2.3 billion in long (buy) orders.
This is the worst single-day decline since the FTX exchange collapse in November 2022, with a drop of over 10% in the past 24 hours.
Bitcoin outflows of 6.6% during the same period show relative resilience
Meanwhile, Bitcoin spot ETF investors have shown unexpected resilience. Bloomberg ETF analyst Eric Balchunas said that although Bitcoin has fallen more than 40% from recent highs, the funds flowing out of Bitcoin ETFs during the same period only account for 6.6%.
He analyzed that ETF investors generally view Bitcoin as a small part of their asset allocation (about 1% to 2%), and their overall portfolios benefit from strong stock market performance, allowing them to better withstand cryptocurrency volatility without panic selling.
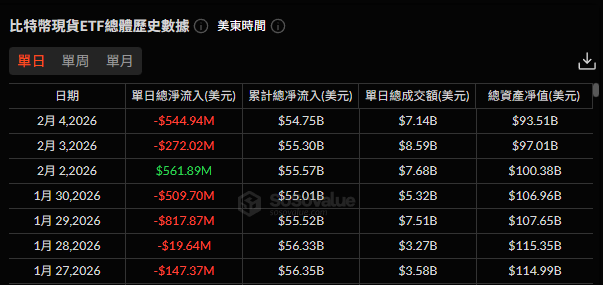
SoSoValue data shows that in the past seven days, U.S. Bitcoin spot ETFs have generally experienced outflows, with only February 2 seeing inflows of $560 million.
Bitcoin halves from its all-time high, “Trump rally” fully retraced
From the peak of $126,198 in early October 2025 to the near $60,000 low, Bitcoin has been halved from its high, with a total decline of over 50%, which also indicates that the gains since Trump’s election have been fully retraced.
Looking back at the presidential election on November 5, 2024, Bitcoin was around $67,800, and today’s price has fallen below that.
Although the Trump administration showed support for the cryptocurrency industry, including establishing a strategic reserve plan and easing regulations from the previous government, these policy positives clearly failed to sustain the coin’s high-level performance.
Crypto market maker Wintermute CEO Evgeny Gaevoy commented on February 4 that, he believes Bitcoin has lost its original cryptopunk spirit, and the recent decline finally frees us from the foolish frenzy of “Trump made us rich,” once again clearing out tourists and leaving only those who truly believe in the mission.

No clear bottoming signals yet, focus on the 200-day moving average
Regarding future developments, Adrian Fritz, Chief Investment Strategist at 21Shares, warned that current market liquidity is quite thin, and even small selling pressures can trigger violent volatility and chain liquidations. No clear bottoming signals have been observed yet.
He pointed out that from a technical perspective, the 200-day moving average will be a key focus, currently between $58,000 and $60,000. This area also overlaps with the average cost basis of Bitcoin holders and could serve as a strong support level.
André Dragosch, Research Director at Bitwise, noted that there are significant trading records between $58,000 and $69,000, further reinforcing this price range as an important demand zone.
However, Stifel analyst pessimistically predicts that, based on historical bear market declines, Bitcoin could even drop to $38,000 in extreme cases.
Currently, Bitcoin’s weekly RSI has fallen below 30, entering oversold territory. While historically this often signals a rebound, the market sentiment is deteriorating at an extremely fast pace, and investors should remain cautious of risks.
Disclaimer: The information on this page may come from third parties and does not represent the views or opinions of Gate. The content displayed on this page is for reference only and does not constitute any financial, investment, or legal advice. Gate does not guarantee the accuracy or completeness of the information and shall not be liable for any losses arising from the use of this information. Virtual asset investments carry high risks and are subject to significant price volatility. You may lose all of your invested principal. Please fully understand the relevant risks and make prudent decisions based on your own financial situation and risk tolerance. For details, please refer to
Disclaimer.
Related Articles
XRP Price Structure Tightens While Heatmap Highlights $1.30 Liquidity Zone
XRP trades near $1.37 support after a 0.9% daily decline, while the $1.44 level remains the immediate resistance in the current range.
A three-week liquidity heatmap highlights a large order cluster around $1.30, indicating a strong liquidity zone below price.
A three-month Gaussian
CryptoNewsLand8m ago
Internet Computer Price Nears Wedge Breakout — Will Momentum Hold Above $2.54?
Internet Computers continues trading within a falling wedge that has developed since November. Price now approaches the pattern’s upper boundary as volatility tightens.
ICP is trading around the $2.57 mark which is a bit higher than the $2.54 support. In the meantime, the immediate
CryptoNewsLand13m ago
Billionaire Investor Stanley Druckenmiller Bullish on Stablecoin Growth
Billionaire investor Stanley Druckenmiller believes stablecoins will become the backbone of the financial system in 10-15 years, citing their efficiency. However, he views much of the wider crypto market as unnecessary, describing it as “a solution looking for a problem.”
Decrypt33m ago
HOT Climbs to $0.0004141, Its Falling Wedge Breakout Sets to Push Price 300% Higher: Analyst
The Holo (HOT) coin is showing bullish signals, with analysts predicting a significant price increase due to a breakout from a falling wedge pattern. Recent trends indicate rising interest and market activity, positioning HOT for potential gains soon.
BlockChainReporter45m ago
Bitcoin Cash Battles $459 Resistance as Massive Sell Walls Stack Toward $650
BCH is trading at $455.86 close to the resistance range of $459.20 with the support level of $447.44.
The chart data indicates that the chart has strong resistance levels at around $520, $580 and $650 which restricts the momentum on short term upside.
Following a sharp fall, price
CryptoNewsLand1h ago
HYPE Hits $35.53 After 2.4% Jump — Will Momentum Hold as Price Tests $35.59 Resistance?
Hyperliquid’s HYPE trades at $35.53, approaching the $35.59 resistance after a 2.4% daily gain.
The chart shows the $33.67 zone acting as support after price moved above a previously contested level.
Price now trades between $33.67 support and $35.59 resistance, shaping the immediate
CryptoNewsLand2h ago