
Humanity Protocol is having a really strong day. The H price is up about 13.6% in the last 24 hours, trading near $0.229 and clearly outperforming Bitcoin, which is slightly in the red.
When you see something like this, it usually comes down to one simple theme: traders are rotating out of large caps and into smaller altcoins that can move much faster when sentiment improves. And right now, Humanity Protocol is one of the projects catching that wave.
- What’s Actually Pushing the H Price Higher
- What the H Chart Looks Like Right Now
- Where the H Price Could Go Next
What’s Actually Pushing the H Price Higher
The biggest driver behind today’s pump is the broader shift into altcoins. The CMC Altcoin Season Index has jumped more than 54% this week, which is basically the market flashing a sign that risk appetite is coming back.
Interestingly, there isn’t one major headline or announcement behind Humanity Protocol’s move today. This looks more like a momentum breakout tied to the market environment, not a news spike. Trading activity has also picked up, which helps confirm that this isn’t just a random candle. Buyers are showing up.
Here’s Where Hedera (HBAR) Price Could Go This Week_**
What the H Chart Looks Like Right Now
On the 4-hour chart, the H price has been climbing steadily since the early February low near $0.10. It’s been a clean recovery with higher highs and higher lows, which is exactly what you want to see in a strong uptrend.
The latest push has brought H into the $0.23–$0.24 zone, which is now the big resistance area. Price has already tested it once and is hovering just under it again. Support is also pretty clear around $0.20. That level has become the breakout base, and it’s the zone buyers really need to hold if this move is going to stay alive.
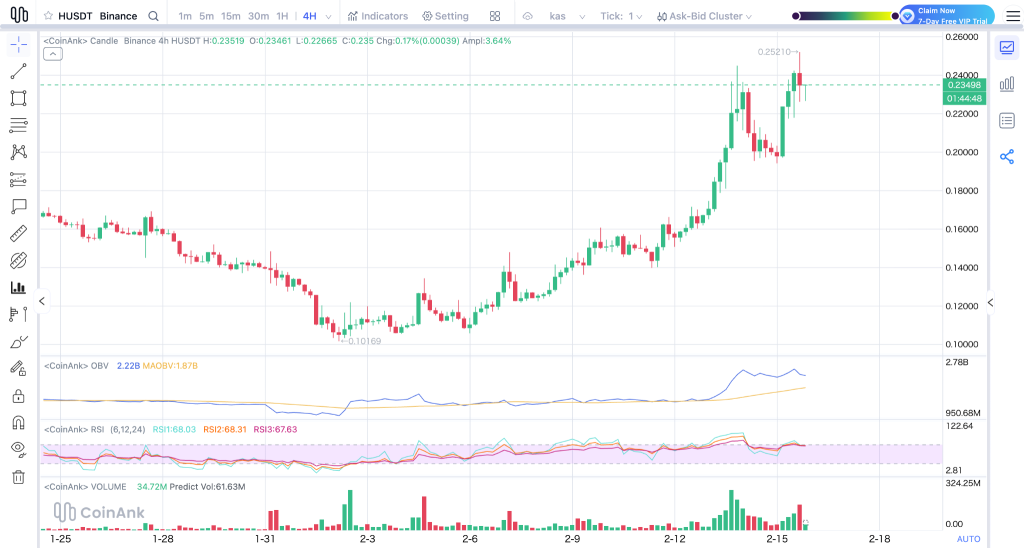
Source: CoinAnk
If the H price stays above $0.20, the trend still looks healthy. If it breaks below, a pullback toward $0.18 becomes more likely.
RSI is sitting in the high 60s, which shows strong momentum, but it also tells us the H price is starting to get a bit stretched in the short term. It’s not fully overbought yet, but it’s getting close to the area where cooling off often happens. MACD is still bullish and trending upward, which confirms that buyers remain in control for now.
As for net shorts vs net longs, resistance near $0.24 is usually where shorts start to step in, betting on a rejection. But the fact that price is holding up suggests longs are still pressing forward.
Jupiter Is Printing Revenue – So Why Is JUP Facing a Token Shock?_**
Where the H Price Could Go Next
If the altcoin rotation continues and the H price can break cleanly above $0.24, the next move could push toward $0.26 fairly quickly. On the flip side, if momentum fades, $0.20 is the key level to watch. Losing that support could send H back down toward $0.18 before buyers try again.
For now, Humanity Protocol is riding the altcoin wave strongly, and as long as traders stay in risk-on mode, the H price remains one of the more active charts today.
Disclaimer: The information on this page may come from third parties and does not represent the views or opinions of Gate. The content displayed on this page is for reference only and does not constitute any financial, investment, or legal advice. Gate does not guarantee the accuracy or completeness of the information and shall not be liable for any losses arising from the use of this information. Virtual asset investments carry high risks and are subject to significant price volatility. You may lose all of your invested principal. Please fully understand the relevant risks and make prudent decisions based on your own financial situation and risk tolerance. For details, please refer to
Disclaimer.
Related Articles
BTC 15-minute decline of 0.70%: Whale selling drives short-term pullback
2026-03-15 23:15 to 2026-03-15 23:30 (UTC), BTC price declined 0.70% in just 15 minutes, with a price range of 72464.7 to 73115.9 USDT and an intraday volatility of 0.89%. The anomaly occurred during the night when liquidity was lower, with concentrated short-term selling pressure triggering market attention, and price fluctuations notably intensified compared to daytime levels.
The primary driver of this anomaly was on-chain monitoring detecting multiple large BTC transfers flowing into exchanges, indicating that whales or institutions were conducting active selling operations, with selling pressure in liquidity
GateNews39m ago
Ethereum Eyes Bullish Breakout – Analysts Predict Potential Rally to $2,500 As Scarcity Increases
The cryptocurrency market is currently at a crucial technical juncture for ETH. The second largest digital asset is poised for a structural change, with Ethereum testing a critical resistance zone near $2,150 in mid-March 2026. A breakthrough above that level is the main signal technical analysts ne
BlockChainReporter1h ago
BTC 15-minute gain of 0.63%: ETF positive news combined with institutional fund inflows triggers breakthrough
From 2026-03-15 22:30 to 2026-03-15 22:45 (UTC), BTC rose 0.63% within 15 minutes, with a price range of 71926.4 to 72500.0 USDT and a volatility amplitude of 0.80%. During the same period, trading volume increased notably with buy-side dominance, market attention heated up, and fluctuation intensity exceeded the intraday average, reflecting rising sentiment and active short-term trading activity.
The main driver of this price movement is a macro positive catalyst: The US SEC released a positive statement regarding bitcoin ETF approval progress at 22:00, which directly bolstered
GateNews1h ago
Analyst Says Bitcoin Indicators Show Early Signs of Market Recovery
Stablecoin liquidity rose by ~$8B since February, signaling potential improved market trading conditions.
Inter-exchange Flow Pulse turned positive, indicating more Bitcoin moving to derivatives platforms.
Long-term holders retain ~79% of supply, showing gradual supply transfers rather
CryptoFrontNews3h ago
Dogecoin at a Turning Point — Will $0.094 Resistance Finally Break?
Dogecoin was trading between $0.0925 and $0.09173 with the price stabilizing around $0.0925.
The immediate $0.09443 resistance caps the current range. A move above this level could expand today’s trading activity.
Past historical price movements coincide with a number of trend support res
CryptoNewsLand4h ago
XRP Breaks $1.40 Resistance as Volume Surge Lifts Momentum
Key Insights
XRP surged past the $1.40 resistance after trading volume climbed nearly 13%, signaling renewed trader interest and stronger short-term momentum.
Ripple’s collaboration with Mastercard through the Crypto Partner program increased market attention as investors anticipate
CryptoNewsLand4h ago