The price of Toncoin (TON) remains in a dark mood as it continues to fall below the $1.29 mark at the time of writing on Thursday. Since the beginning of the week, this coin has lost more than 4% of its value, clearly reflecting increasing selling pressure. The weakening of on-chain indicators, combined with data from the derivatives market, shows that investor participation is shrinking, further reinforcing a less optimistic scenario. From a technical perspective, TON remains “trapped” in a long-term downtrend, making the risk of deeper declines a top concern for the market.
Investor Participation in Toncoin Is Weakening
Data from DefiLlama shows that weekly trading volume on Toncoin’s decentralized exchanges (DEX) has dropped to just $12.6 million USD so far this week — the lowest since early January 2024. This clear decline indicates that trader interest and liquidity for Toncoin are cooling off, adding to negative signals for the short-term price outlook.
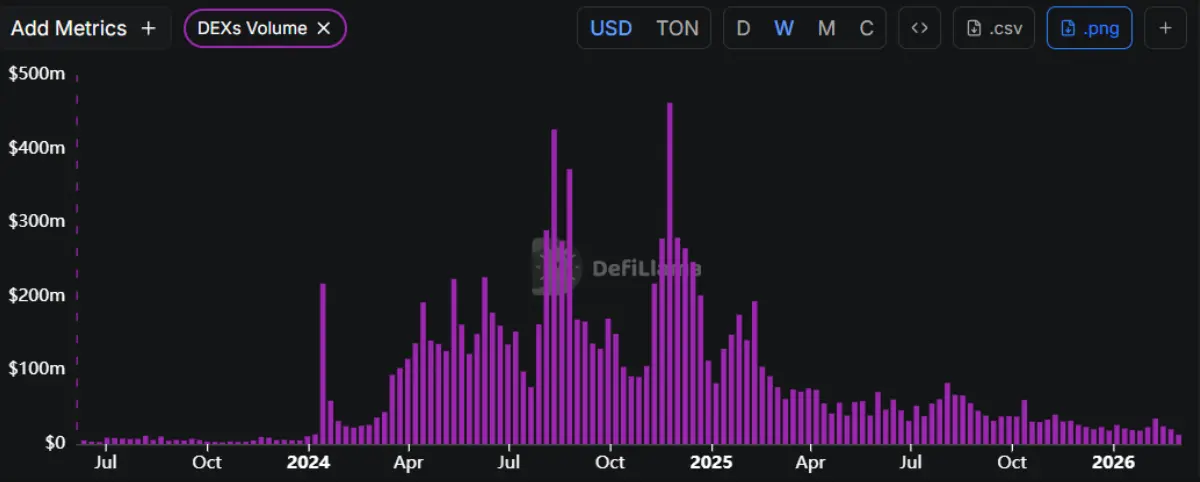 Weekly DEX trading volume chart of TON | Source: DefiLlama
In the derivatives market, the picture is also not very bright, as the TON funding rate continues to stay in negative territory, reflecting prevailing bearish sentiment. This indicator turned negative on Tuesday and decreased to -0.011% on Thursday, approaching levels seen on February 19 — when TON experienced a sharp plunge. A negative funding rate indicates that short sellers are paying fees to long positions, confirming that the market is leaning toward a bearish outlook for Toncoin.
Weekly DEX trading volume chart of TON | Source: DefiLlama
In the derivatives market, the picture is also not very bright, as the TON funding rate continues to stay in negative territory, reflecting prevailing bearish sentiment. This indicator turned negative on Tuesday and decreased to -0.011% on Thursday, approaching levels seen on February 19 — when TON experienced a sharp plunge. A negative funding rate indicates that short sellers are paying fees to long positions, confirming that the market is leaning toward a bearish outlook for Toncoin.
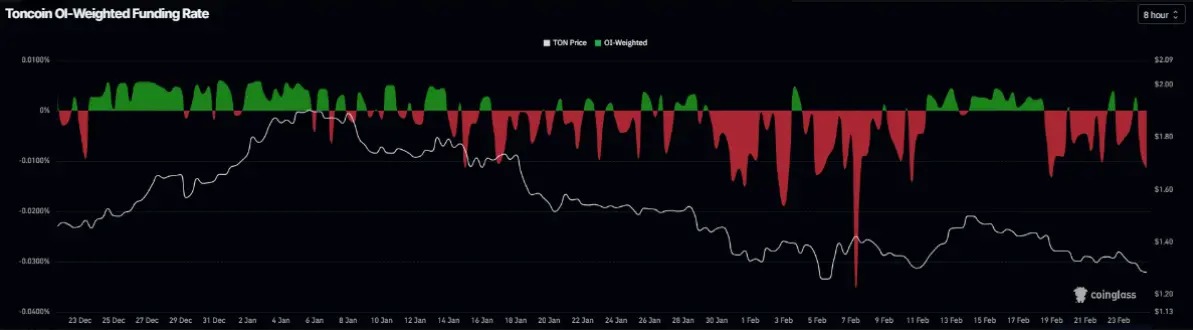 Toncoin funding rate chart | Source: Coinglass
Toncoin Price Forecast: Extended Correction as Bears Target the $1.12 Level
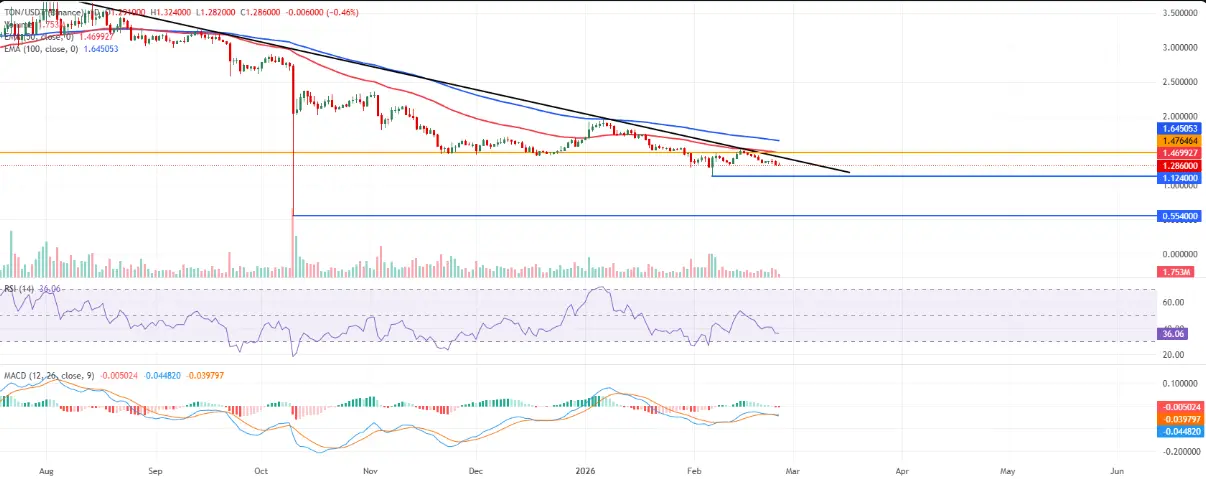
As of Thursday, Toncoin is trading around $1.28. The short-term technical picture continues to lean slightly negative, with the price still held below the 50-day and 100-day EMAs. This suggests the dominant downtrend remains in place, especially after TON failed to break above the important resistance trendline near $1.40.
On the daily timeframe, the RSI hovers around 36 and stays below the neutral 50 level, indicating selling pressure still dominates and there are no signs of weakening downward momentum. Additionally, the MACD indicator has returned to the negative zone, with the MACD line below the signal line and a slight negative histogram — a sign that bullish momentum is clearly weakening after an unsuccessful recovery attempt below the resistance area.
 Daily TON/USDT chart | Source: TradingView
From a technical standpoint, the nearest resistance zone is around $1.40, where the previous downward trendline was broken and where recent price failures occurred. Further resistance is at $1.47, serving as a stronger barrier that blocks the recovery toward the 50-day EMA cluster.
Daily TON/USDT chart | Source: TradingView
From a technical standpoint, the nearest resistance zone is around $1.40, where the previous downward trendline was broken and where recent price failures occurred. Further resistance is at $1.47, serving as a stronger barrier that blocks the recovery toward the 50-day EMA cluster.
On the downside, immediate support is at the short-term low around $1.26. A decisive break below this level could trigger a deeper decline, pushing the price back toward $1.12 — where bears are likely to continue testing the strength of the broader bottom area.
Overall, as long as Toncoin remains below $1.40, any rebound attempts face increasing selling pressure, and the short-term downtrend is likely to remain the dominant scenario.
SN_Nour
Disclaimer: The information on this page may come from third parties and does not represent the views or opinions of Gate. The content displayed on this page is for reference only and does not constitute any financial, investment, or legal advice. Gate does not guarantee the accuracy or completeness of the information and shall not be liable for any losses arising from the use of this information. Virtual asset investments carry high risks and are subject to significant price volatility. You may lose all of your invested principal. Please fully understand the relevant risks and make prudent decisions based on your own financial situation and risk tolerance. For details, please refer to
Disclaimer.
Related Articles
Surviving Oscillating Markets: How Retail Investors Can Minimize Losses? Capital Flow Trends and Practical Guide
Author: MyToken
In the crypto market, sentiment often emerges more easily than logic. When "volatility" becomes the norm for the broader market and "anxiety" becomes the prevailing mindset among retail investors, a discussion on how to "lose less money" carries more practical significance than any macro narrative presentation.
Recently, the renowned data aggregation platform MyToken hosted an AMA event themed "In the Current Market, How Can Retail Investors Lose Less Money? Capital Flow and Practical Guide." The event invited independent trader BTC Bull Demon King and KTX Exchange CMO Christine, who provided puzzled investors with a practical "survival guide" from the perspectives of independent traders and trading platforms respectively.
Below is a highlight recap of this AMA.
---
Market Phase Consensus: Stop Fantasizing About a Bull Run, This is a "Consolidation Phase"
Market positioning is a relatively important issue, as it directly determines the next
PANews1h ago
NAV Price Surges 44.25%: Is a New Trend Emerging?
NAV coin recently surged by 44.25%, reaching $0.032715, amid increased trading activity and fluctuating market conditions. Analysts attribute this rally to rising on-chain activity and shifting sentiment toward altcoins, while traders monitor key price levels for future movements.
Coinfomania2h ago
Why TARA Just Skyrocketed 24.47% in 60 Minutes
TARA's price surged 24.47% to $0.000047 amid mixed signals in the crypto market and increased trading activity. Market conditions and macroeconomic factors are influencing investor sentiment, with traders closely monitoring key resistance and support levels.
Coinfomania2h ago
XRP Reclaims $1.40 Mark as Price Jumps 6%, Where Is Price Heading? - U.Today
XRP recently surpassed the $1.40 resistance level, driven by a 12.92% spike in trading volume to $2.63 billion. Renewed interest, notably due to a partnership with Mastercard, may help sustain upward momentum, with potential targets of $1.50 and $2. However, a drop below $1.39 could negate this breakout.
UToday3h ago
PI Jumps 16% After V20.2 Upgrade and AI Node Plans
Pi Network completed the V20.2 upgrade, ensuring node alignment and network stability for all operators.
AI node experiments tested decentralized computing, using spare node capacity to handle real AI tasks.
PI price jumped 16%, breaking resistance at $0.23, eyeing $0.28 as key target.
P
CryptoNewsLand5h ago