
Stable (STABLE) is ripping higher today. The token is up about 15% and trades near $0.03420, making it the top gainer in the market at the time of writing.
Volume is the bigger headline, it’s up roughly 530%, which is exactly the kind of spike that turns a normal move into a scramble.
This rally didn’t start with a big product update or a major listing. It started with attention.
A cluster of influencers dropped near-identical “Long ALERT” calls for STABLE on February 26, 2026, pushing entries around $0.03220 and even mentioning 75x leverage.
That sort of coordinated messaging can pull a lot of fast money into one ticker, especially when traders feel like they’re early to a move.
The catch is obvious: when a pump is powered by social heat, it can cool off just as fast. If the chatter fades, price often loses its engine.
However, the broader market also had wind at its back, with total crypto market cap rising close to 4% as traders positioned themselves around macro headlines. That gave STABLE a cleaner runway.
Still, the STABLE price didn’t rise because Bitcoin was green. It outpaced the market because the flow into it was extreme. A volume surge of this size creates its own gravity: more liquidity, more chasing, and more forced reactions from late shorts or over-leveraged traders.
What the Stable Chart Shows Right Now
On the 1H chart, the STABLE price broke out of a long, choppy range and pushed into fresh local highs around the $0.034–$0.035 area. The move looks like a classic “range escape”, weeks of sideways action, then a sudden expansion once price cleared overhead friction.
The level near $0.0322 now stands out as the first area bulls will want to defend, since it’s close to the breakout point and the level being echoed across social calls.
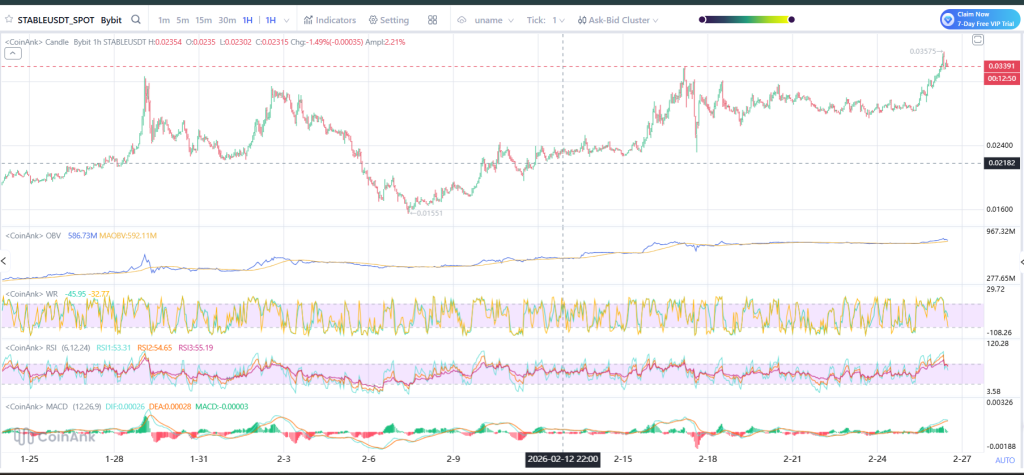
Source: Coinank
Volume-backed strength shows up in the OBV, which has been grinding higher and is now pressing up again into the spike. That fits the story of real participation, not a thin wick on low liquidity. It also means any reversal won’t be quiet, if sellers show up, it will likely be loud.
Momentum indicators look stretched but not blown out. RSI is sitting in the mid-50s area on this view, which leaves room for continuation if buyers stay active.
Williams %R is hovering near the middle band, and MACD has curled upward with green bars returning, a sign that short-term momentum has flipped back in favor of the upside.
The risk is simple: a drop back under $0.032 turns this move into a bull trap fast, and the chart would start pulling price back toward the prior base near $0.028–$0.030.
What to Watch Next For Stable
The STABLE price is moving because traders are piling in, and the volume confirms that. The cleanest tell from here is whether price can keep holding above the $0.032–$0.033 zone.
If it does, the market will keep testing higher highs. If it doesn’t, this turns into the kind of fast pump that gives back gains just as quickly as it printed them.
_****Here’s Why Polkadot ($DOT) Price Pumped 30%**
Disclaimer: The information on this page may come from third parties and does not represent the views or opinions of Gate. The content displayed on this page is for reference only and does not constitute any financial, investment, or legal advice. Gate does not guarantee the accuracy or completeness of the information and shall not be liable for any losses arising from the use of this information. Virtual asset investments carry high risks and are subject to significant price volatility. You may lose all of your invested principal. Please fully understand the relevant risks and make prudent decisions based on your own financial situation and risk tolerance. For details, please refer to
Disclaimer.
Related Articles
Ethereum Eyes Bullish Breakout – Analysts Predict Potential Rally to $2,500 As Scarcity Increases
The cryptocurrency market is currently at a crucial technical juncture for ETH. The second largest digital asset is poised for a structural change, with Ethereum testing a critical resistance zone near $2,150 in mid-March 2026. A breakthrough above that level is the main signal technical analysts ne
BlockChainReporter6m ago
BTC 15-minute gain of 0.63%: ETF positive news combined with institutional fund inflows triggers breakthrough
From 2026-03-15 22:30 to 2026-03-15 22:45 (UTC), BTC rose 0.63% within 15 minutes, with a price range of 71926.4 to 72500.0 USDT and a volatility amplitude of 0.80%. During the same period, trading volume increased notably with buy-side dominance, market attention heated up, and fluctuation intensity exceeded the intraday average, reflecting rising sentiment and active short-term trading activity.
The main driver of this price movement is a macro positive catalyst: The US SEC released a positive statement regarding bitcoin ETF approval progress at 22:00, which directly bolstered
GateNews23m ago
Analyst Says Bitcoin Indicators Show Early Signs of Market Recovery
Stablecoin liquidity rose by ~$8B since February, signaling potential improved market trading conditions.
Inter-exchange Flow Pulse turned positive, indicating more Bitcoin moving to derivatives platforms.
Long-term holders retain ~79% of supply, showing gradual supply transfers rather
CryptoFrontNews2h ago
Dogecoin at a Turning Point — Will $0.094 Resistance Finally Break?
Dogecoin was trading between $0.0925 and $0.09173 with the price stabilizing around $0.0925.
The immediate $0.09443 resistance caps the current range. A move above this level could expand today’s trading activity.
Past historical price movements coincide with a number of trend support res
CryptoNewsLand3h ago
XRP Breaks $1.40 Resistance as Volume Surge Lifts Momentum
Key Insights
XRP surged past the $1.40 resistance after trading volume climbed nearly 13%, signaling renewed trader interest and stronger short-term momentum.
Ripple’s collaboration with Mastercard through the Crypto Partner program increased market attention as investors anticipate
CryptoNewsLand3h ago
XRP Price Structure Tightens While Heatmap Highlights $1.30 Liquidity Zone
XRP trades near $1.37 support after a 0.9% daily decline, while the $1.44 level remains the immediate resistance in the current range.
A three-week liquidity heatmap highlights a large order cluster around $1.30, indicating a strong liquidity zone below price.
A three-month Gaussian
CryptoNewsLand4h ago