Will Bitcoin Cash (BCH) succeed in replicating the 28% growth pattern from 2025?
Recently, the price of Bitcoin Cash (BCH) has experienced a significant decline, raising concerns about a broad downtrend reversal. BCH has fallen along with the overall cryptocurrency market trend, testing short-term support levels. However, from a macro perspective, this correction may just be a consolidation phase similar to previous cycles.
Historical data shows that between October and November 2025, BCH underwent a similar fluctuation, forming a compression structure before a strong rally with a 28% increase. The current price behavior, along with signs of accumulation, suggests that a similar scenario may be developing.
BCH Investors Continue Accumulation Trend
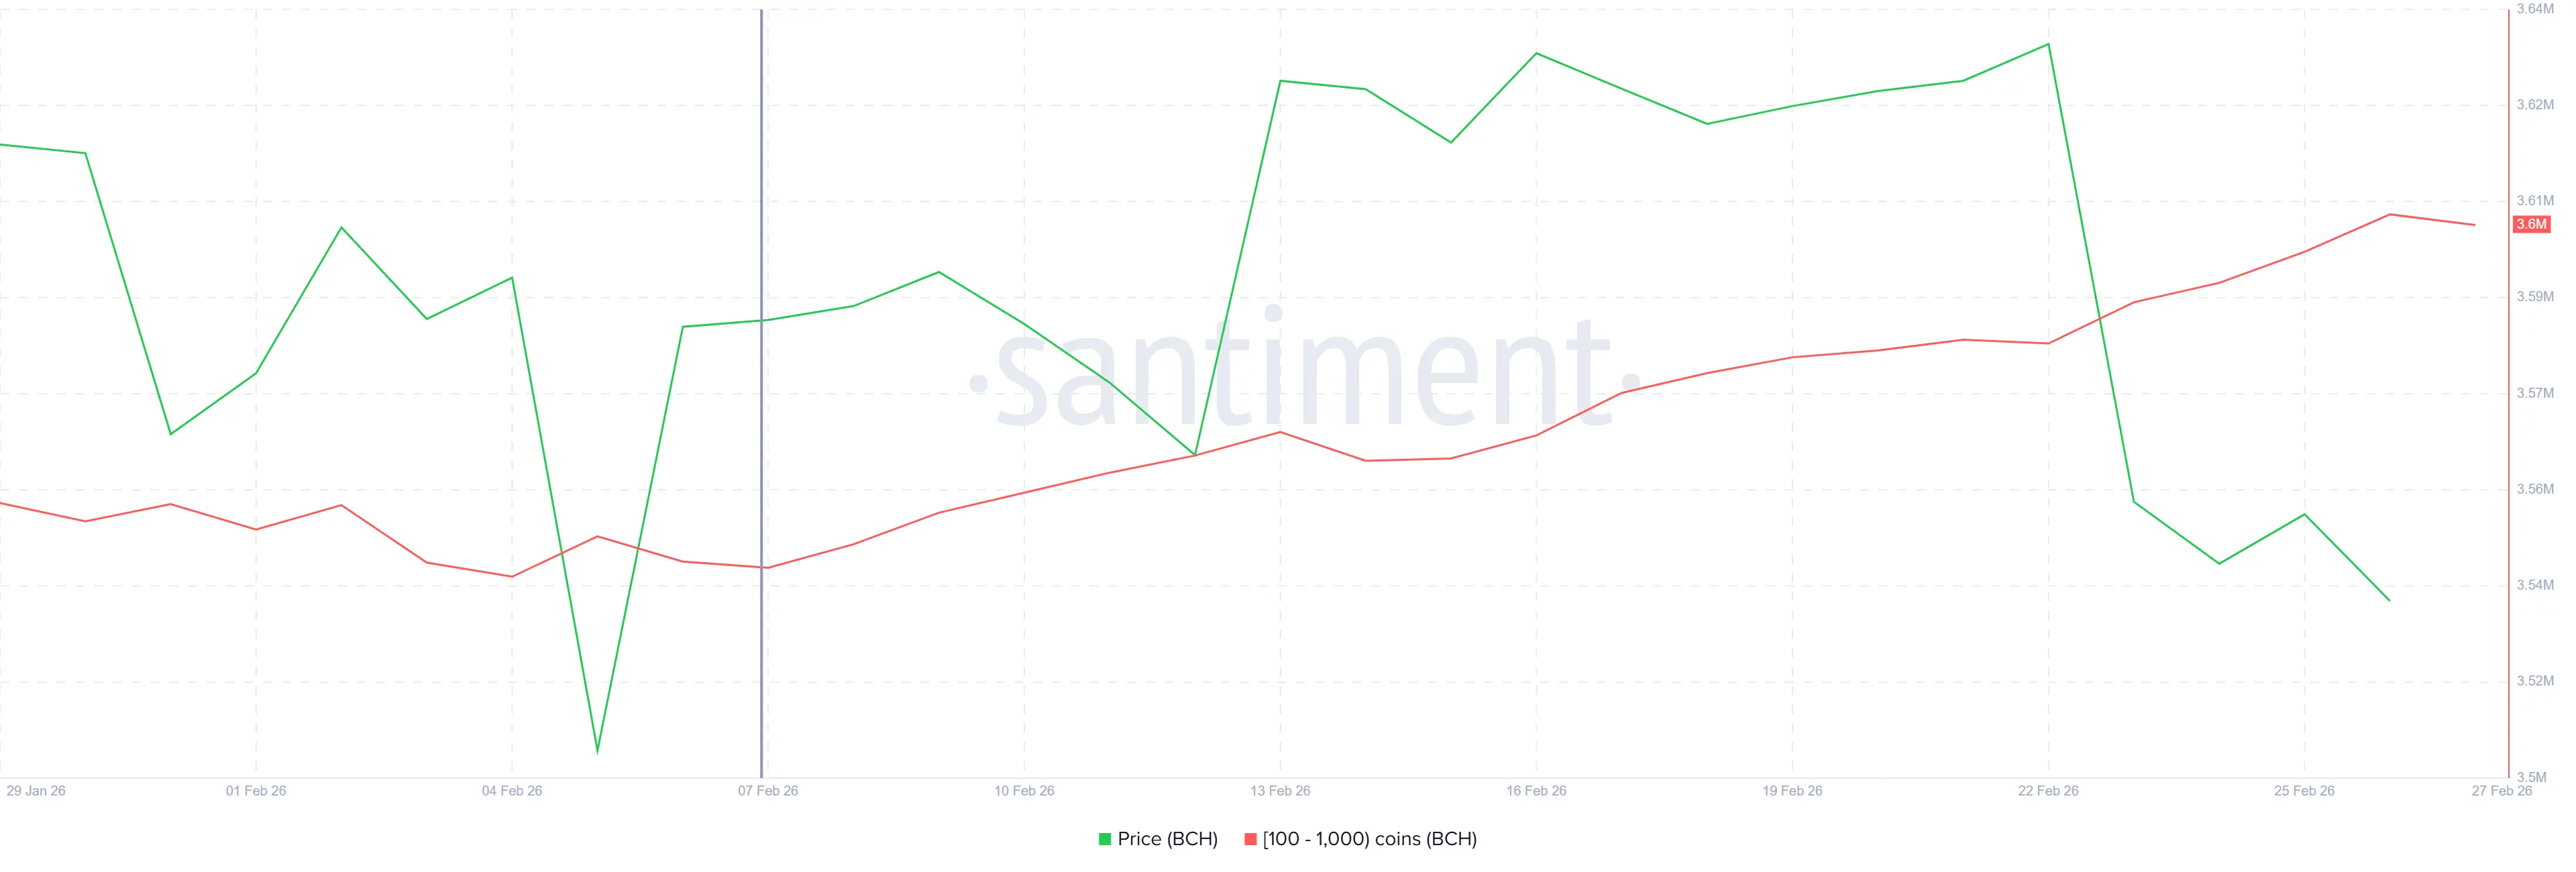
On-chain data indicates that holders of BCH are steadily accumulating. Over the past 20 days, addresses holding between 100 BCH and 1,000 BCH have bought approximately 60,000 BCH, worth an estimated $28.6 million at current prices.
This group of investors is not large whales but is often seen as representing natural market demand. Their continued buying amid falling prices is a positive sign and demonstrates resilience. Unlike short-term traders who tend to sell off for quick profits, this group typically builds positions gradually and sustainably. Continuous accumulation by these investors could create a solid support layer for BCH’s price.
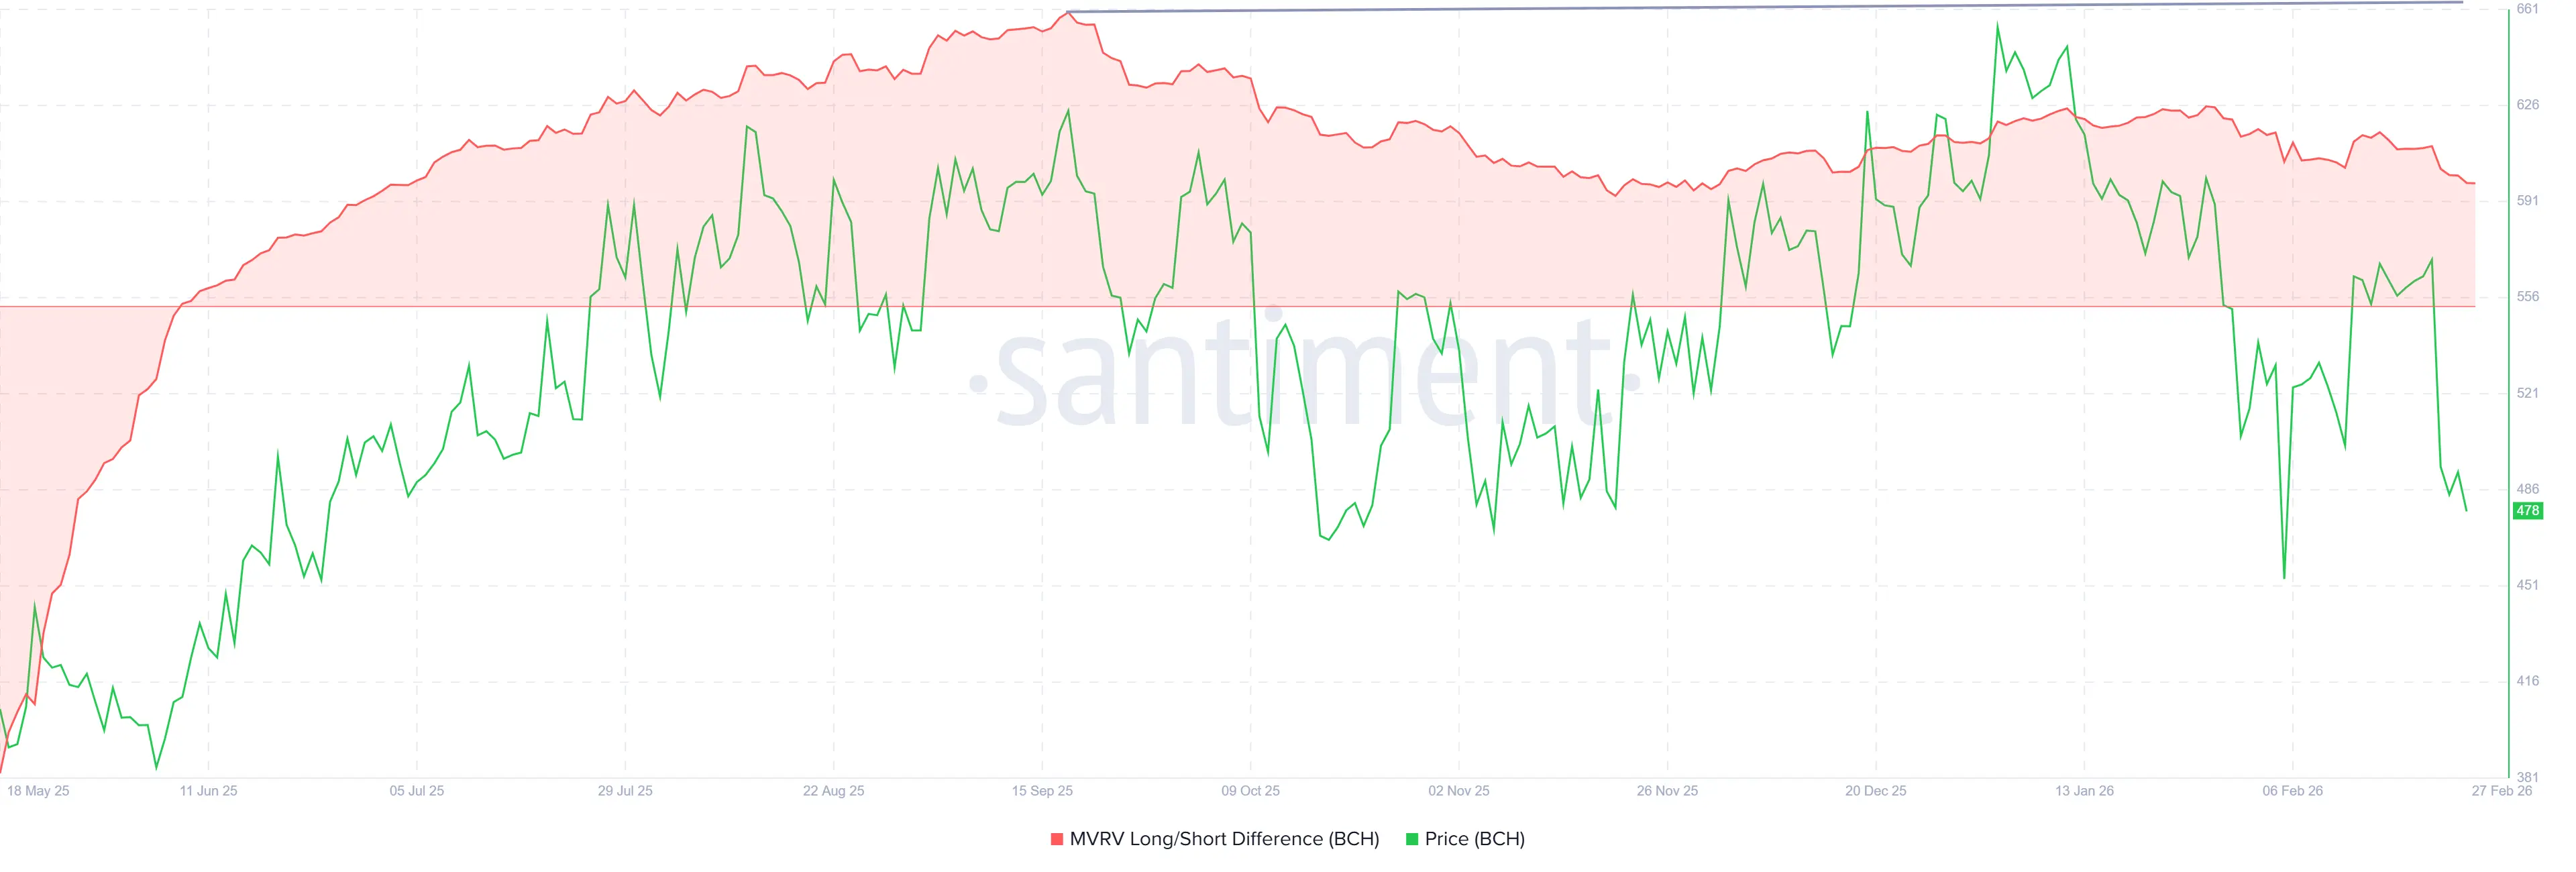
 Bitcoin held by investors during accumulation | Source: SantimentAdditionally, the MVRV Long/Short Difference index provides further insight. Currently, this index is positive, indicating that long-term investors are realizing higher profits compared to short-term traders.
This factor is crucial in maintaining BCH’s stability. While short-term investors often quickly take profits on minor gains, long-term investors tend to hold their positions even amid market volatility. The dominance of long-term holders not only reduces selling pressure but also strengthens the foundation for a potential recovery.
 Bitcoin Cash buy and sell order imbalance | Source: Santiment## Could BCH Price Repeat History?
Currently, BCH is trading around $478 and forming an ascending triangle pattern—similar to the structure seen from October to November 2025 before a sharp rally. The breakout from that pattern helped BCH grow by 28% after a prolonged accumulation phase.
For this scenario to repeat, the support level at $479 must remain stable. Notably, a 15% decline last week reinforced the triangle shape. If the price can convincingly break above the resistance at $540, it would signal renewed bullish momentum, opening the door for a similar rally as before.
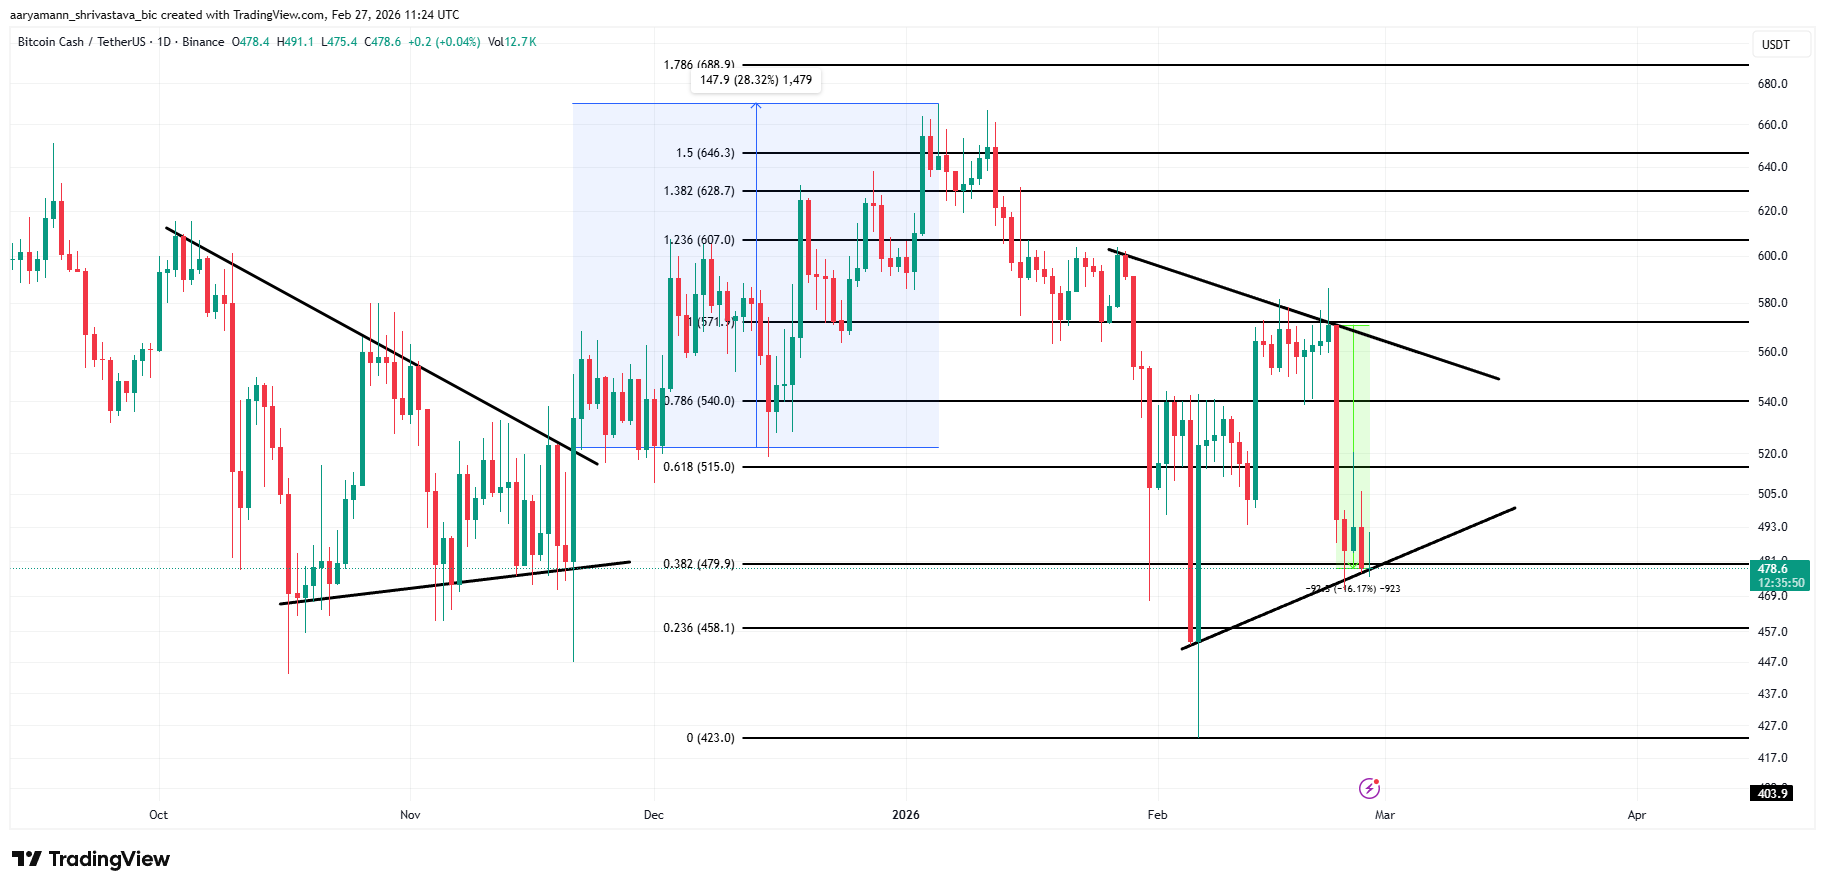 BCH Price Analysis | Source: TradingViewHowever, downside risks cannot be entirely ruled out. If selling pressure suddenly intensifies, BCH could drop to a key support level at $458. Breaking below this level would significantly weaken the bullish outlook. In the worst case, if BCH continues to fall below $458, the price could retreat to $423, invalidating the recovery thesis and reinforcing a bearish trend.
Although BCH faces short-term selling pressure, historical price patterns and accumulation signals from medium-term investors suggest recovery potential remains. However, to confirm an uptrend, BCH needs to hold critical support levels and break through strategic resistance points. In the volatile cryptocurrency market, investors should exercise caution and closely monitor market signals.
Related Articles
Data: In the past 24 hours, the total liquidation across the network was $526 million, with long positions liquidated at $316 million and short positions at $210 million.
Bitcoin manipulation claims face pushback as ETFs reverse 5wk outflow
Bitcoin ETF Inflow Streak Snaps With $27 Million Outflow
Best Crypto Presale 2026: DOJ Seizes $61 Million in Tether Scam as Pepeto Presale Outpaces Mutuum Finance and Bitcoin Hyper