- Chainlink has expanded to 16 additional integrations this week, covering six services across five blockchains, including Arc, Canton Network, and World Chain.
- Technical indicators suggest LINK still needs to clear major resistance before a stronger rally can begin.
Chainlink expanded its ecosystem with 16 integrations spanning six services and five blockchains, among them Arc, Canton Network, DogeOS Chikyu, MegaETH, and World Chain. Some of the newly integrated projects are Arc, BitSafe Finance, Canton Network, DogeOS, Kairo, MegaETH, Temple, ThetanutsFi, UnhedgedHQ, and World Chain.
The update adds to a steady run of ecosystem expansion during the first quarter of 2026. Earlier last month, Chainlink posted another adoption update covering 20 integrations across 8 services and 12 blockchains, including Ethereum, Linea, World Chain, and zkSync.
Recent adoption has also stretched into multiple product lines. Chainlink’s current suite includes Data Feeds, CCIP, VRF, Automation, and Functions. These services support smart contracts that need external data, cross-chain messaging, randomness, scheduled execution, and offchain computation.
⬡ Chainlink Adoption Update ⬡
There were 16 integrations of the Chainlink standard across 6 services and 5 different chains: Arc, Canton Network, DogeOS Chikyu, MegaETH, and World Chain.
New integrations include @arc, @BitSafe_Finance, @CantonNetwork, @DogeOS, @kairo_ag,… pic.twitter.com/hLJnWv1fz2
— Chainlink (@chainlink) March 1, 2026
The network’s recent activity also connects with its wider push into institutional blockchain infrastructure. CNF announced that Canton Network had entered a strategic partnership with Chainlink. Under that arrangement, Canton joined the Chainlink Scale program and gained access to real-time data and cross-chain infrastructure.
Chainlink Price Prediction: Will LINK Rally to $20 in March?
The most recent wave of integration has provided a new stimulus to LINK’s market movement. With the growth of ecosystem activity, traders are monitoring whether growth in usage can support a bigger LINK price upside movement.
Data from Chainlink’s ecosystem shows that network development remains active across several services. That gives LINK a stronger utility narrative than tokens tied to a single product cycle. It also keeps market attention on whether adoption can turn into stronger token demand.
Technical indicators show that LINK still needs stronger momentum to approach the $20 level. To overcome the current short term resistance of $10, there needs to be sustained purchases and expanded crypto market strength.
The MACD setup in the daily chart is improving, and the MACD line is rising above the signal line. The histogram has also crossed over to positive at 0.126, which is an indication of positive upward momentum. This implies that Chainlink is remaining bullish in the short run as the purchasing power starts to pick up.
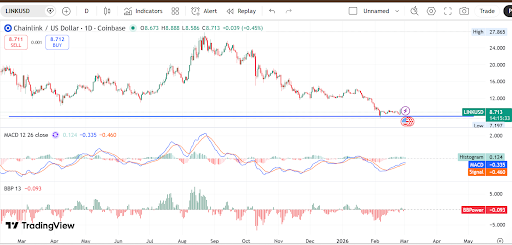
LINKUSD 1-Day Chart | Source: TradingView
In the meantime, the Bull Bear Power is also indicating a bullish direction as bearish pressure eases. Though the indicator is still below zero, the bars are decreasing in negativity, and this is an indicator that seller power is being diminished.
At press time, LINK was trading at $8.72, having risen by more than 3% in the last seven days. Chainlink registered 24 hours trading volume of $728.3 million, representing 15.12% growth in the same period.
Disclaimer: The information on this page may come from third parties and does not represent the views or opinions of Gate. The content displayed on this page is for reference only and does not constitute any financial, investment, or legal advice. Gate does not guarantee the accuracy or completeness of the information and shall not be liable for any losses arising from the use of this information. Virtual asset investments carry high risks and are subject to significant price volatility. You may lose all of your invested principal. Please fully understand the relevant risks and make prudent decisions based on your own financial situation and risk tolerance. For details, please refer to
Disclaimer.
Related Articles
Bitcoin Shows Value Bottom Signals but True Market Floor Missing
Bitcoin is at a "Value Bottom" ideal for long-term dollar-cost averaging, but has not yet reached a "Structural Bottom," leading to projected volatility between $60K-$70K. Investors should prepare for continued fluctuations and potential buying opportunities.
BlockChainReporter1h ago
Bitcoin Trades Narrow Range As Resistance Holds Near $71K
Bitcoin is trading around $70,335, showing a 2.13% decline in 24 hours. Analysts note a resistance near $71,400 and a consolidation phase, with traders awaiting a decisive breakout above or below established support and resistance levels.
CryptoBreaking1h ago
BTC 15-minute rise of 0.60%: ETF capital inflows and technical breakout resonance drive short-term momentum
2026-03-13 12:45 to 2026-03-13 13:00 (UTC), BTC achieved a +0.60% return within 15 minutes, with a price range of 72341.6-72888.0 USDT and a volatility amplitude of 0.76%. Short-term price oscillations noticeably intensified. Due to abundant trading volume, market attention rose rapidly, reflecting a phase of strengthened buying power.
The primary drivers of this movement are continuous net inflows into ETFs and a technical breakout of key structures. In March 2026, BTC spot ETFs attracted capital inflows as high as 1.6 billion dollars in a single week.
GateNews2h ago
DeFi enters a "winter of yields": liquidity stagnation, leverage contraction, and the disappearance of arbitrage opportunities
The DeFi market entered an "interest rate winter" since September 2025, with deposit rates for major stablecoins declining sharply and supply-demand imbalances causing liquidity congestion. The rate decline reflects reduced capital demand and a lack of high-return opportunities. Stablecoin lending demand has dropped significantly, with market risk appetite shifting toward more stable investment channels. In response to this situation, the Sky protocol demonstrates competitiveness and adaptability by introducing real-world assets to enhance yields. The low interest rates during this phase can be viewed as an opportunity for DeFi market transformation.
区块客2h ago
"Seeking a Sword by Marking a Boat" - Style Coin Price Predictions Go Viral: The Practical Logic and Flaws of Mystical Prophecies
Author: Frank, PANews
Whenever the market enters a confusing phase of going nowhere, people try to use a "cutting the boat to seek the sword" method of historical retrospection to predict the next market movement. In such cases, people often see from these theories and charts that history always repeats itself, and seem to automatically overlay and verify future price movements with a certain period in the past.
This coincidence seems to have a magical effect and is often verified. Some bloggers claim this prediction method has an accuracy rate of 75%~80%.
Does this "cutting the boat to seek the sword" style price prediction that repeatedly goes viral on social media help the market identify stages, or is it just packaging noise as prophecy?
From "Tick Fractals" to "History Rhyming"
The peak operation regarding predictions of October 2025 market tops is an analyst named CryptoBullet, who created a method called "ti
区块客2h ago