

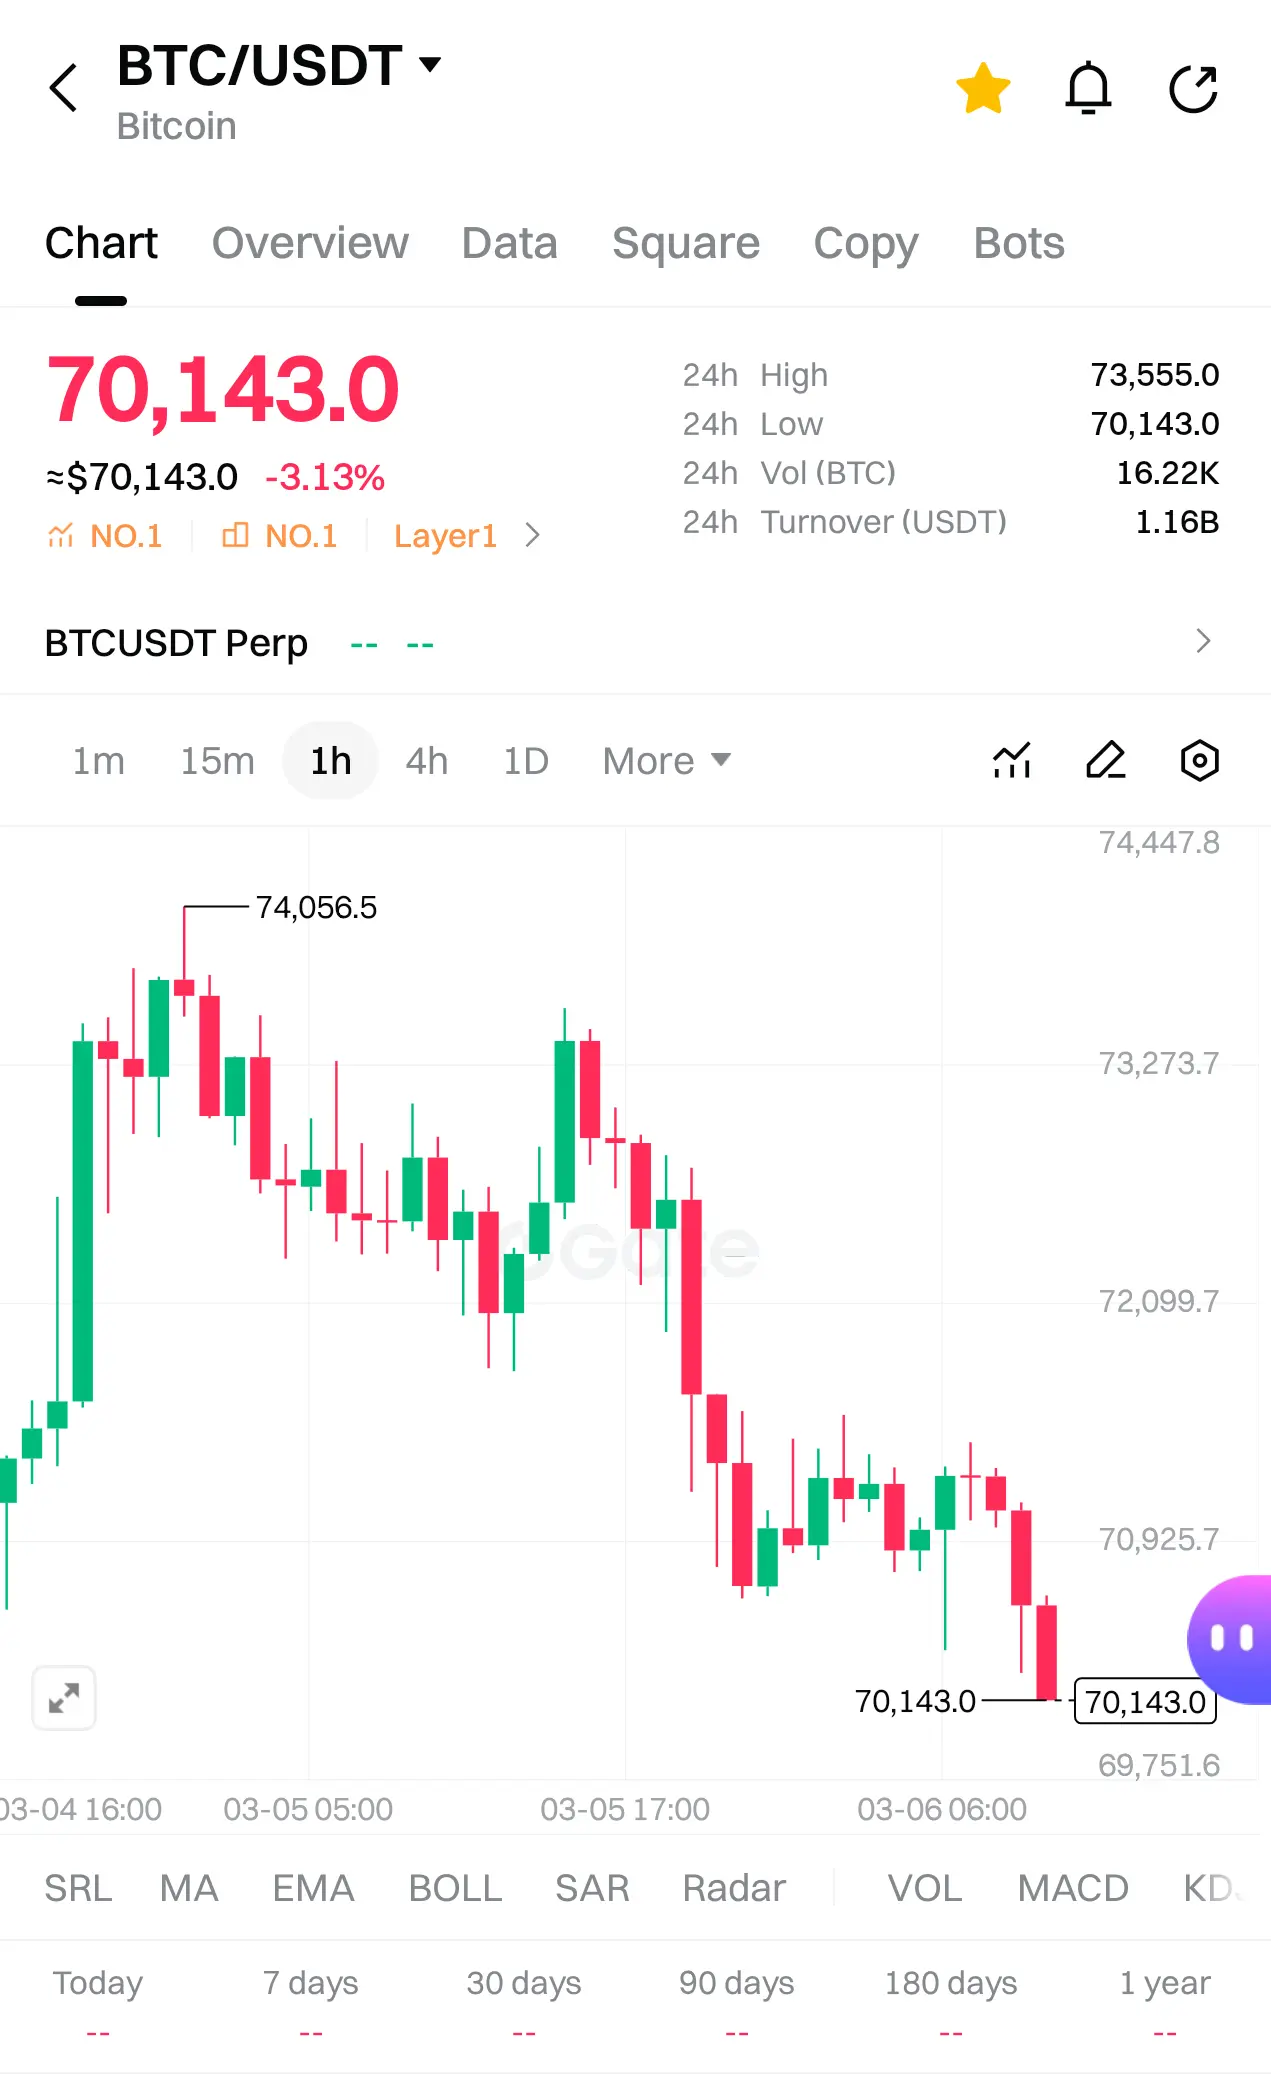
$BTC showing a controlled pullback after the recent push toward 74K. I'm seeing a classic liquidity reset happening here.
Reason I'm watching this closely:
The market just rejected near 74K, which was the recent local high. After that rejection, price started forming lower highs on the 1H chart, showing short-term selling pressure.
But the interesting part is the current zone.
Price is now sitting around 70K, which has acted as a strong psychological and structural support in previous moves. I'm seeing buyers step in multiple times around this level before.
What this move looks like to me:
• Weak hands getting flushed
• Liquidity building below the range
• Market preparing for the next direction
When price pulls back after a strong move and holds a key support level, it often sets up the next expansion move.
I'm watching for a bounce from this support zone.
Here’s the trade setup I'm planning.
Entry Zone
I'm looking to enter around 69,800 — 70,300
This is the support region where buyers previously reacted.
Stop Loss
68,900
If price breaks this level with strong momentum, it means support failed and the structure changes.
Target Levels
First Target
72,200
This is the first resistance where price previously consolidated.
Second Target
73,500
Major rejection zone from the recent move.
Final Target
75,000
If momentum returns, this level becomes the breakout continuation area.
How this move becomes possible:
The market just created a liquidity sweep toward the downside. When price dips into support while sentiment turns bearish, it often traps late sellers.
If buyers defend the 69K–70K zone, the market can quickly rotate back up as short positions get squeezed.
I'm watching for strong reaction candles and volume confirmation from this area.
If that happens, momentum can shift fast.
I'm positioning early and managing risk properly.
Let's go and Trade now $BTC