Trade
Basic
Futures
Futures
Hundreds of contracts settled in USDT or BTC
TradFi
Gold
Trade global traditional assets with USDT in one place
Options
Hot
Trade European-style vanilla options
Unified Account
Maximize your capital efficiency
Demo Trading
Futures Kickoff
Get prepared for your futures trading
Futures Events
Participate in events to win generous rewards
Demo Trading
Use virtual funds to experience risk-free trading
Earn
Launch
CandyDrop
Collect candies to earn airdrops
Launchpool
Quick staking, earn potential new tokens
HODLer Airdrop
Hold GT and get massive airdrops for free
Launchpad
Be early to the next big token project
Alpha Points
Trade on-chain assets and enjoy airdrop rewards!
Futures Points
Earn futures points and claim airdrop rewards
Investment
Simple Earn
Earn interests with idle tokens
Auto-Invest
Auto-invest on a regular basis
Dual Investment
Buy low and sell high to take profits from price fluctuations
Soft Staking
Earn rewards with flexible staking
Crypto Loan
0 Fees
Pledge one crypto to borrow another
Lending Center
One-stop lending hub
VIP Wealth Hub
Customized wealth management empowers your assets growth
Private Wealth Management
Customized asset management to grow your digital assets
Quant Fund
Top asset management team helps you profit without hassle
Staking
Stake cryptos to earn in PoS products
Smart Leverage
New
No forced liquidation before maturity, worry-free leveraged gains
GUSD Minting
Use USDT/USDC to mint GUSD for treasury-level yields
More
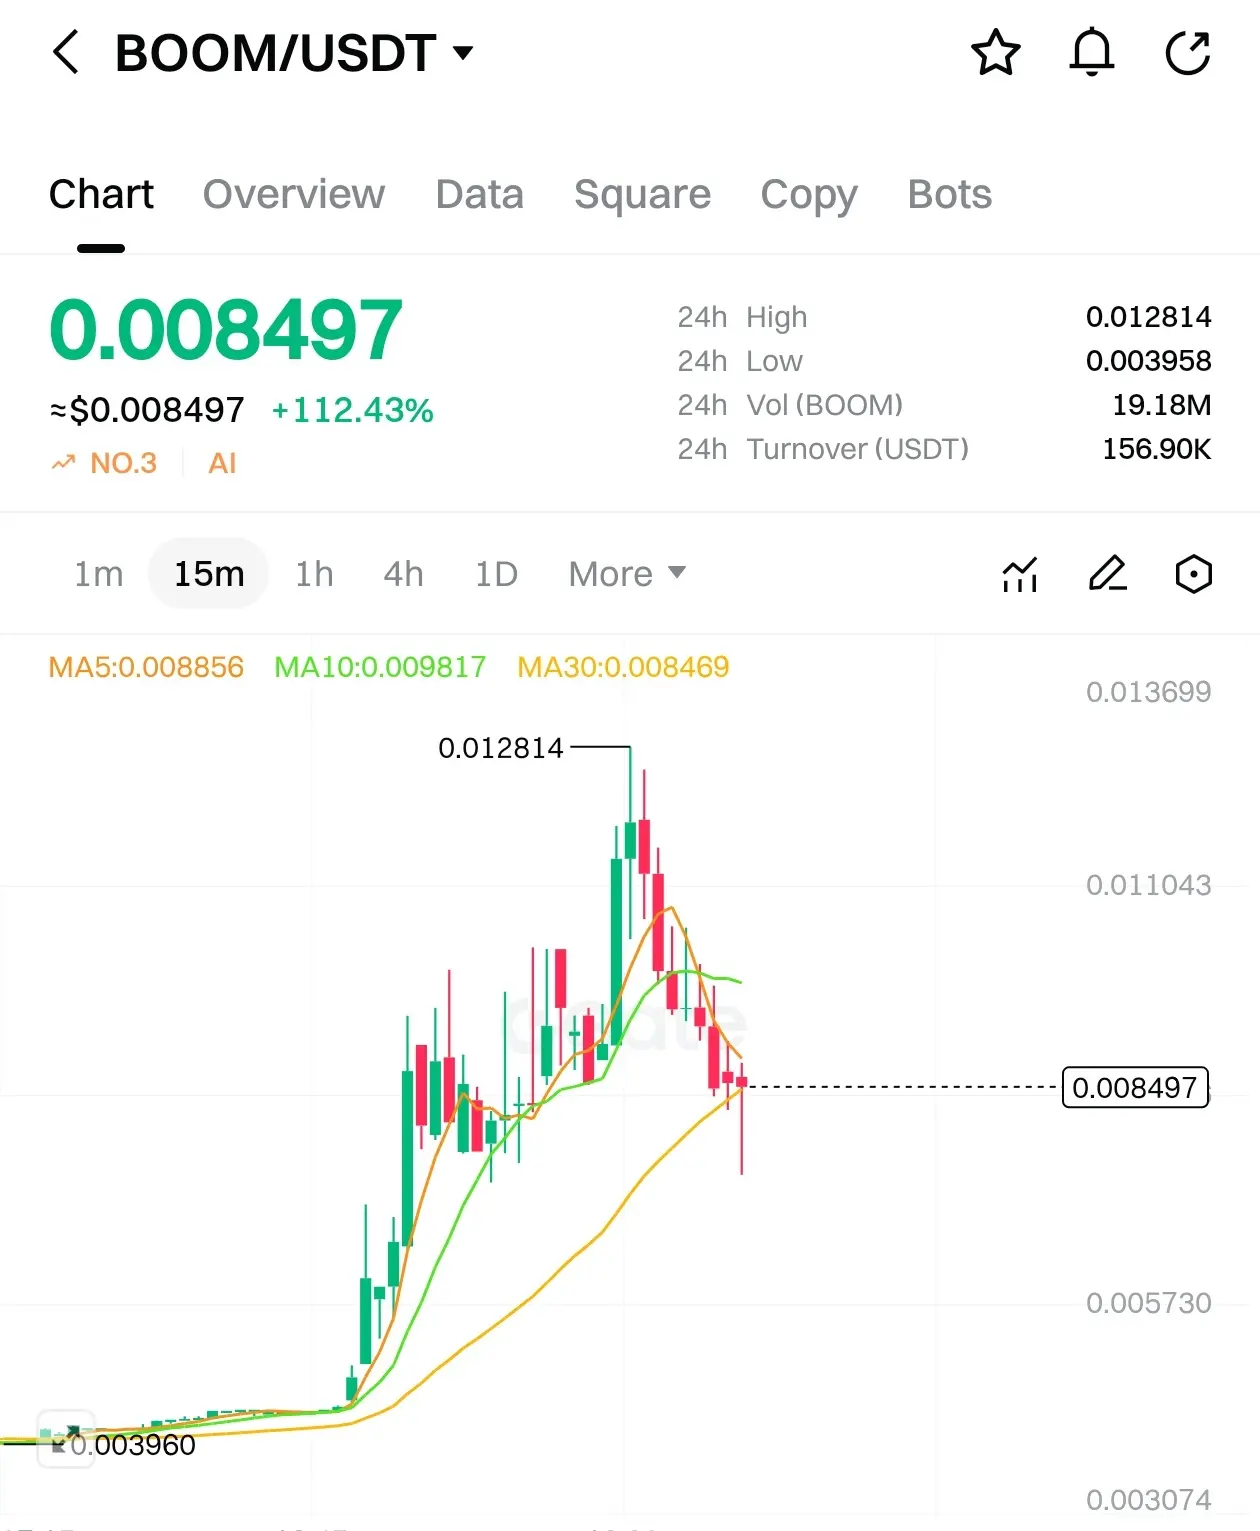
# BOOM
647.2K
RyleKincaid
$BOOM
Parabolic push followed by a sharp pullback — now consolidating above the broken base. Momentum cooled, but structure remains bullish as long as support holds. Breakout risk returns if buyers defend this zone and reclaim short MAs.
• Entry Zone: 0.0081 – 0.0086
• TP1: 0.0098
• TP2: 0.0110
• TP3: 0.0128
• Stop-Loss: 0.0074
#BOOM #ContentMiningRevampPublicBeta #TrumpWithdrawsEUTariffThreats #IranTradeSanctions
BOOM-7,66%
- Reward
- like
- Comment
- Repost
- Share
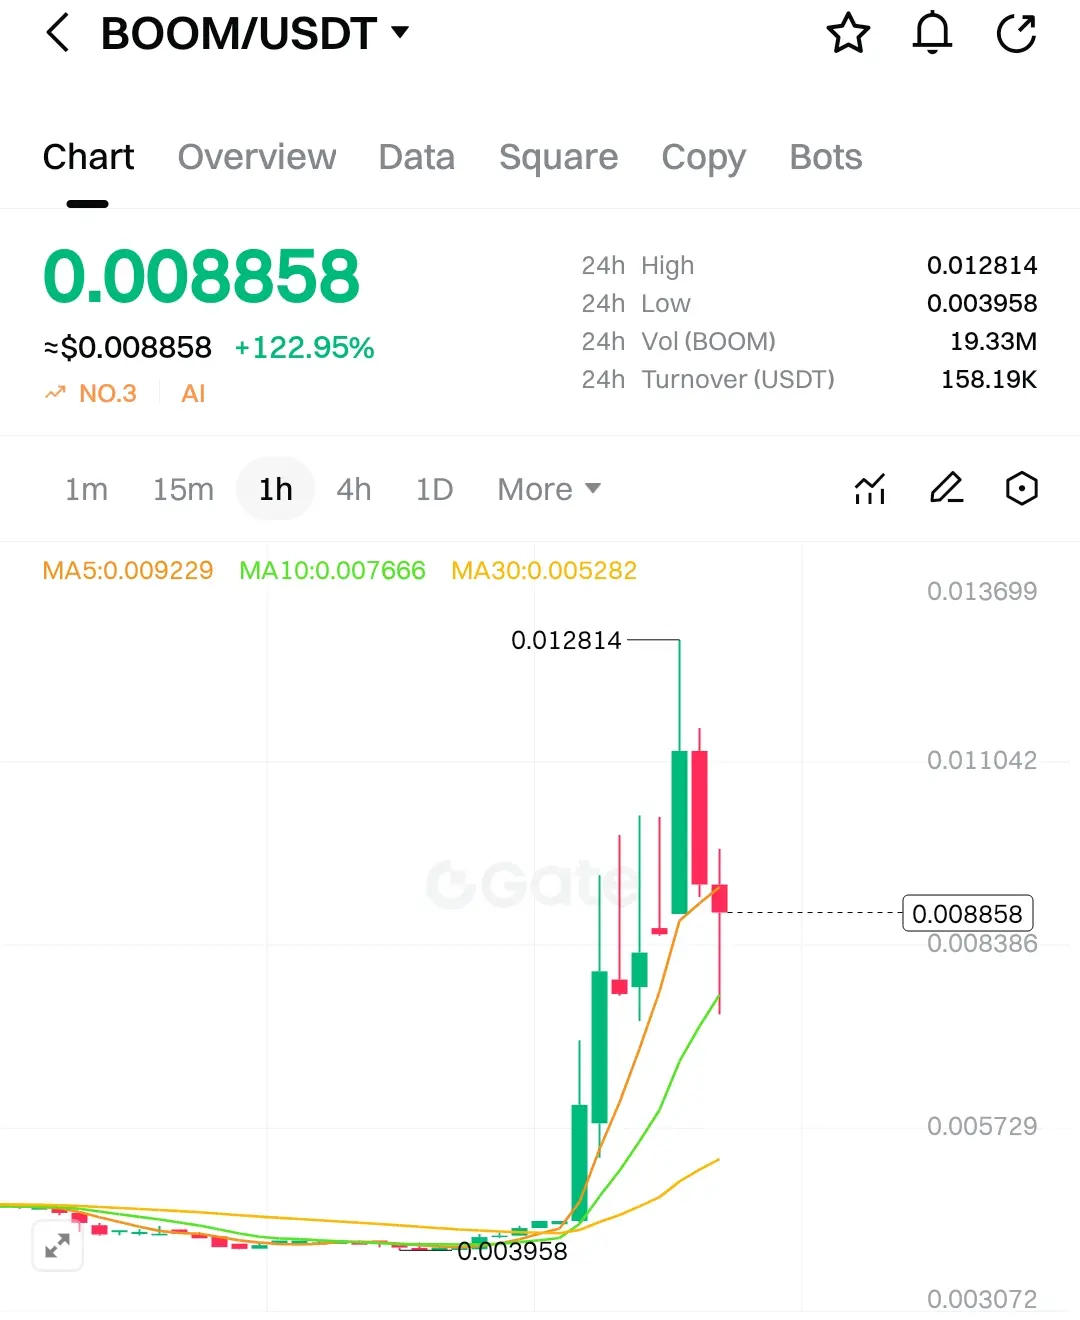
$BOOM
Chart exploded +122%. High momentum move off the lows. Currently consolidating after a massive pump. Key support at the MA30 (0.00528) and recent low. Resistance above at yesterday's high and the local top. Risk is a failure to hold this level for a retest of the breakout. SL below consolidation and the moving average stack. Watching for continuation or a failed breakout.
• Entry Zone: 0.0084 - 0.0092
• TP1: 0.0110
• TP2: 0.0128
• TP3: 0.0137
• Stop-Loss: 0.0057
#Boom #ContentMiningRevampPublicBeta #GoldandSilverHitNewHighs
BOOM-7,66%
- Reward
- like
- Comment
- Repost
- Share
Load More
Join 40M users in our growing community
⚡️ Join 40M users in the crypto craze discussion
💬 Engage with your favorite top creators
👍 See what interests you
Trending Topics
136.94K Popularity
25.66K Popularity
22.52K Popularity
67.4K Popularity
10.4K Popularity
274.19K Popularity
324.77K Popularity
23.51K Popularity
12.55K Popularity
10.39K Popularity
10.76K Popularity
10.7K Popularity
9.37K Popularity
38.04K Popularity
News
View MoreMetaplanet: The company's fiscal year 2025 revenue reaches 8.905 billion yen, a year-over-year increase of 738.3%
10 m
OpenEden official website and portal DNS may have been attacked; users are advised not to visit the related domains.
35 m
Trezor and Ledger users targeted by scammers, fake official letters used to conduct seed phrase phishing
46 m
Top 7 Token Unlocks Next Week: ASTER Leads with $56.17M
48 m
Data: 23,500 SOL transferred into Fireblocks Custody, worth approximately $2,006,900.
53 m
Pin