Trade
Basic
Futures
Futures
Hundreds of contracts settled in USDT or BTC
TradFi
Gold
Trade global traditional assets with USDT in one place
Options
Hot
Trade European-style vanilla options
Unified Account
Maximize your capital efficiency
Demo Trading
Futures Kickoff
Get prepared for your futures trading
Futures Events
Participate in events to win generous rewards
Demo Trading
Use virtual funds to experience risk-free trading
Earn
Launch
CandyDrop
Collect candies to earn airdrops
Launchpool
Quick staking, earn potential new tokens
HODLer Airdrop
Hold GT and get massive airdrops for free
Launchpad
Be early to the next big token project
Alpha Points
Trade on-chain assets and enjoy airdrop rewards!
Futures Points
Earn futures points and claim airdrop rewards
Investment
Simple Earn
Earn interests with idle tokens
Auto-Invest
Auto-invest on a regular basis
Dual Investment
Buy low and sell high to take profits from price fluctuations
Soft Staking
Earn rewards with flexible staking
Crypto Loan
0 Fees
Pledge one crypto to borrow another
Lending Center
One-stop lending hub
VIP Wealth Hub
Customized wealth management empowers your assets growth
Private Wealth Management
Customized asset management to grow your digital assets
Quant Fund
Top asset management team helps you profit without hassle
Staking
Stake cryptos to earn in PoS products
Smart Leverage
New
No forced liquidation before maturity, worry-free leveraged gains
GUSD Minting
Use USDT/USDC to mint GUSD for treasury-level yields
More
# BTCKeyLevelBreak
10.38K
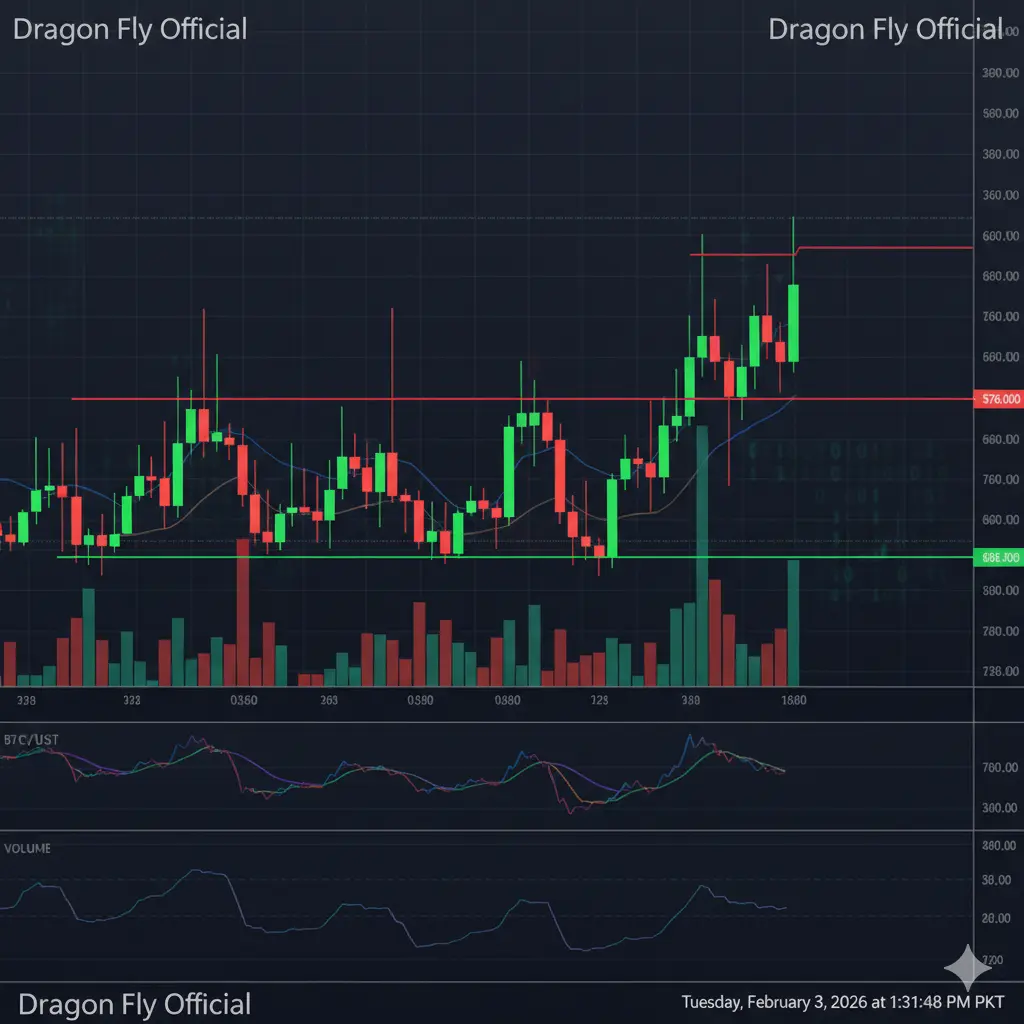
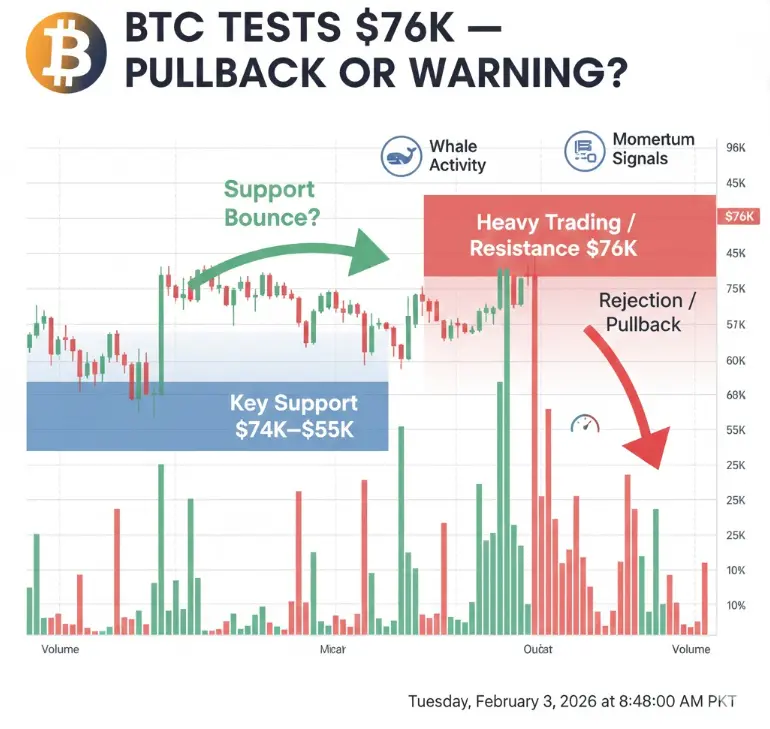
BTC tested the $76K area where heavy trading activity sits. Is this a technical pullback or a warning sign? What levels are you watching?
DragonFlyOfficial
📉 BTC Approaches $76K — Pullback or Warning?
Bitcoin recently tested the $76,000 area, a zone of heavy trading activity and historical support/resistance. This level has previously acted as a magnet for both buyers and sellers.
1️⃣ Technical Perspective
$76K sits at a high-volume node — meaning many BTC were previously traded here.
Short-term pullbacks often occur around such zones as profit-taking meets new buying interest.
Indicators like RSI and MACD suggest slightly overbought conditions, signaling a possible technical correction, not necessarily a trend reversal.
2️⃣ Market Sentiment
On-
BTC2,74%

- Reward
- like
- Comment
- Repost
- Share
#BTCKeyLevelBreak
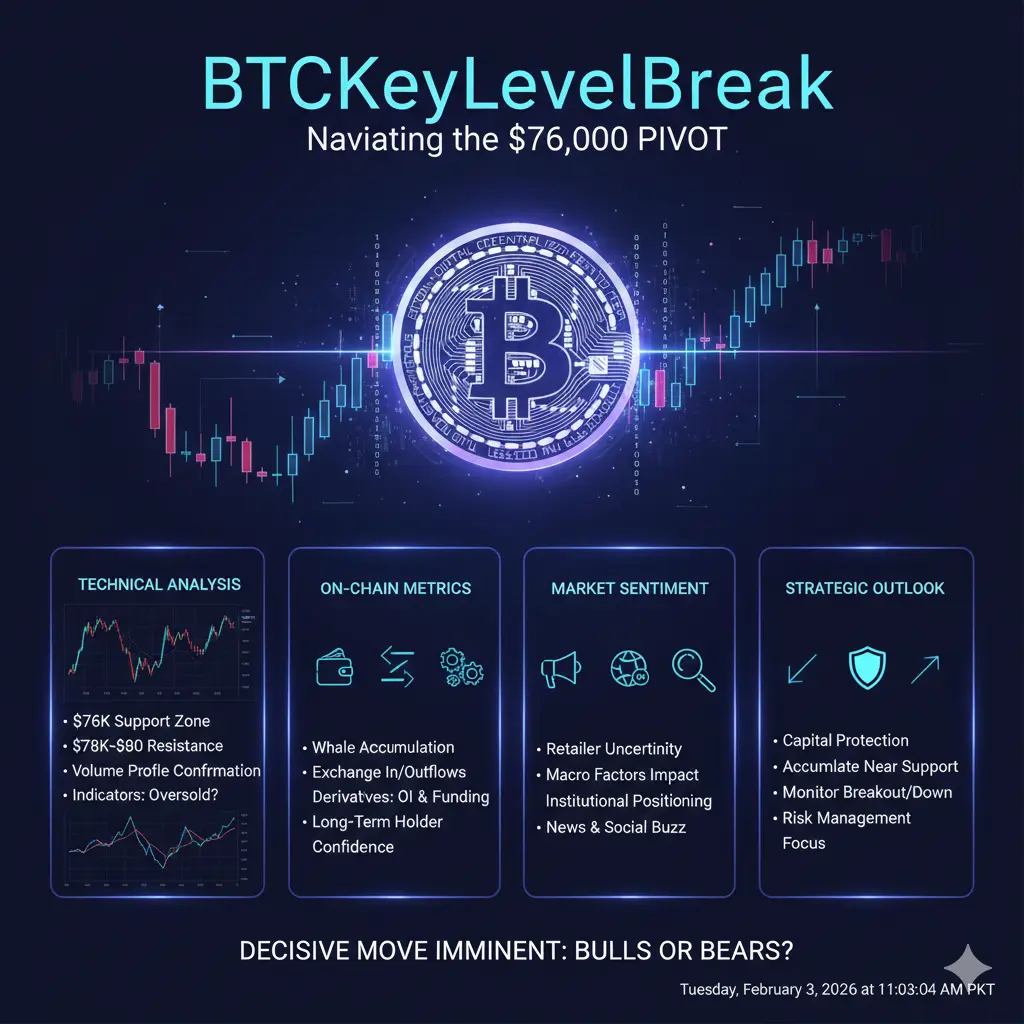
Bitcoin has recently tested the $76,000 area, a zone characterized by significant trading activity and strong historical support and resistance levels. This area has previously acted as a magnet for both institutional accumulation and retail trading activity, making it a key point of interest for market participants. The recent test of this level raises an important question: is this movement merely a technical pullback within a larger uptrend, or a warning signal indicating potential weakening in market momentum? Understanding this distinction requires a combination of tech
Bitcoin has recently tested the $76,000 area, a zone characterized by significant trading activity and strong historical support and resistance levels. This area has previously acted as a magnet for both institutional accumulation and retail trading activity, making it a key point of interest for market participants. The recent test of this level raises an important question: is this movement merely a technical pullback within a larger uptrend, or a warning signal indicating potential weakening in market momentum? Understanding this distinction requires a combination of tech
- Reward
- 1
- Comment
- Repost
- Share
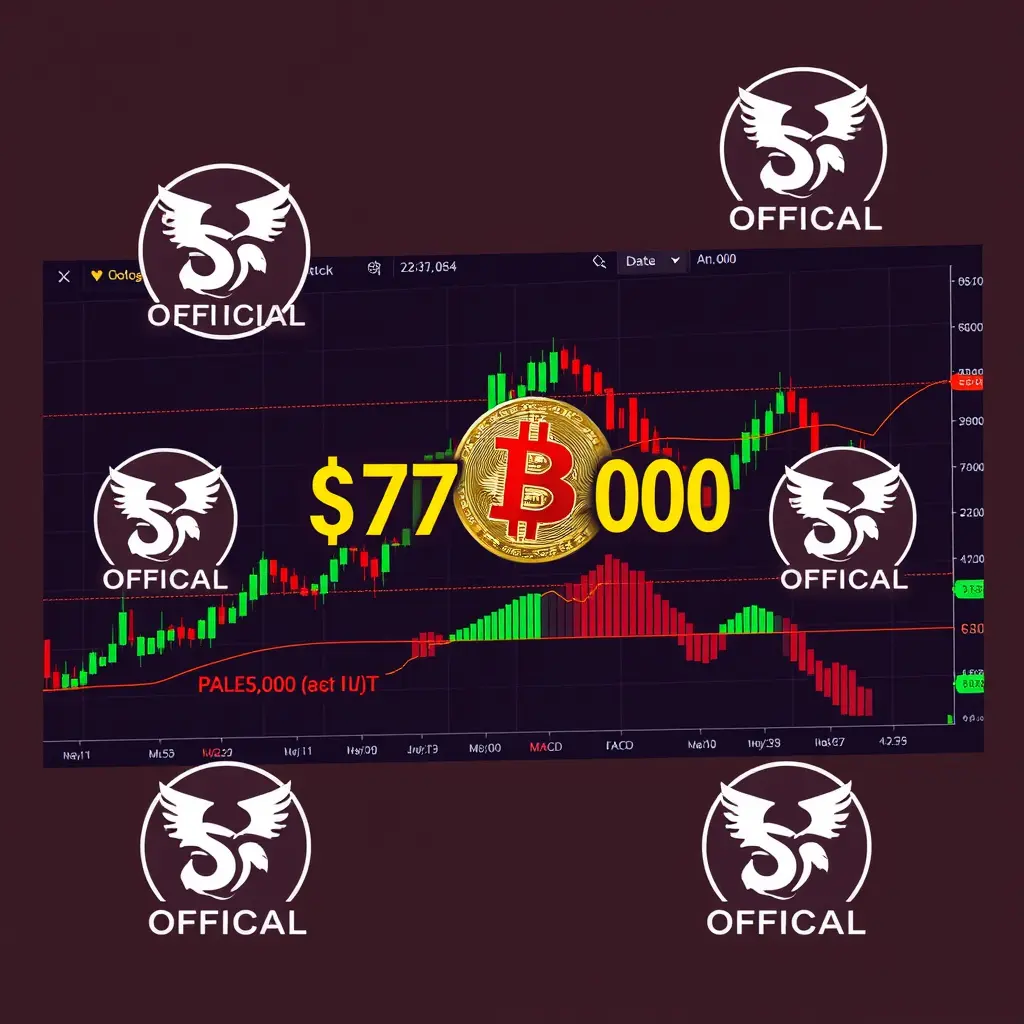
#BTCKeyLevelBreak 📉 BTC Tested the $76K Zone — Pullback or Warning Sign?
Bitcoin has tested the $76K region, an area with heavy historical trading activity and liquidity. This zone often acts as a decision point for short-term direction.
🔍 How I’m viewing it:
• If BTC holds above $76K, this looks like a healthy technical pullback within a broader structure
• Losing this level could open the door for a deeper retrace toward $72K–$70K
• Volume and reaction around this area matter more than the wick itself
📊 Key levels I’m watching:
• $76K – immediate support / acceptance zone
• $72K–$70K – hi
BTC2,74%

- Reward
- like
- Comment
- Repost
- Share
#BTCKeyLevelBreak
Bitcoin has recently tested the $76,000 area, a zone characterized by significant trading activity and strong historical support and resistance levels. This area has previously acted as a magnet for both institutional accumulation and retail trading activity, making it a key point of interest for market participants. The recent test of this level raises an important question: is this movement merely a technical pullback within a larger uptrend, or a warning signal indicating potential weakening in market momentum? Understanding this distinction requires a combination of tech
Bitcoin has recently tested the $76,000 area, a zone characterized by significant trading activity and strong historical support and resistance levels. This area has previously acted as a magnet for both institutional accumulation and retail trading activity, making it a key point of interest for market participants. The recent test of this level raises an important question: is this movement merely a technical pullback within a larger uptrend, or a warning signal indicating potential weakening in market momentum? Understanding this distinction requires a combination of tech

- Reward
- 3
- 5
- Repost
- Share
HighAmbition:
thnxx for the updateView More
#BTCKeyLevelBreak
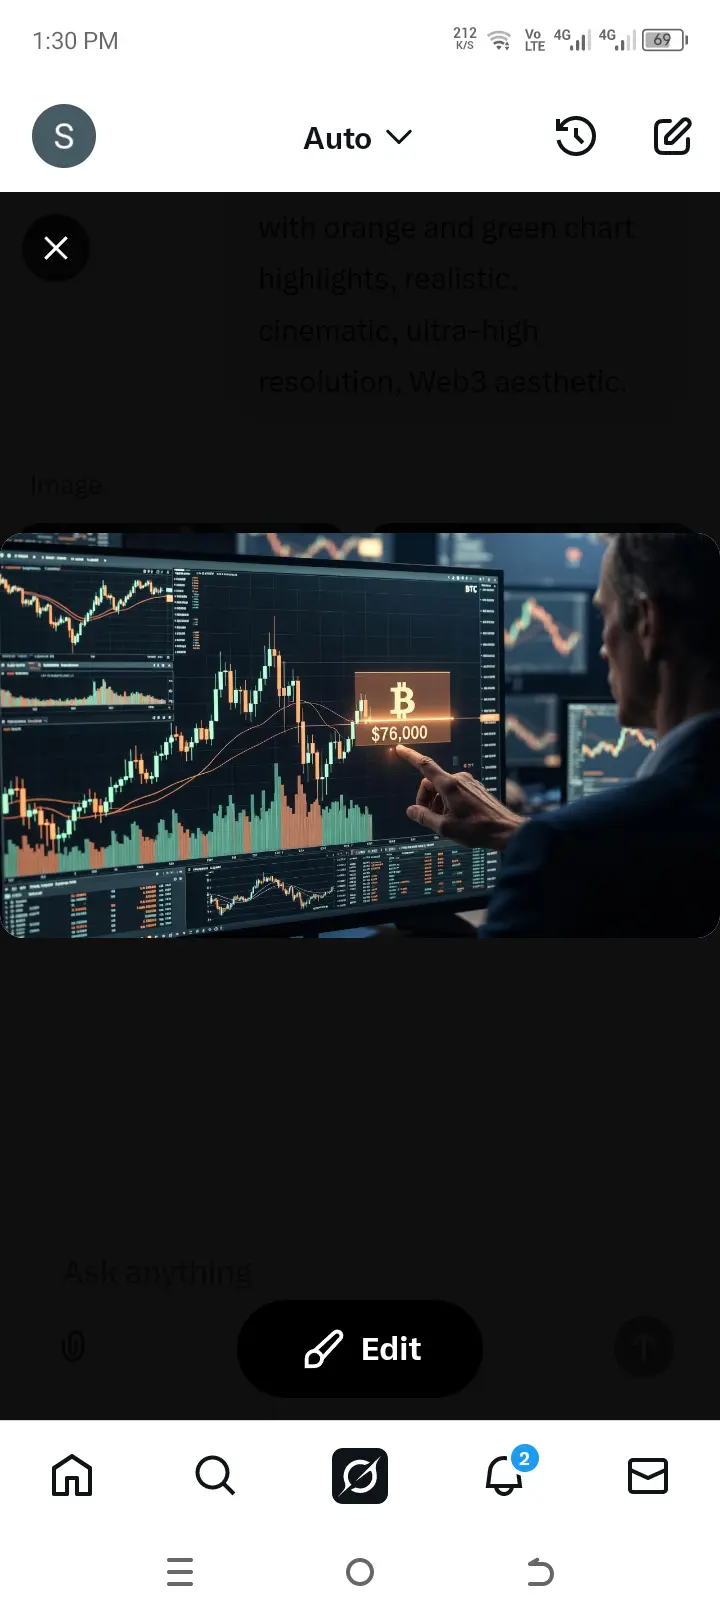
⚡ BTC Tests $76K — Pullback or Warning?
BTC recently tested the $76K area, a zone with heavy trading activity. Traders are asking: is this a technical pullback or an early warning signal?
Key Points to Watch:
• Support Levels: Look for $74K–$75K as near-term support zones
• Resistance: $76K–$77K remains key — multiple rejections may signal hesitation
• Volume & Momentum: Rising volume with failed breakouts may indicate risk-off sentiment
• On-Chain Signals: Watch whale activity and capital flow for clues
Takeaway:
BTC is at a critical decision point — a controlled pullback c
BTC2,74%
- Reward
- 1
- 3
- Repost
- Share
Yusfirah :
:
Happy New Year! 🤑View More
#BTCKeyLevelBreak 🚨📉 | Structure Just Shifted… Now What?
Bitcoin has officially broken a key technical level — and this isn’t just another random dip. When major support zones crack, market structure changes ⚠️
BTC slipped below a critical demand area that had been acting as short-term protection 🛡️. Once that level gave way, sell pressure accelerated and liquidity below got swept fast 💥. That’s how crypto works — it hunts stops before choosing direction.
📊 What this break tells us: • Buyers failed to defend the previous higher-low structure
• Short-term momentum flipped bearish 🔻
• Liqu
BTC2,74%
- Reward
- 7
- 15
- Repost
- Share
MoonGirl:
2026 GOGOGO 👊View More
#BTCKeyLevelBreak Bitcoin is currently trading near a critical decision zone after a strong recovery move, with price pressing into multi-timeframe resistance levels. Market conditions remain highly reactive, as sentiment stays deeply cautious and volatility elevated. The Fear & Greed Index remains in the extreme fear zone, a backdrop that often amplifies price reactions and increases the probability of sharp intraday moves in both directions.
From a price-structure perspective, BTC is positioned close to resistance across lower, intraday, and higher timeframes. This alignment suggests the mar
From a price-structure perspective, BTC is positioned close to resistance across lower, intraday, and higher timeframes. This alignment suggests the mar
BTC2,74%

- Reward
- 7
- 6
- Repost
- Share
xxx40xxx:
2026 GOGOGO 👊View More
#BTCKeyLevelBreak
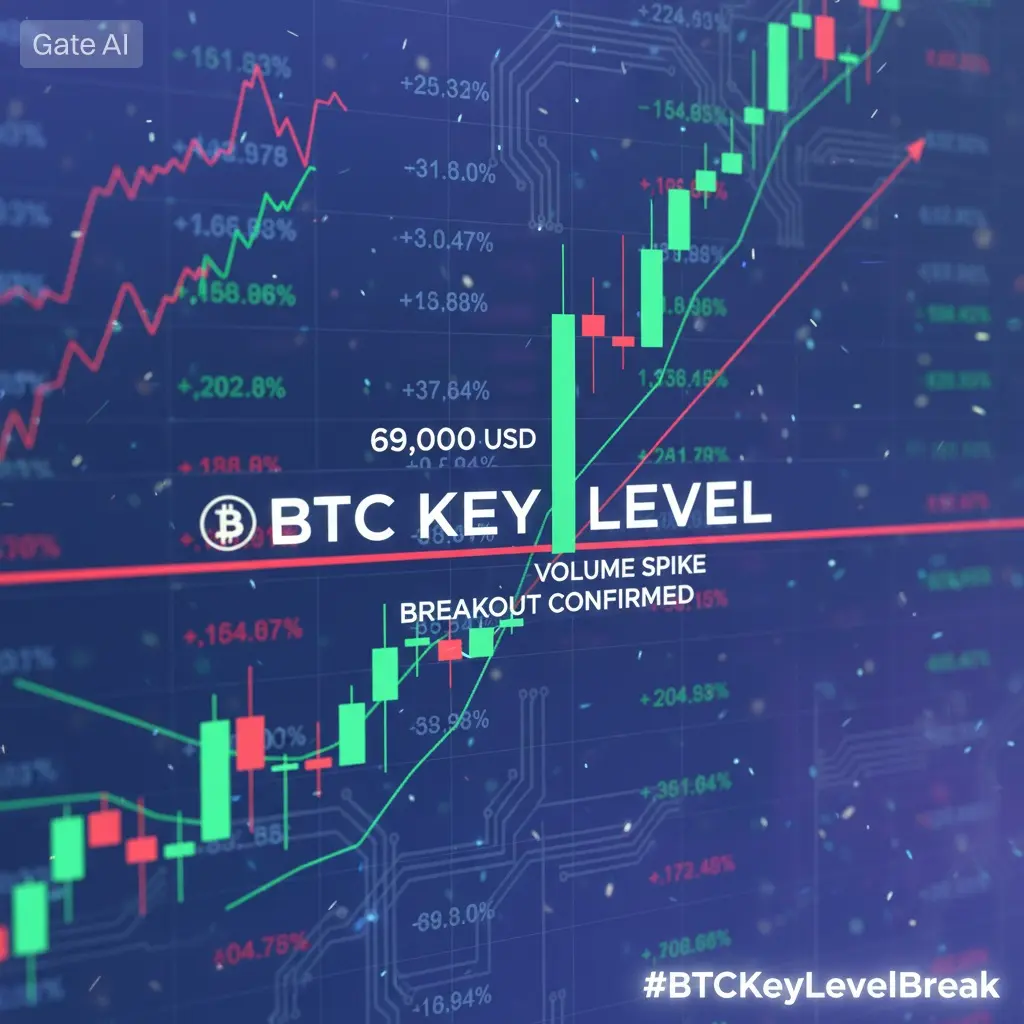
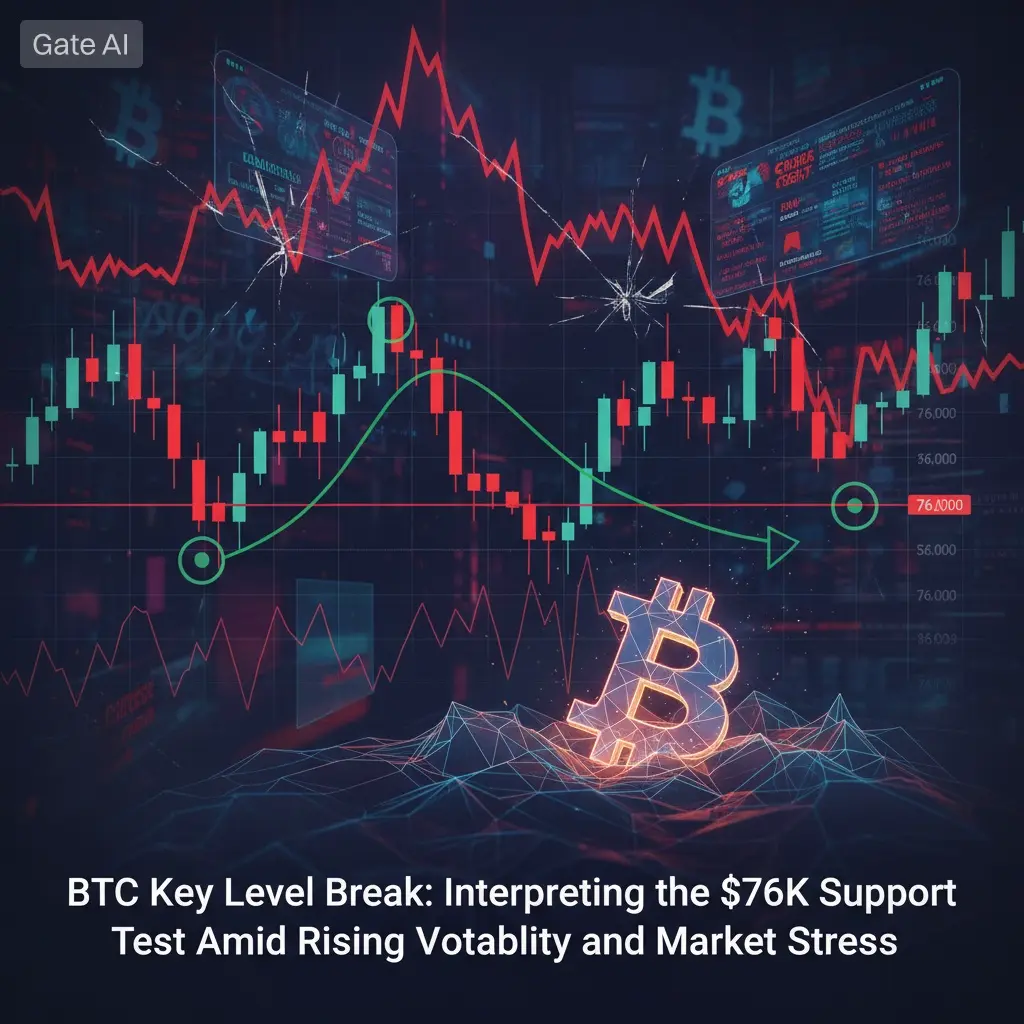
BTC Key Level Break: Interpreting the $76K Support Test Amid Rising Volatility and Market Stress
Bitcoin’s recent testing of the $76,000 region, an area loaded with heavy trading activity and historical significance, has become one of the most closely watched developments in crypto markets. This level has acted as both support and a magnet for liquidity over the past several months, and the price action around it right now is signaling more than a routine pullback. Bitcoin slid sharply to this zone amid broader market stress, hitting its weakest levels since earlier in 2025
BTC2,74%
- Reward
- 7
- 11
- Repost
- Share
repanzal:
HODL Tight 💪View More
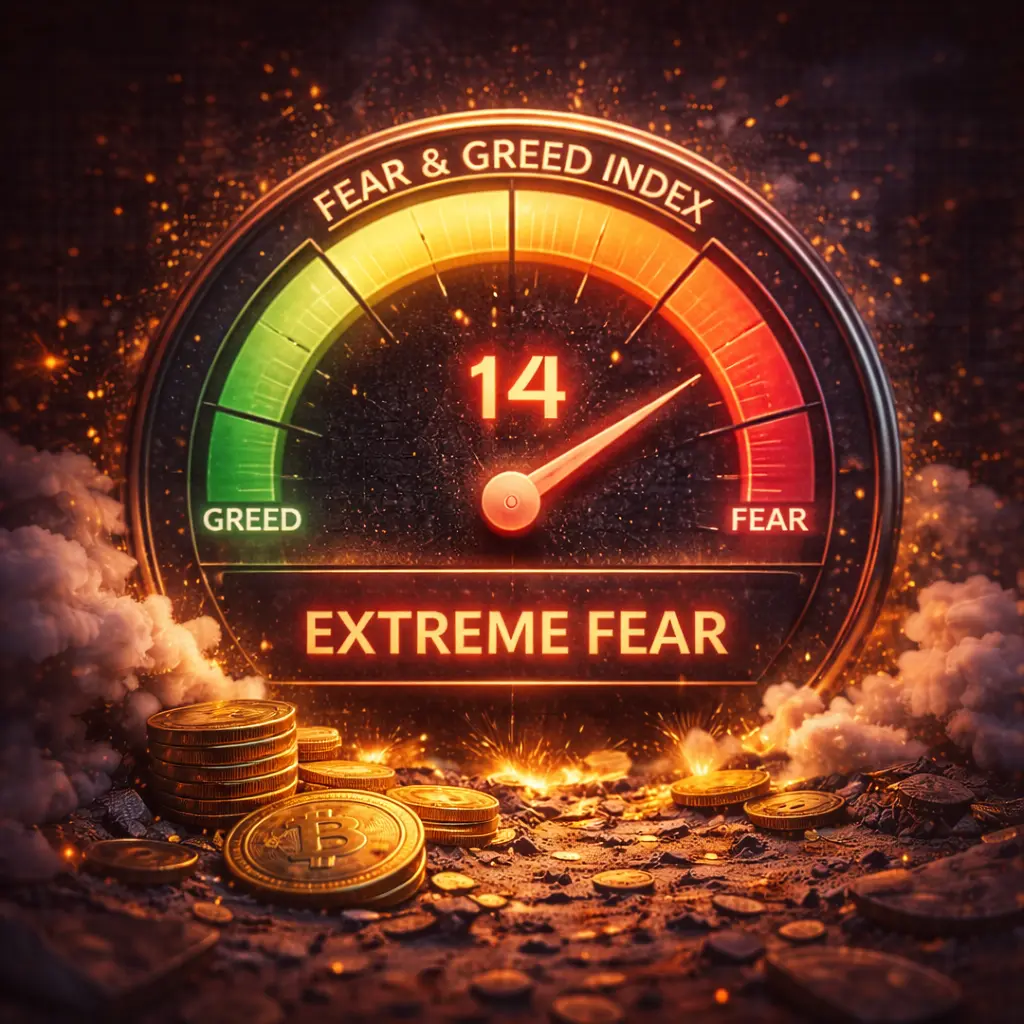
Fear & Greed Index Hits 14 - Extreme Fear Territory
😨 Market Sentiment at Lowest Level of 2026
The Crypto Fear & Greed Index plunged to 14 on January 30 and remains in "extreme fear" territory at 16. This is the lowest reading of 2026.
What This Index Measures:
It tracks sentiment across social media, trading volume, market volatility, and surveys. When it hits "extreme fear" (below 20), it often signals a bottom is near.
Why This Is Bullish (Contrarian):
Markets don't bottom when everyone is optimistic—they bottom when everyone has given up. When fear is this extreme:
- Retail investors are
BTC2,74%
- Reward
- 4
- 1
- Repost
- Share
Thynk:
2026 GOGOGO 👊#BTCKeyLevelBreak
Multi-Timeframe Technical Table
🧭 Market Context
Bitcoin (BTC) is currently trading near critical resistance zones following a strong recovery phase. Market sentiment remains cautious, with the Fear & Greed Index at 14 (Extreme Fear), signaling elevated volatility and emotionally driven price behavior.
📈 Price Overview
Metric
Value
Current Price
78,804.60 USDT
Market Sentiment
Extreme Fear (14)
Market State
High Volatility / Decision Zone
🧱 Key Levels by Timeframe
Timeframe
Support (USDT)
Resistance (USDT)
Price Position*
15 Min
77,629.83
79,164.27
76.6%
1 Hour
76,531.70
BTC2,74%

- Reward
- 17
- 22
- Repost
- Share
xxx40xxx:
"BTC is stuck in the resistance zone — do you think it's more strategic to monitor or to wait?"View More
Load More
Join 40M users in our growing community
⚡️ Join 40M users in the crypto craze discussion
💬 Engage with your favorite top creators
👍 See what interests you
Trending Topics
7.34K Popularity
5.36K Popularity
4.17K Popularity
279 Popularity
1.29K Popularity
2.47K Popularity
15.86K Popularity
14.1K Popularity
10.38K Popularity
11.6K Popularity
9.41K Popularity
2.62K Popularity
85 Popularity
29.42K Popularity
222.05K Popularity
News
View MoreBTC breaks through 79,000 USDT
2 m
Bitunix Analyst: Non-farm payroll data delayed, combined with weak manufacturing, puts pressure on risk assets, and the crypto market continues to be in a deleveraging environment.
4 m
Moonbirds(BIRB) will be officially launched on the Gate Instant Swap platform on February 3rd
5 m
Data: In the past 24 hours, the entire network has been liquidated by $313 million, with long positions liquidated by $107 million and short positions liquidated by $206 million.
7 m
Spot gold breaks through $4940 per ounce, rising 5.99% intraday, marking the largest single-day increase since November 2008.
13 m
Pin