


#ETHLongShortBattle Ethereum Market Structure — Compression Before Expansion (Updated Feb 2026)
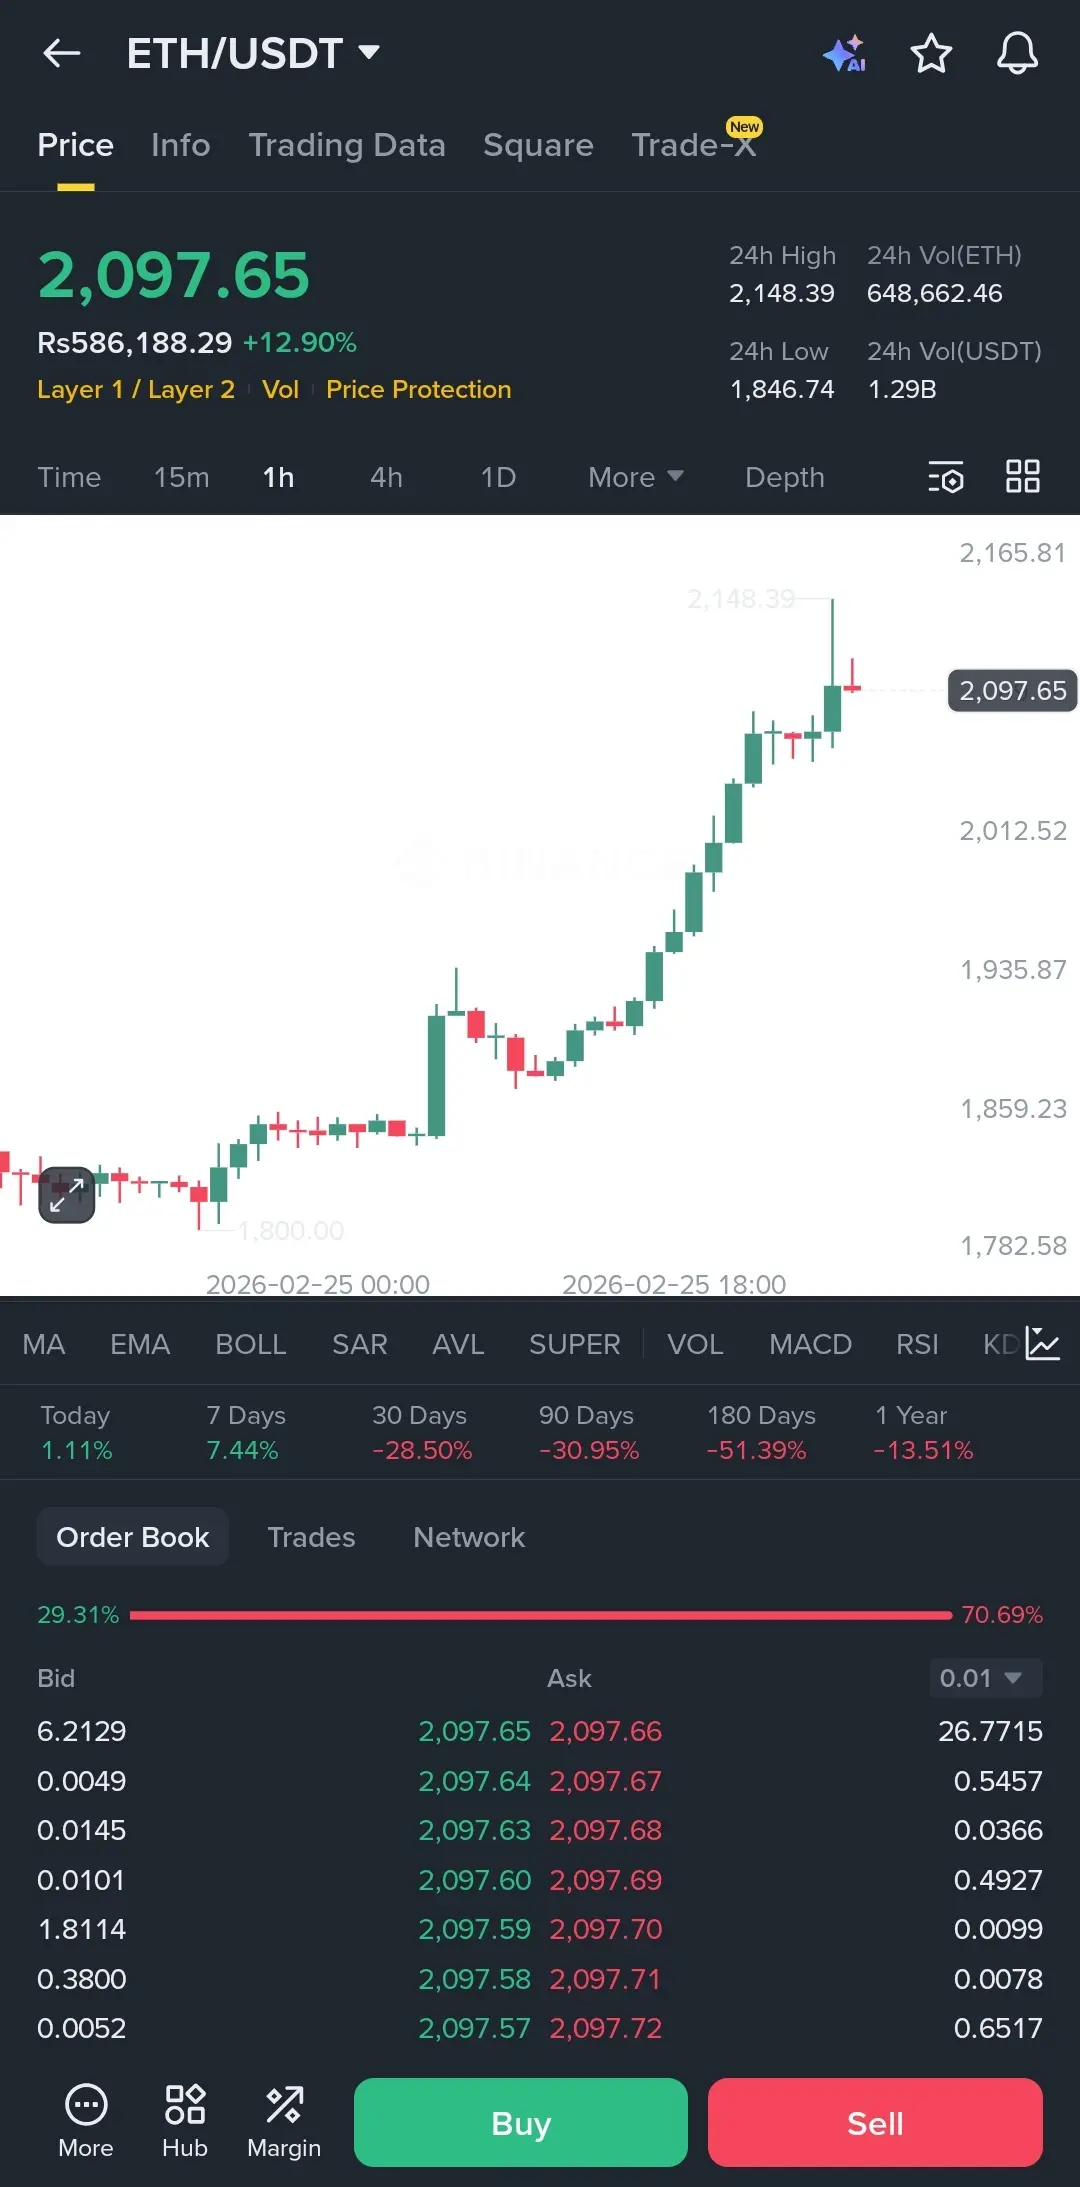
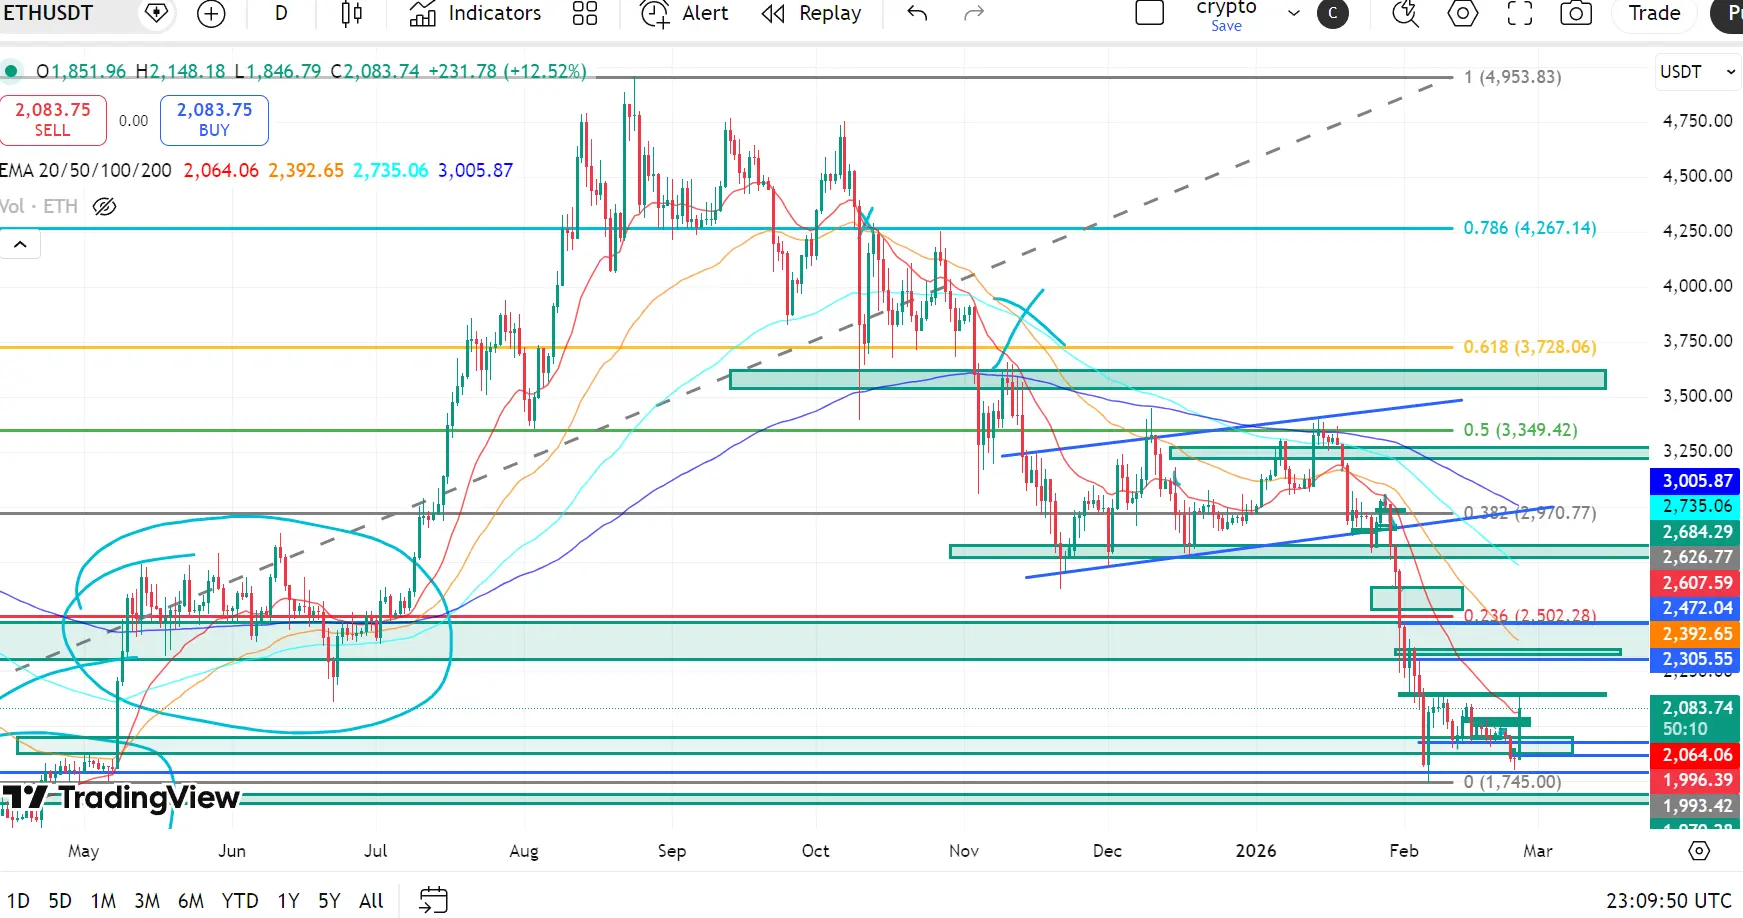
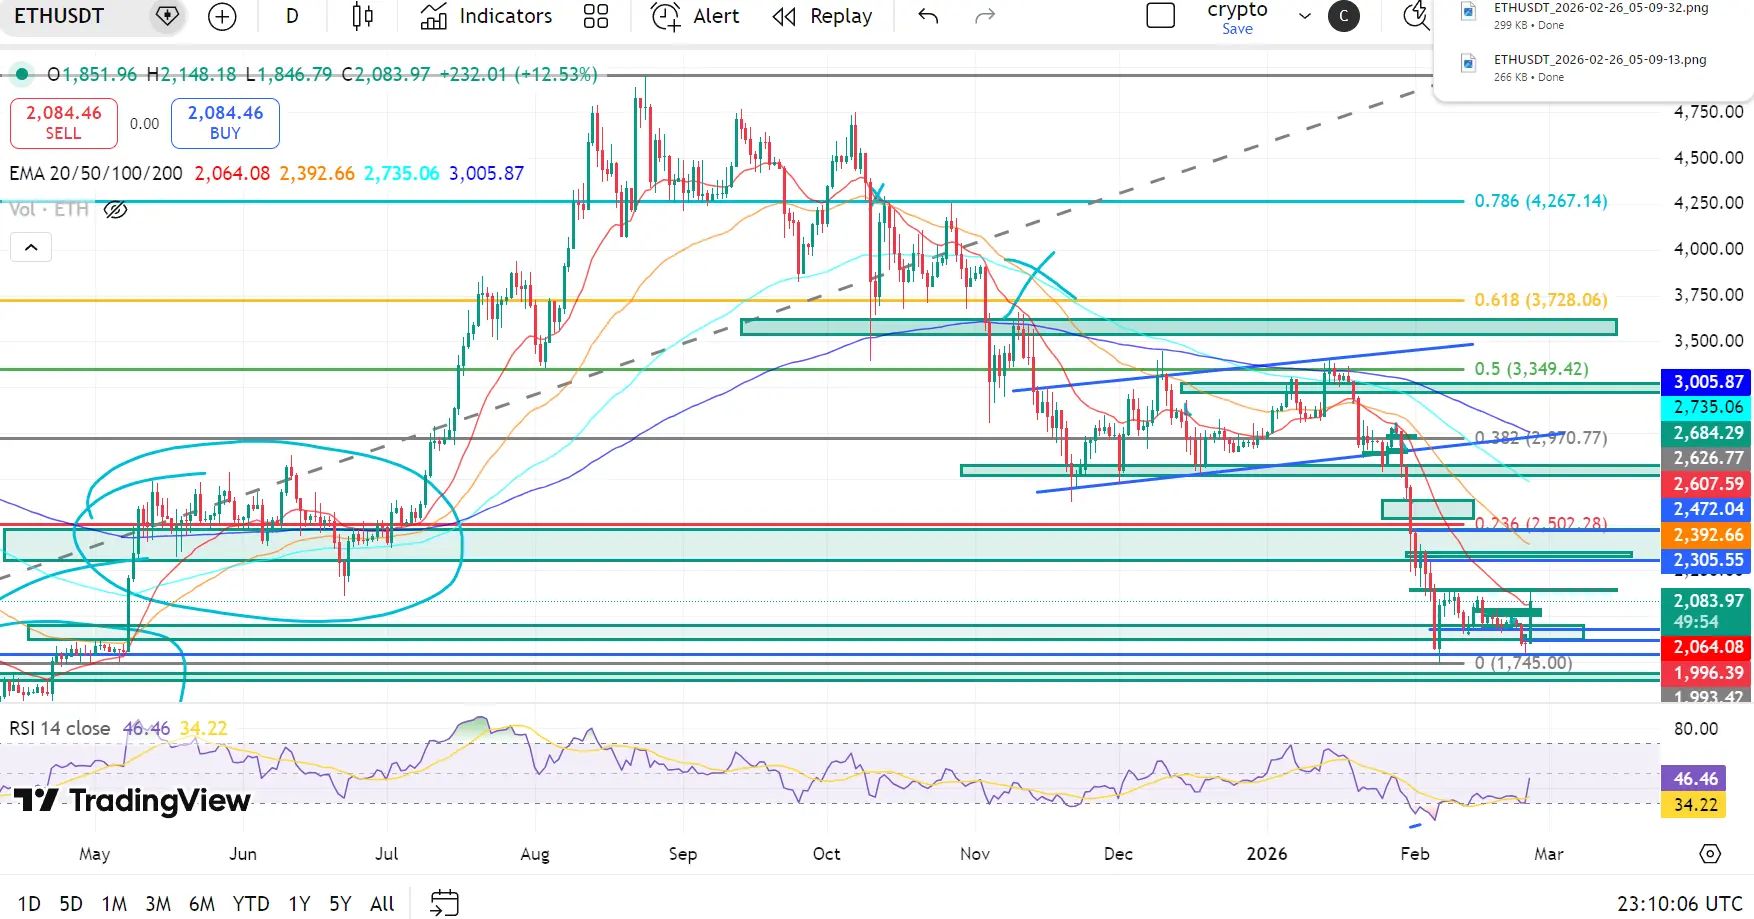
Ethereum is not simply ranging — it is sitting inside a high-tension technical zone where volatility is compressing and both supply and demand are coiling for a potential breakout or breakdown. Price behavior has recently been oscillating around the psychologically important $1,900–$2,000 region, and broader crypto sentiment has remained fragile under macro uncertainty.
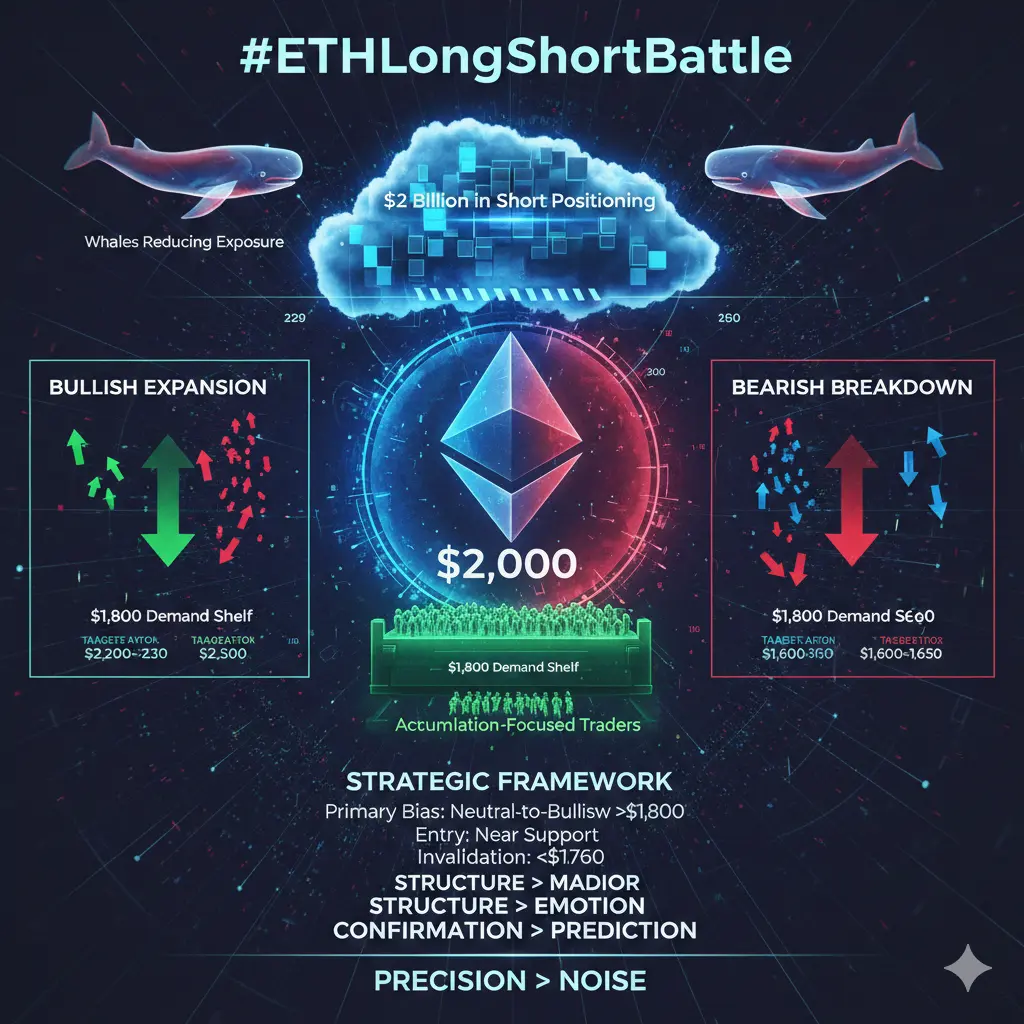
This compression near the $2,000 level is important because round numbers tend to act as liquidity magnets in derivatives markets. When price stabilizes around such zones, stop orders and leveraged positioning often cluster on both sides, increasing the probability of a sharp expansion once imbalance resolves.
Liquidity, Positioning & Market Behavior
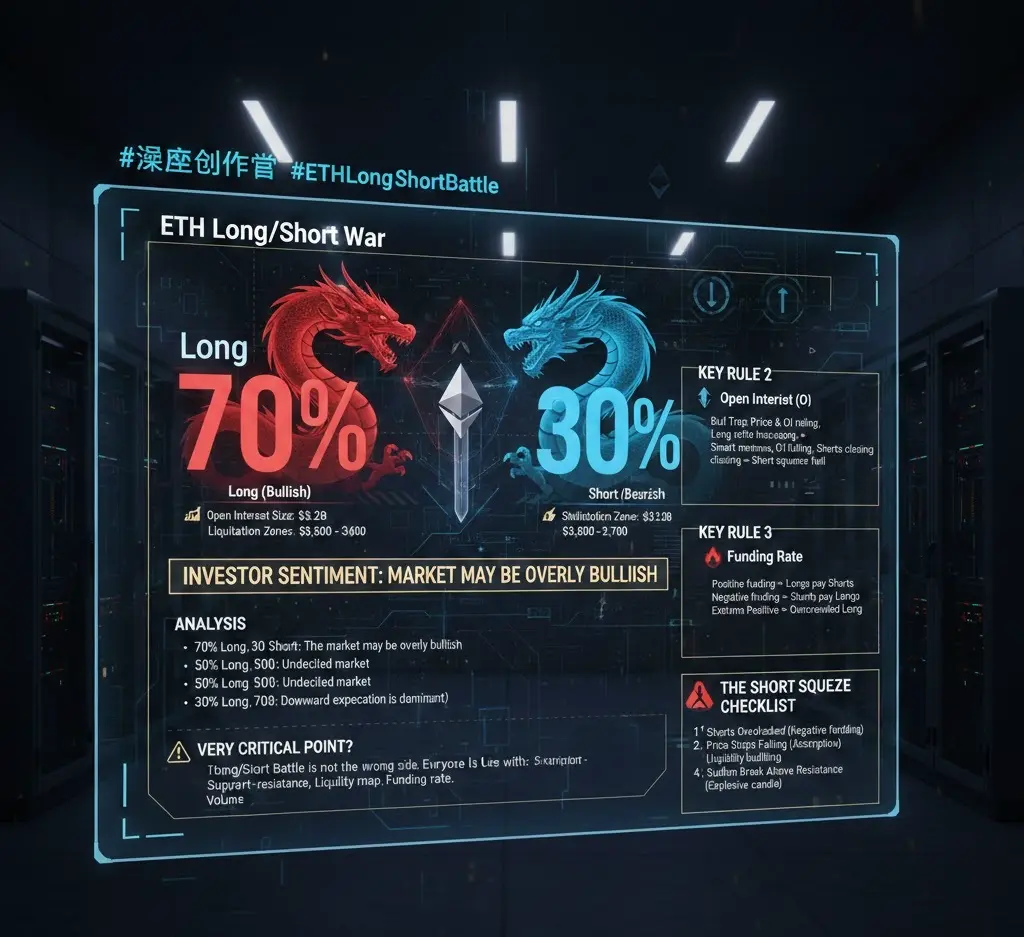
The current structure shows a divergence between large capital positioning and smaller conviction-style accumulation flows. Some large holders appear to be trimming exposure or hedging risk rather than aggressively distributing assets, while accumulation-focused participants continue defending lower demand zones.
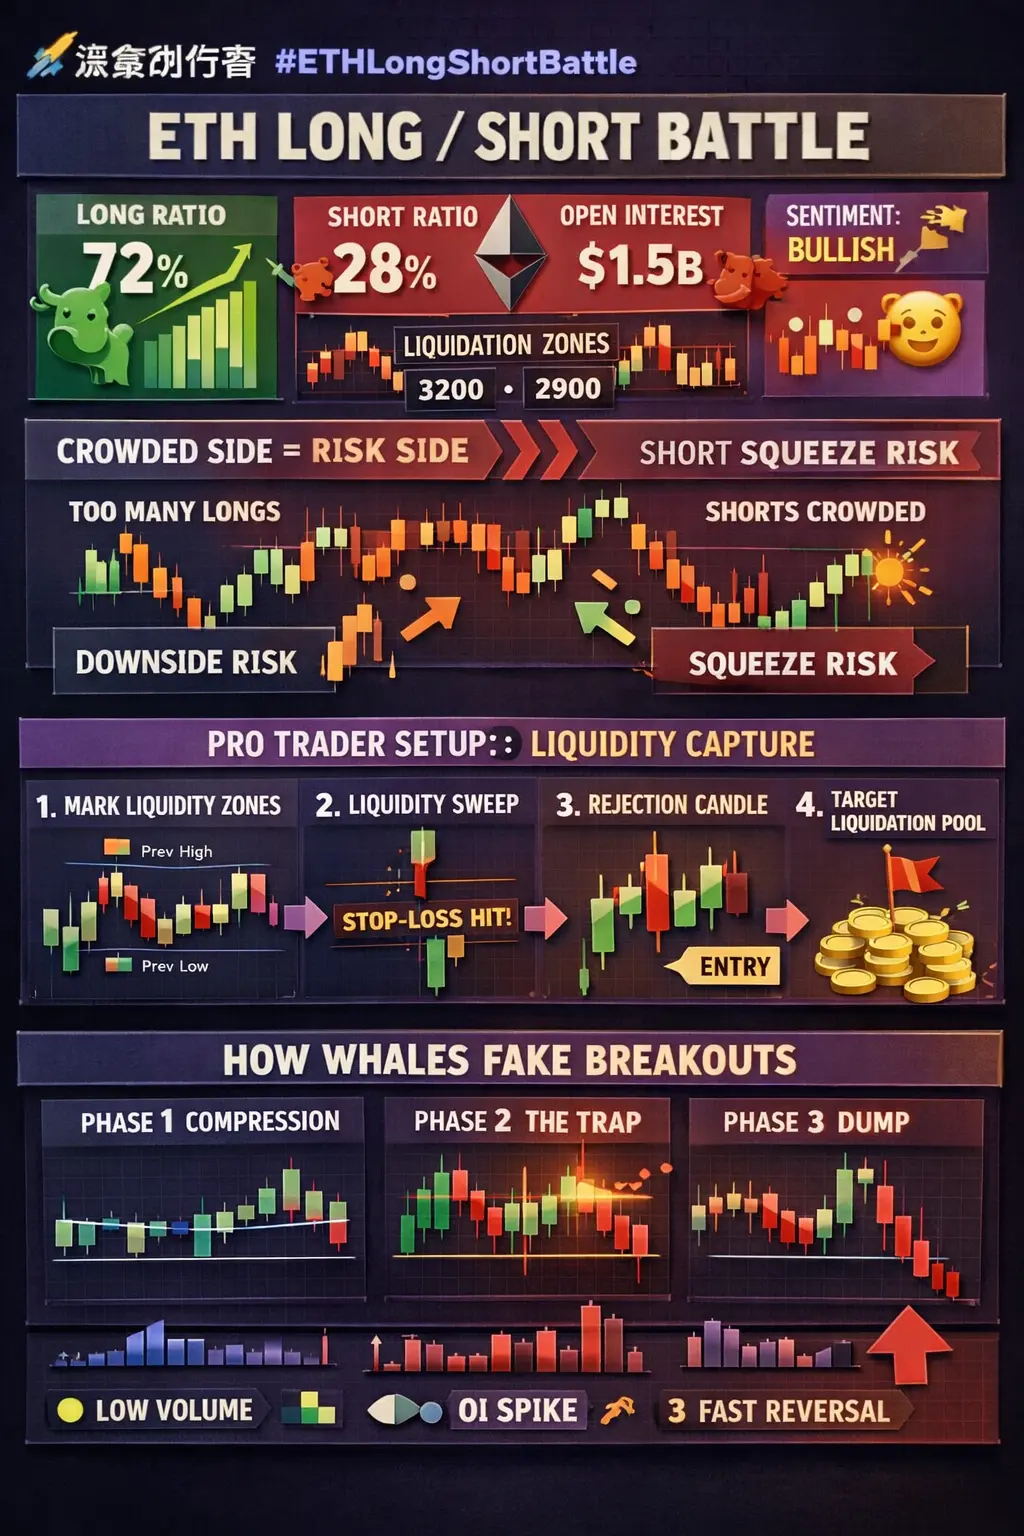
Liquidity stacking is visible above price near resistance clusters, while stop-loss liquidity is believed to be concentrated below support levels. This setup creates a pressure environment where breakout moves are often driven more by forced position adjustments than organic retail momentum.
Exchange flow patterns have also shown signs of cooling selling pressure. Outflow strength that was seen during earlier bullish phases has moderated, suggesting that aggressive panic selling is not dominating current market behavior.
Key Structural Zones to Watch
Liquidity Resistance Zone — $2,000 to $2,050
This is the most critical short-term battlefield. A strong daily close above this region with expanding volume could trigger short-covering cascades and momentum chasing from systematic traders.
If derivatives funding flips strongly positive and bullish positioning accelerates, momentum extensions could push price toward $2,200–$2,300 initially, with volatility overshoots potentially reaching higher extension targets near $2,500 under extreme squeeze conditions.
Demand Defense Zone — $1,800 to $1,850
This area has repeatedly attracted buyers and is acting as a structural floor rather than a temporary bounce point.
As long as price holds above this shelf on meaningful volume, short-term order flow slightly favors bullish stabilization. However, conviction must be confirmed through price structure — not assumed based on historical defense alone.
Scenario Mapping
Bullish Expansion Scenario
Reclaim and sustain above $2,000
Short positioning begins unwinding
Forced liquidation cascade fuels upside momentum
Targets: $2,200 → $2,300 → volatility extension beyond $2,500
In this case, scaling out profits into strength is usually safer than holding full exposure into euphoric spikes.
Bearish Breakdown Scenario
Failure to reclaim $2,000 resistance
Loss of $1,800–$1,780 support with heavy volume
Downside liquidity pocket opens near $1,600–$1,650
If this happens, long liquidation pressure may accelerate price decline velocity.
Whales vs Accumulation Capital
Reduction in whale exposure does not automatically mean bearish distribution. Large capital often hedges risk rather than exiting positions completely.
More important is the behavior near structural support. If accumulation continues around the $1,800 zone while exchange inflows stay muted, it suggests positioning rather than capitulation.
Strategic Bias Under Current Structure
Primary outlook: Neutral-to-slightly bullish while $1,800 holds
Entry philosophy: Prefer scaling near defended support zones rather than chasing breakouts
Invalidation level: Clean breakdown below $1,780–$1,760
Short-term upside cluster: $2,000–$2,050
Momentum extension zone: Above $2,250 if short covering intensifies
Trading Philosophy Reminder
Markets reward patience and structural positioning, not impulsive entries. When liquidity builds on both sides of price, the eventual breakout is often sharp but requires confirmation.
This is a phase where precision matters more than noise. Structure should dominate emotion, and confirmation should always precede aggressive conviction.
Ethereum is not simply ranging — it is sitting inside a high-tension technical zone where volatility is compressing and both supply and demand are coiling for a potential breakout or breakdown. Price behavior has recently been oscillating around the psychologically important $1,900–$2,000 region, and broader crypto sentiment has remained fragile under macro uncertainty.
This compression near the $2,000 level is important because round numbers tend to act as liquidity magnets in derivatives markets. When price stabilizes around such zones, stop orders and leveraged positioning often cluster on both sides, increasing the probability of a sharp expansion once imbalance resolves.
Liquidity, Positioning & Market Behavior
The current structure shows a divergence between large capital positioning and smaller conviction-style accumulation flows. Some large holders appear to be trimming exposure or hedging risk rather than aggressively distributing assets, while accumulation-focused participants continue defending lower demand zones.
Liquidity stacking is visible above price near resistance clusters, while stop-loss liquidity is believed to be concentrated below support levels. This setup creates a pressure environment where breakout moves are often driven more by forced position adjustments than organic retail momentum.
Exchange flow patterns have also shown signs of cooling selling pressure. Outflow strength that was seen during earlier bullish phases has moderated, suggesting that aggressive panic selling is not dominating current market behavior.
Key Structural Zones to Watch
Liquidity Resistance Zone — $2,000 to $2,050
This is the most critical short-term battlefield. A strong daily close above this region with expanding volume could trigger short-covering cascades and momentum chasing from systematic traders.
If derivatives funding flips strongly positive and bullish positioning accelerates, momentum extensions could push price toward $2,200–$2,300 initially, with volatility overshoots potentially reaching higher extension targets near $2,500 under extreme squeeze conditions.
Demand Defense Zone — $1,800 to $1,850
This area has repeatedly attracted buyers and is acting as a structural floor rather than a temporary bounce point.
As long as price holds above this shelf on meaningful volume, short-term order flow slightly favors bullish stabilization. However, conviction must be confirmed through price structure — not assumed based on historical defense alone.
Scenario Mapping
Bullish Expansion Scenario
Reclaim and sustain above $2,000
Short positioning begins unwinding
Forced liquidation cascade fuels upside momentum
Targets: $2,200 → $2,300 → volatility extension beyond $2,500
In this case, scaling out profits into strength is usually safer than holding full exposure into euphoric spikes.
Bearish Breakdown Scenario
Failure to reclaim $2,000 resistance
Loss of $1,800–$1,780 support with heavy volume
Downside liquidity pocket opens near $1,600–$1,650
If this happens, long liquidation pressure may accelerate price decline velocity.
Whales vs Accumulation Capital
Reduction in whale exposure does not automatically mean bearish distribution. Large capital often hedges risk rather than exiting positions completely.
More important is the behavior near structural support. If accumulation continues around the $1,800 zone while exchange inflows stay muted, it suggests positioning rather than capitulation.
Strategic Bias Under Current Structure
Primary outlook: Neutral-to-slightly bullish while $1,800 holds
Entry philosophy: Prefer scaling near defended support zones rather than chasing breakouts
Invalidation level: Clean breakdown below $1,780–$1,760
Short-term upside cluster: $2,000–$2,050
Momentum extension zone: Above $2,250 if short covering intensifies
Trading Philosophy Reminder
Markets reward patience and structural positioning, not impulsive entries. When liquidity builds on both sides of price, the eventual breakout is often sharp but requires confirmation.
This is a phase where precision matters more than noise. Structure should dominate emotion, and confirmation should always precede aggressive conviction.