Trade
Basic
Futures
Futures
Hundreds of contracts settled in USDT or BTC
TradFi
Gold
Trade global traditional assets with USDT in one place
Options
Hot
Trade European-style vanilla options
Unified Account
Maximize your capital efficiency
Demo Trading
Futures Kickoff
Get prepared for your futures trading
Futures Events
Participate in events to win generous rewards
Demo Trading
Use virtual funds to experience risk-free trading
Earn
Launch
CandyDrop
Collect candies to earn airdrops
Launchpool
Quick staking, earn potential new tokens
HODLer Airdrop
Hold GT and get massive airdrops for free
Launchpad
Be early to the next big token project
Alpha Points
Trade on-chain assets and enjoy airdrop rewards!
Futures Points
Earn futures points and claim airdrop rewards
Investment
Simple Earn
Earn interests with idle tokens
Auto-Invest
Auto-invest on a regular basis
Dual Investment
Buy low and sell high to take profits from price fluctuations
Soft Staking
Earn rewards with flexible staking
Crypto Loan
0 Fees
Pledge one crypto to borrow another
Lending Center
One-stop lending hub
VIP Wealth Hub
Customized wealth management empowers your assets growth
Private Wealth Management
Customized asset management to grow your digital assets
Quant Fund
Top asset management team helps you profit without hassle
Staking
Stake cryptos to earn in PoS products
Smart Leverage
New
No forced liquidation before maturity, worry-free leveraged gains
GUSD Minting
Use USDT/USDC to mint GUSD for treasury-level yields
More
# SmartmoneyconceptsSMC
1.37K
Lions_Lionish
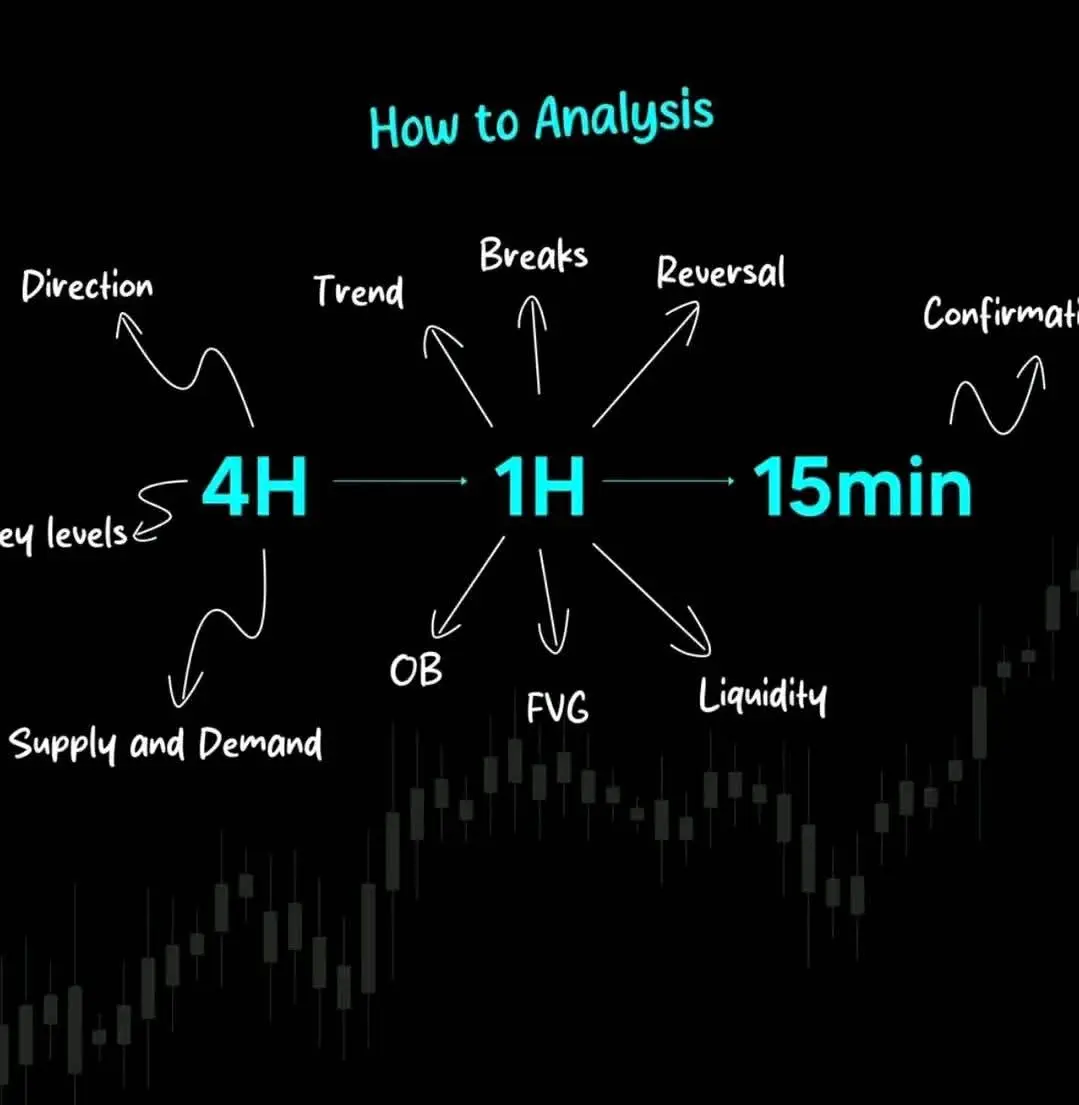
📊 How to Use Multi-Timeframe Analysis
Trading works best when you assign each timeframe a role instead of staring at one chart blindly.
🟡4H chart gives you direction, key levels, and supply and demand.
This is your bigger picture map.
🟡1H chart shows structure: breaks, reversals, order blocks, and fair value gaps.
This is where momentum shifts become visible.
🟡15m chart provides timing: liquidity grabs and confirmations to execute precise entries.
The flow is simple: context from 4H, structure from 1H, precision from 15m. Skip one, and you either miss the bigger picture or mistime the mo
- Reward
- 1
- Comment
- Repost
- Share
Load More
Join 40M users in our growing community
⚡️ Join 40M users in the crypto craze discussion
💬 Engage with your favorite top creators
👍 See what interests you
Trending Topics
355.7K Popularity
21.44K Popularity
62.99K Popularity
15.4K Popularity
465.32K Popularity
3.75K Popularity
3.49K Popularity
1.84K Popularity
1.11K Popularity
80.6K Popularity
42.16K Popularity
96.88K Popularity
14.42K Popularity
102.09K Popularity
2.82K Popularity
News
View MoreLobster increased by 872.32% after launching Alpha, current price 0.0018772 USDT
22 m
Data: If BTC breaks through $68,773, the total liquidation strength of mainstream CEX short positions will reach $1.759 billion.
1 h
Data: If ETH breaks through $2,020, the total liquidation strength of short positions on mainstream CEXs will reach $758 million.
1 h
Traditional Finance Alert: NFLX Surges Over 12%
2 h
Lobster rose by 620.27% after going live on Alpha; current price is 0.0013907 USDT
2 h
Pin