Trade
Basic
Futures
Futures
Hundreds of contracts settled in USDT or BTC
Options
HOT
Trade European-style vanilla options
Unified Account
Maximize your capital efficiency
Demo Trading
Futures Kickoff
Get prepared for your futures trading
Futures Events
Participate in events to win generous rewards
Demo Trading
Use virtual funds to experience risk-free trading
Earn
Launch
CandyDrop
Collect candies to earn airdrops
Launchpool
Quick staking, earn potential new tokens
HODLer Airdrop
Hold GT and get massive airdrops for free
Launchpad
Be early to the next big token project
Alpha Points
NEW
Trade on-chain assets and enjoy airdrop rewards!
Futures Points
NEW
Earn futures points and claim airdrop rewards
Investment
Simple Earn
Earn interests with idle tokens
Auto-Invest
Auto-invest on a regular basis
Dual Investment
Buy low and sell high to take profits from price fluctuations
Soft Staking
Earn rewards with flexible staking
Crypto Loan
0 Fees
Pledge one crypto to borrow another
Lending Center
One-stop lending hub
VIP Wealth Hub
Customized wealth management empowers your assets growth
Private Wealth Management
Customized asset management to grow your digital assets
Quant Fund
Top asset management team helps you profit without hassle
Staking
Stake cryptos to earn in PoS products
Smart Leverage
NEW
No forced liquidation before maturity, worry-free leveraged gains
GUSD Minting
Use USDT/USDC to mint GUSD for treasury-level yields
More
云澈趋势论
No content yet
云澈趋势论
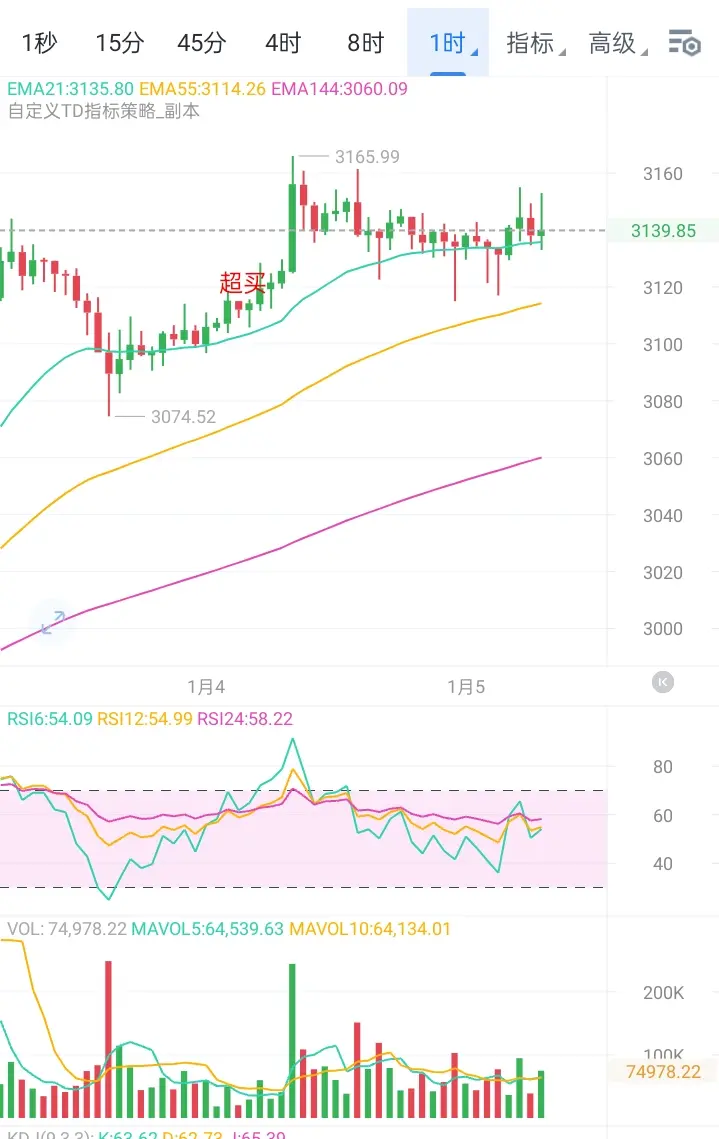
Based on the early morning market trend, Ethereum has been declining from 3200 to 3123 and then rebounded to around 3160. Although the overall movement aligns with the expected support zone of 3115-3125, the rebound strength is noticeably weak, and the technical structure remains dominated by a bearish trend.
Currently, the price is still under the pressure of the 4-hour bearish moving averages. The key resistance levels are in the 3175-3185 range. If a clear breakthrough cannot be achieved, the rebound is merely a technical correction within the downtrend. Attention should be paid to the shor
Currently, the price is still under the pressure of the 4-hour bearish moving averages. The key resistance levels are in the 3175-3185 range. If a clear breakthrough cannot be achieved, the rebound is merely a technical correction within the downtrend. Attention should be paid to the shor
ETH-3,52%
- Reward
- like
- Comment
- Repost
- Share
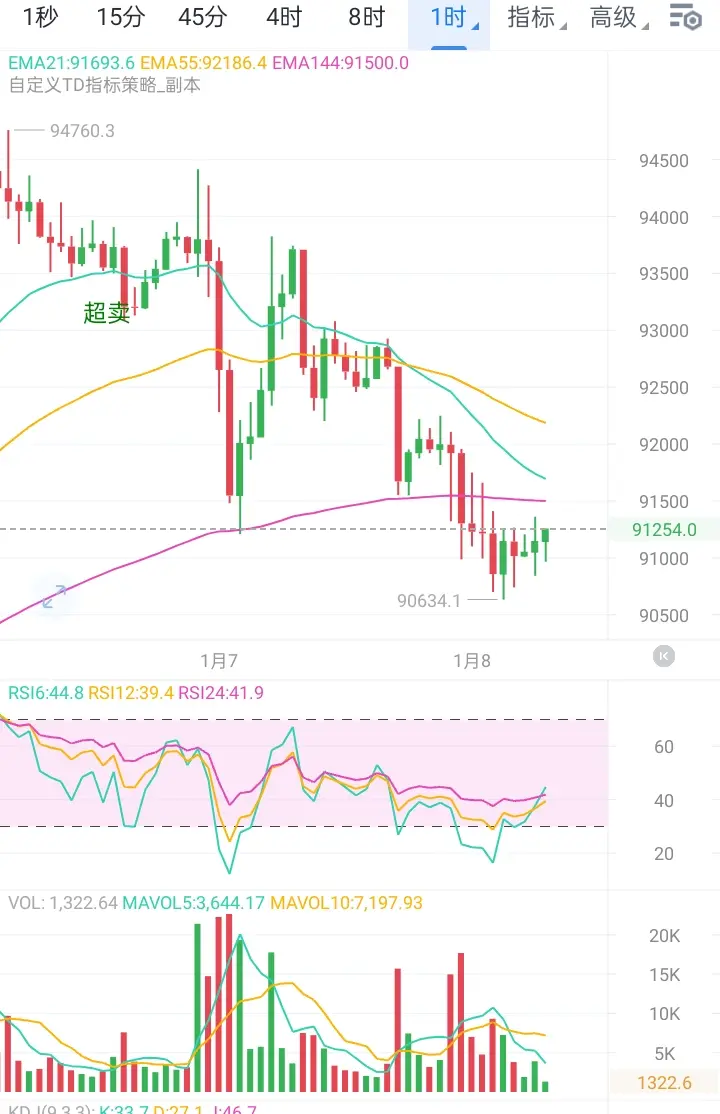
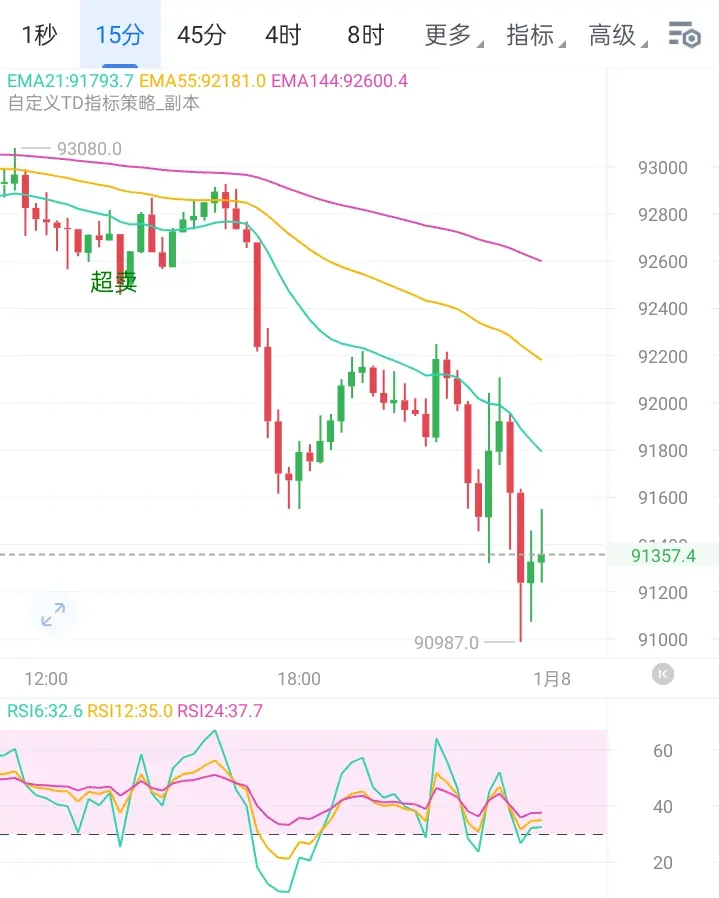
From a technical perspective, Bitcoin rebounded from the 90600 level to around 91300 but remains in a overall bearish trend. The current rebound strength is weak, with key resistance concentrated in the 91800-92000 area. If it cannot break through effectively, it is considered a technical correction during the decline, and the market is likely to face further downward pressure.
On the indicator level, the 4-hour moving average system shows a bearish alignment, RSI is below 50, and MACD remains below the zero line, indicating that bearish momentum still dominates. During the rebound, trading vo
On the indicator level, the 4-hour moving average system shows a bearish alignment, RSI is below 50, and MACD remains below the zero line, indicating that bearish momentum still dominates. During the rebound, trading vo
BTC-2,19%


- Reward
- like
- 1
- Repost
- Share
SiYu :
:
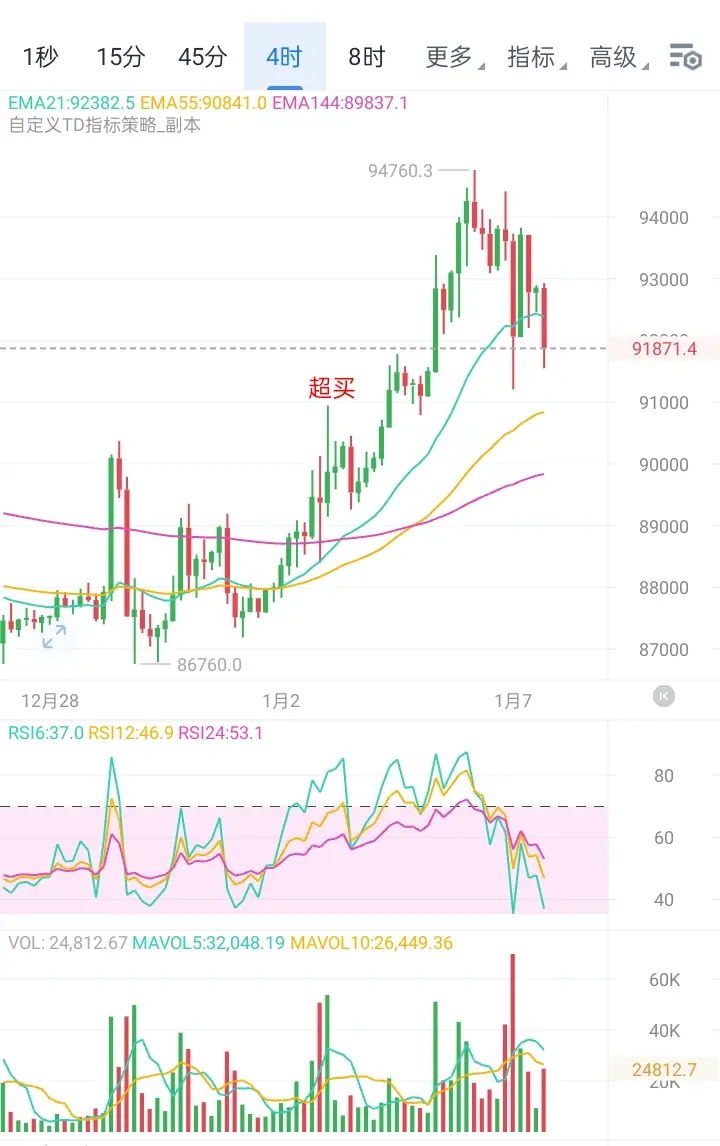
Thank you for sharing, precise analysis, wealth explosion in the New Year!!The evening market trend has already realized the bearish expectation, with Bitcoin smoothly falling from the key resistance level, gaining over 800 points of space. Ethereum followed suit, earning more than 40 points. The bearish trend has been effectively validated. Currently, the price is experiencing a technical rebound, but the overall structure remains within a downward channel dominated by bears. The rebound can be seen as an opportunity to re-enter short positions.
From the market perspective, this round of decline has effectively broken through the important intraday support zone and
From the market perspective, this round of decline has effectively broken through the important intraday support zone and
BTC-2,19%

- Reward
- 2
- 1
- Repost
- Share
Also10:
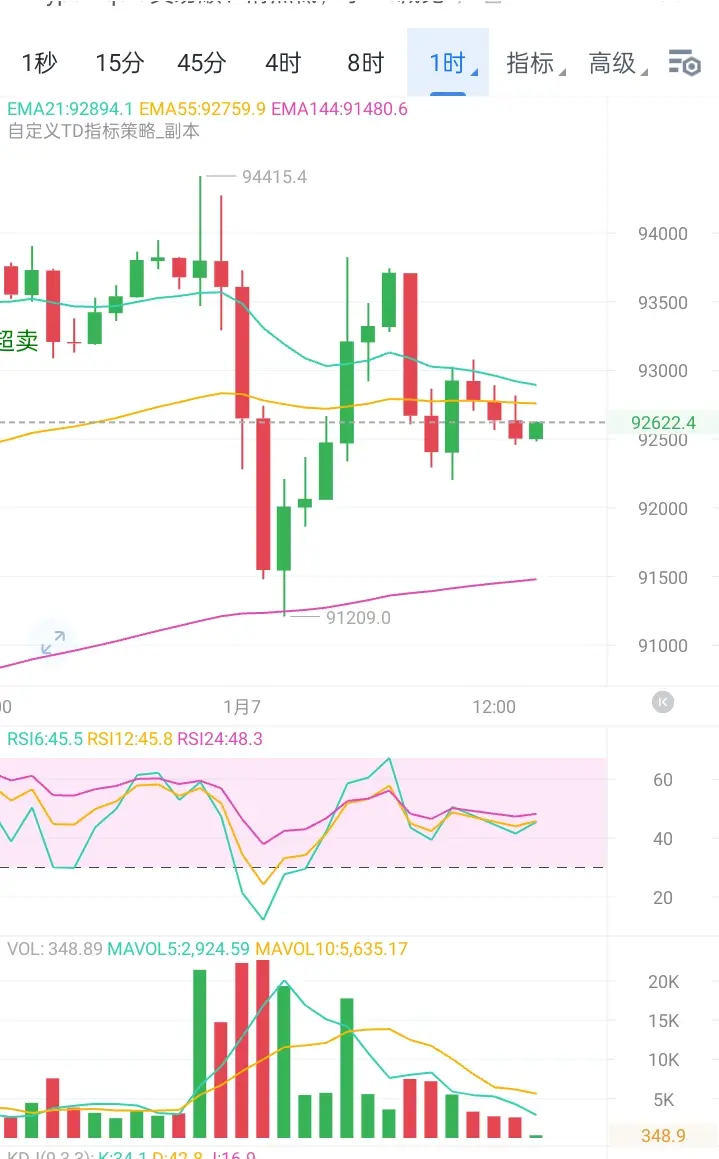
Happy New Year! 🤑Afternoon market shows that after failing to effectively stabilize above 93,000, Bitcoin encountered clear selling pressure again around 92,900. As the bearish momentum strengthens, the price not only broke below the key support of 92,000 emphasized earlier in the day but also briefly dipped to around 91,500. This downward move broke the short-term balance of "buying on dips," and the market structure has shifted to a bearish trend.
From a technical perspective, the price continuously broke through two important levels at 93,000 and 92,000, indicating that the bears have taken control of the m
From a technical perspective, the price continuously broke through two important levels at 93,000 and 92,000, indicating that the bears have taken control of the m
BTC-2,19%
- Reward
- like
- Comment
- Repost
- Share
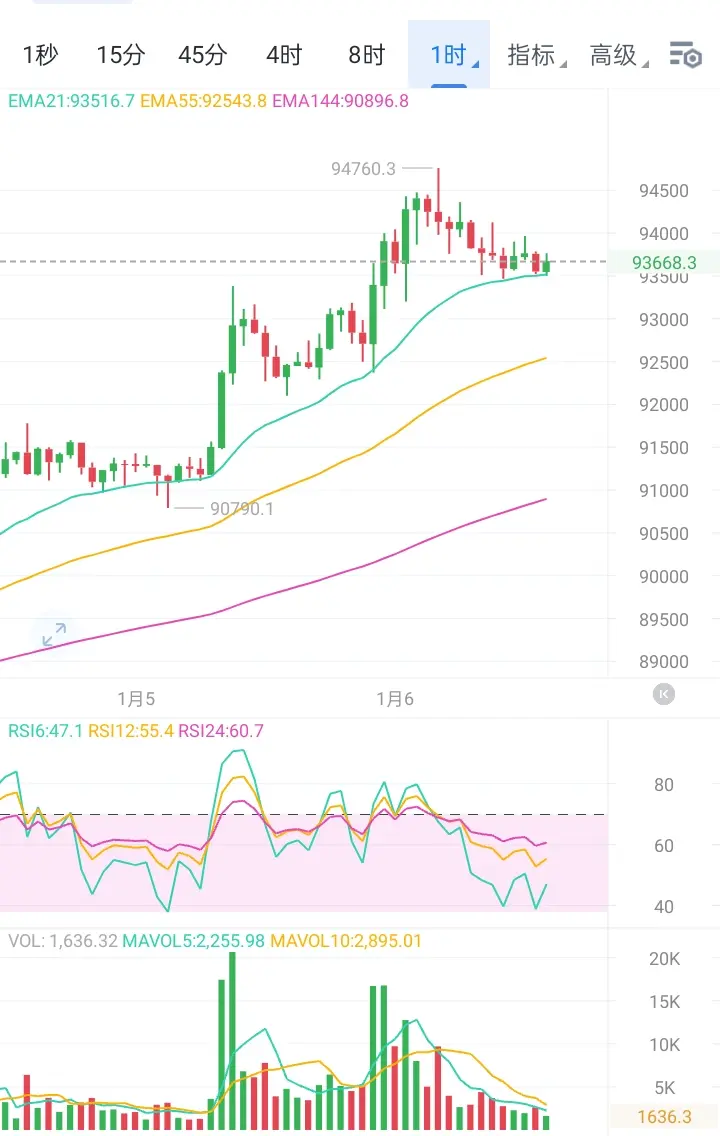
Although Bitcoin pulled back from the high of 93,850 after breaking out early in the morning, it remains stable above the key support area. The recent correction is mild, with no increase in trading volume, representing a healthy technical adjustment after a breakout. The overall upward structure remains intact.
The price found buying support around 92,000 and rebounded, confirming that this area, which was previously resistance, has now turned into effective support. Currently, the hourly indicators have been repaired, and market sentiment is leaning towards digesting selling pressure and con
The price found buying support around 92,000 and rebounded, confirming that this area, which was previously resistance, has now turned into effective support. Currently, the hourly indicators have been repaired, and market sentiment is leaning towards digesting selling pressure and con
BTC-2,19%
- Reward
- like
- Comment
- Repost
- Share
Early morning market continued to decline as expected, with BTC accelerating downward after effectively breaking through previous support levels, reaching a low of around $91,200. Subsequently, buying interest surged in, driving a strong rebound, and the price has now recovered to around $93,300. Our short positions initiated in the early morning successfully captured over 800 points of profit.
From the current technical structure, the price received strong buying support around $91,200, forming a clear bottoming and rebound pattern. On the 4-hour chart, after the candlesticks closed with long
From the current technical structure, the price received strong buying support around $91,200, forming a clear bottoming and rebound pattern. On the 4-hour chart, after the candlesticks closed with long
BTC-2,19%
- Reward
- 2
- Comment
- Repost
- Share
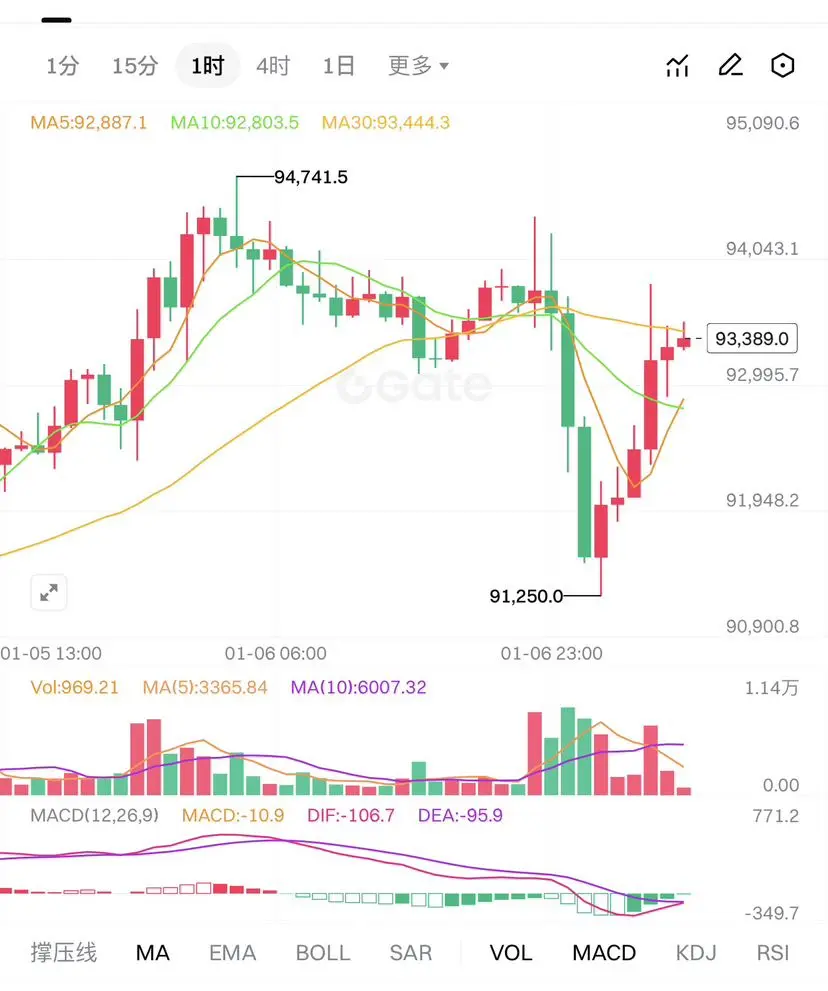
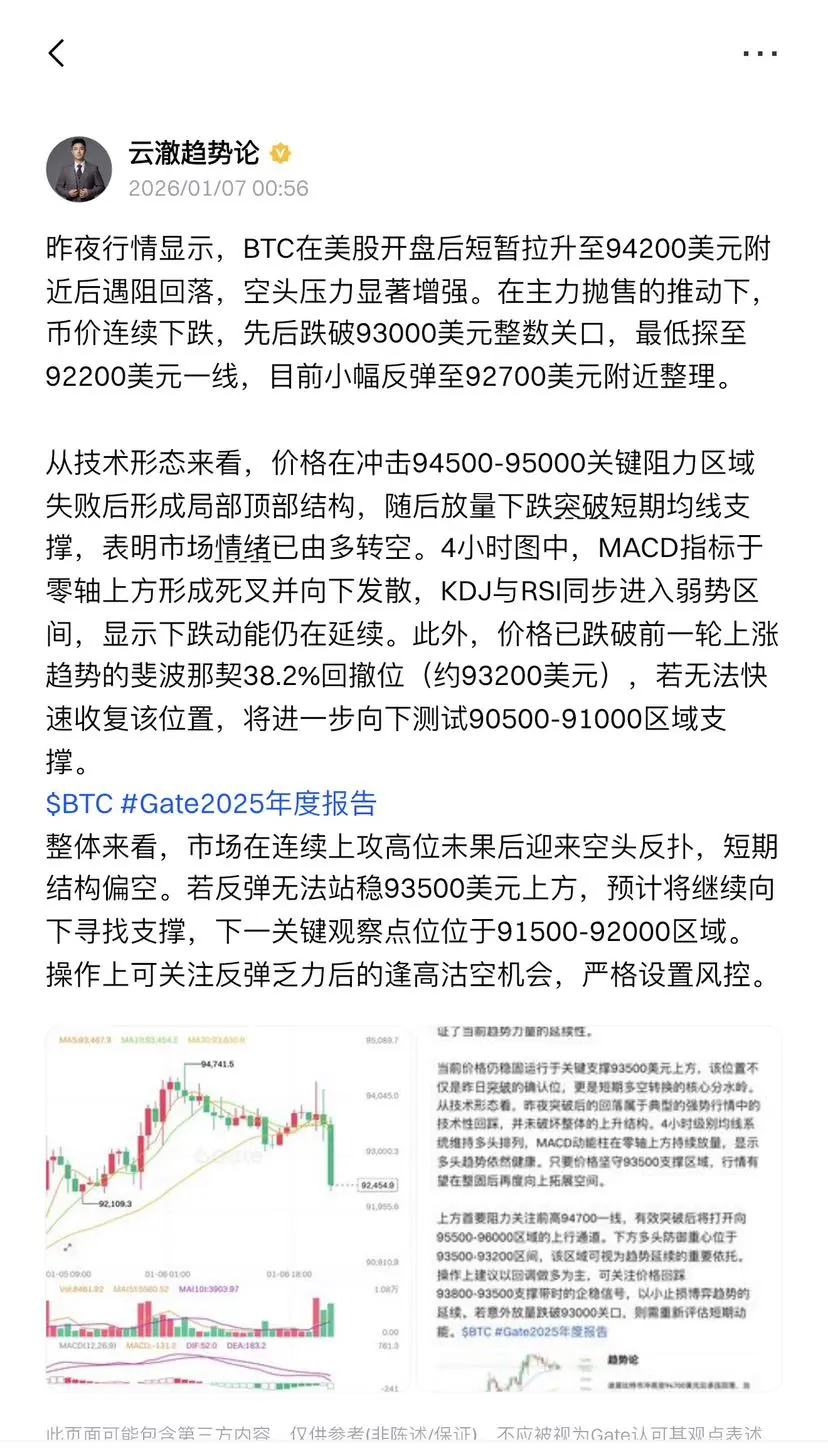
Last night's market data showed that BTC briefly surged to around $94,200 after the US stock market opened, then faced resistance and pulled back, with bearish pressure significantly increasing. Driven by main sell-offs, the price continued to decline, breaking through the $93,000 psychological level successively, with a low of around $92,200. Currently, it has rebounded slightly to around $92,700 and is consolidating.
From a technical perspective, after failing to break through the key resistance zone at 94,500-95,000, a local top structure was formed. Subsequently, the price dropped sharply
From a technical perspective, after failing to break through the key resistance zone at 94,500-95,000, a local top structure was formed. Subsequently, the price dropped sharply
BTC-2,19%
- Reward
- like
- Comment
- Repost
- Share
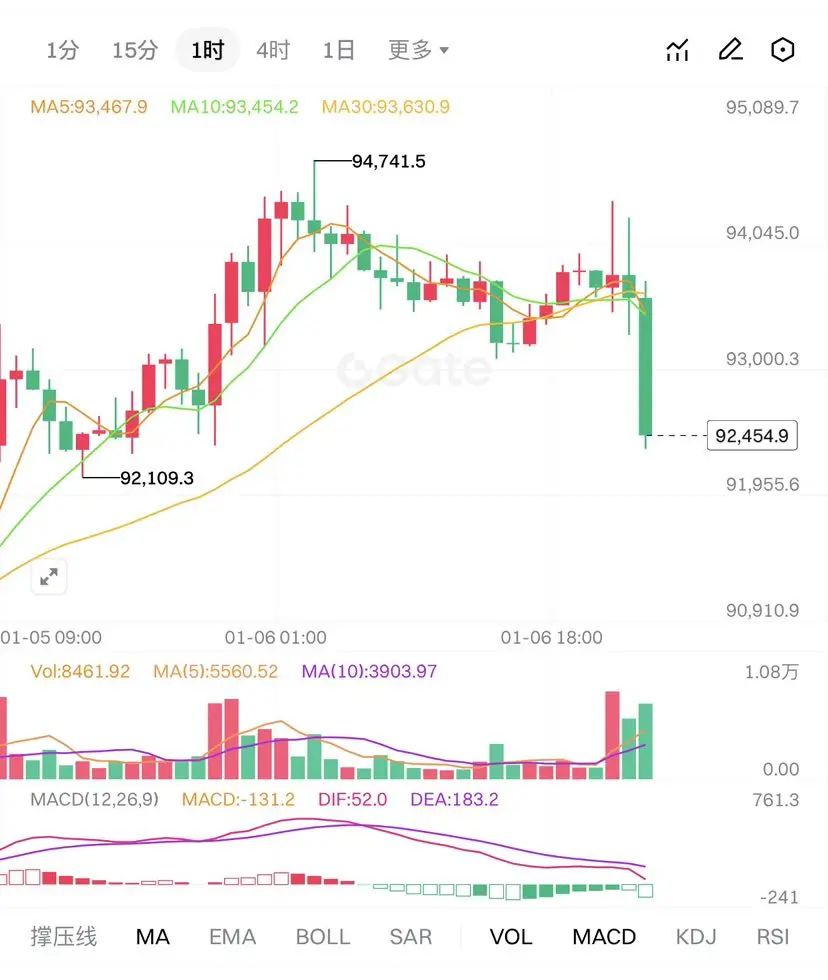
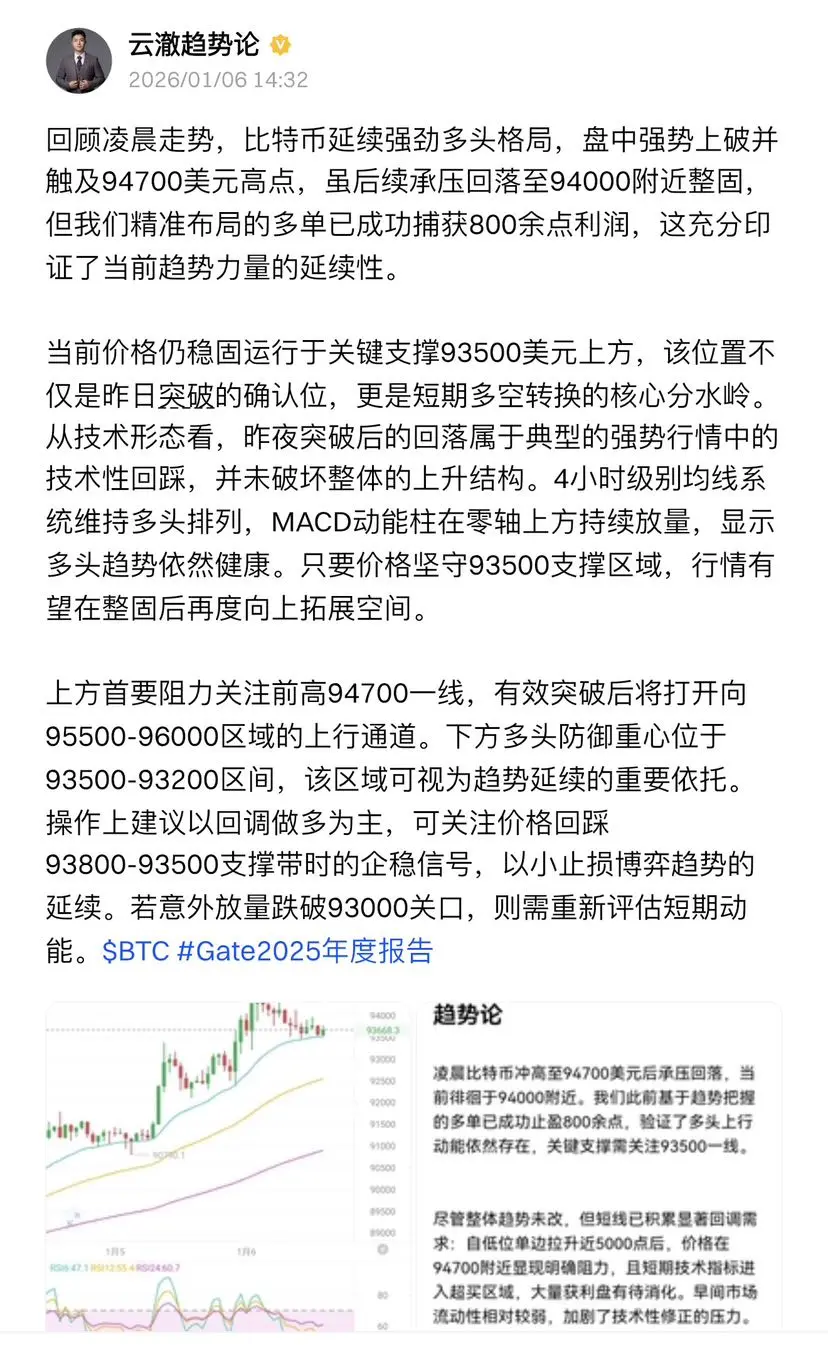
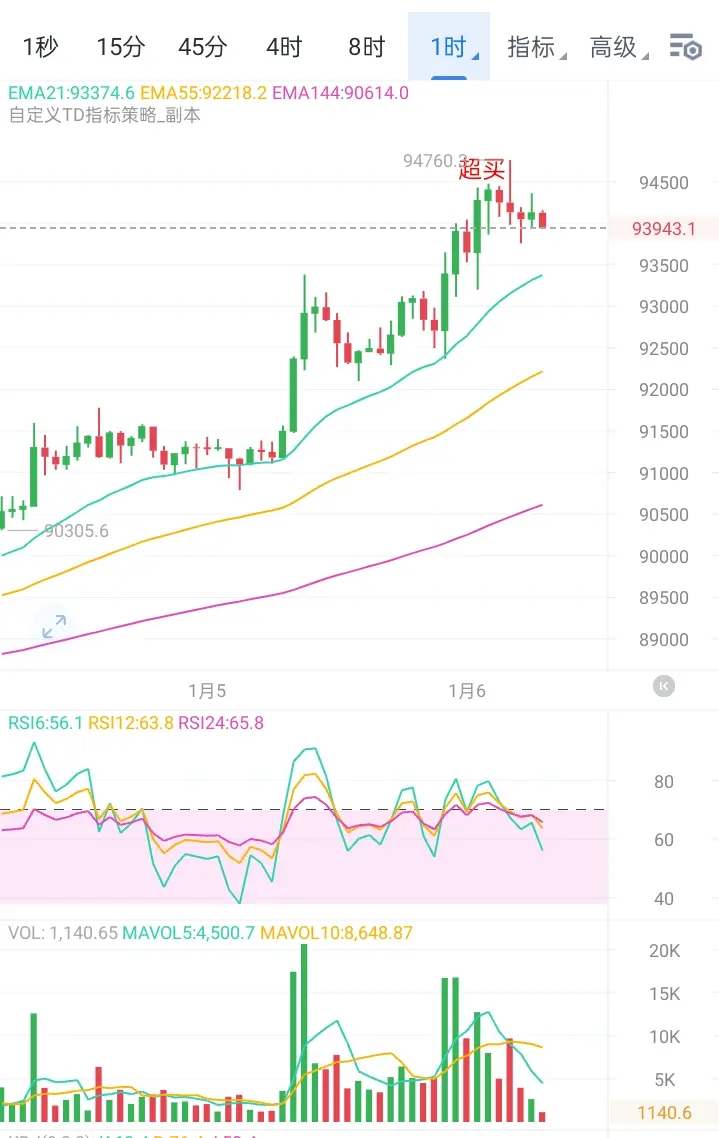
Reviewing the early morning trend, Bitcoin continues its strong bullish pattern, breaking through during the session and reaching a high of $94,700. Although it later faced pressure and retraced to around $94,000 for consolidation, our precisely positioned long positions have already captured over 800 points of profit, which fully confirms the continuation of the current trend strength.
The current price remains firmly above the key support level of $93,500. This level not only confirms yesterday’s breakout but also serves as the critical dividing line for short-term bullish and bearish shifts
The current price remains firmly above the key support level of $93,500. This level not only confirms yesterday’s breakout but also serves as the critical dividing line for short-term bullish and bearish shifts
BTC-2,19%

- Reward
- like
- Comment
- Repost
- Share
Early morning Ethereum showed strong upward movement, reaching a high of $3,266 before facing resistance and pulling back. The current price has retraced to around $3,220. Our long positions established in the early morning successfully took profit of over 80 points, once again confirming our precise grasp of the upward trend. Although the bullish momentum is still being released and the key support at $3,200 has not been broken, there is a clear short-term need for a correction.
After a nearly 250-point surge in a short period, the price encountered significant resistance near $3,266 and bega
After a nearly 250-point surge in a short period, the price encountered significant resistance near $3,266 and bega
ETH-3,52%

- Reward
- like
- Comment
- Repost
- Share
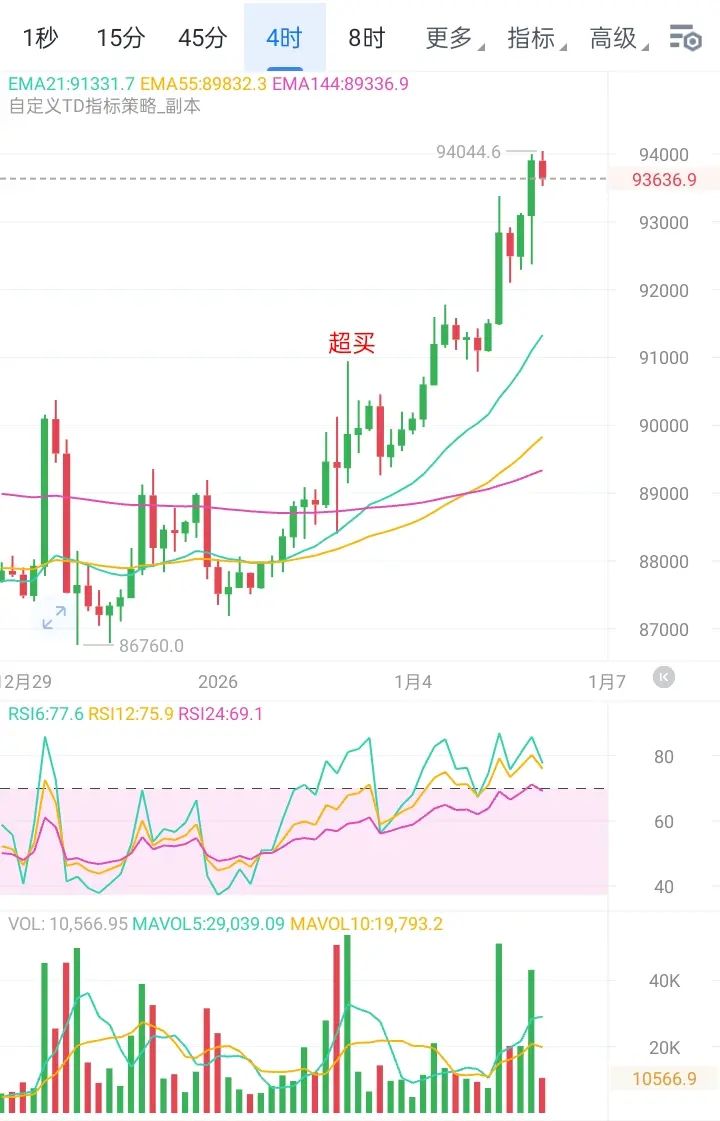
Bitcoin surged to $94,700 early this morning before facing resistance and pulling back, currently hovering around $94,000. Our previous long positions based on trend analysis have successfully taken profit of over 800 points, confirming that the bullish momentum still exists. Key support levels to watch are around 93,500.
Although the overall trend remains unchanged, there is a significant short-term correction demand: after a nearly 5,000-point rally from the lows, the price shows clear resistance near 94,700, and short-term technical indicators have entered overbought territory, with a large
Although the overall trend remains unchanged, there is a significant short-term correction demand: after a nearly 5,000-point rally from the lows, the price shows clear resistance near 94,700, and short-term technical indicators have entered overbought territory, with a large
BTC-2,19%

- Reward
- like
- Comment
- Repost
- Share
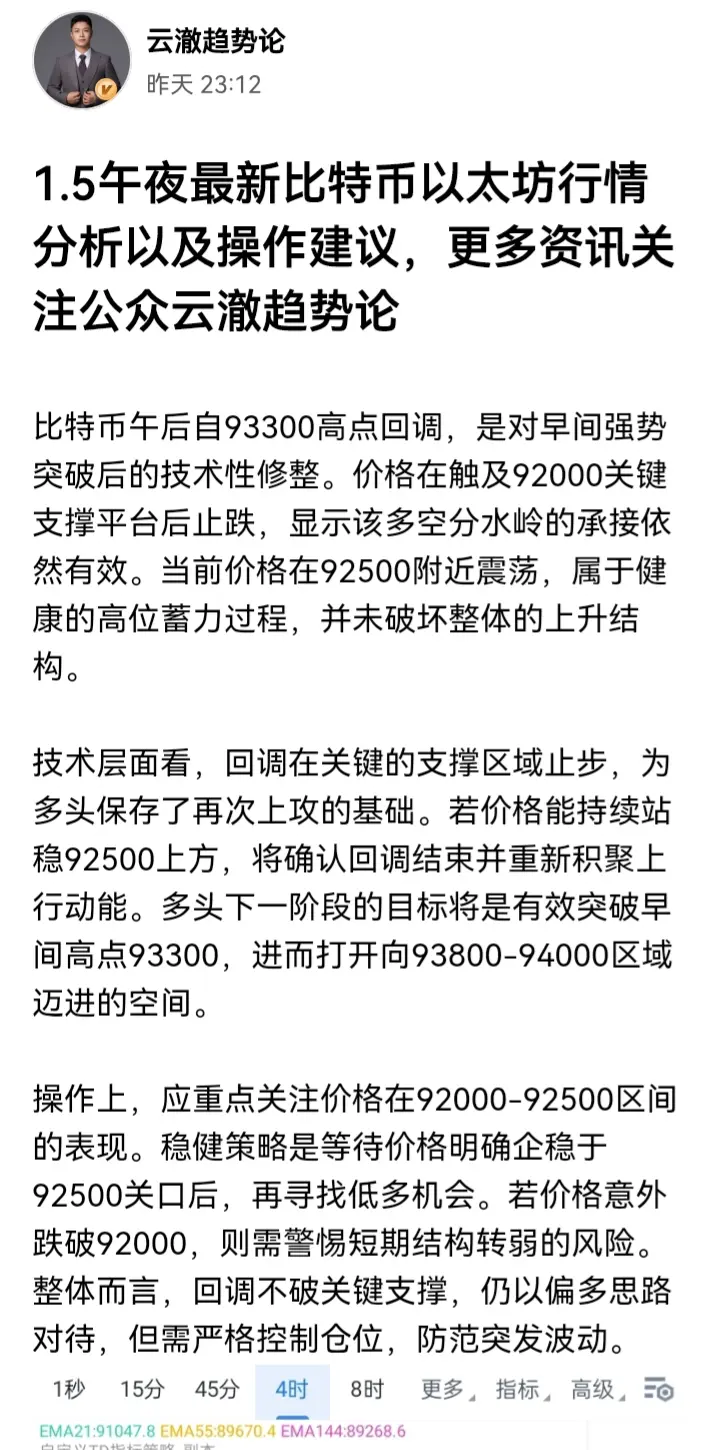
Evening market: Bitcoin retreated from the morning high of 93,300 and is currently consolidating within the key range of 92,000-92,500. This correction can be seen as a technical confirmation after the early breakthrough of the 92,000 threshold. The price stopped falling after precisely retesting the previous breakout point, indicating that the support below remains effective. Overall, the bullish trend has not been broken, and the current adjustment is a normal accumulation phase within the upward process.
From the perspective of the bulls and bears, 92,500 is the key dividing line for streng
From the perspective of the bulls and bears, 92,500 is the key dividing line for streng
BTC-2,19%
- Reward
- like
- Comment
- Repost
- Share
Based on the early morning trend, Ethereum successfully rebounded from the 3115 level. It has now regained the key position of 3130 and reached a high of around 3155. This indicates that the 3115–3130 zone has formed an effective support area, easing short-term bearish pressure.
From a technical perspective, the price has returned above 3130, confirming the support strength at this level, and the short-term trend is gradually shifting to bullish dominance. If the price can continue to stay above 3130, there is potential for further upward testing of the resistance zone at 3180–3200 in the morn
From a technical perspective, the price has returned above 3130, confirming the support strength at this level, and the short-term trend is gradually shifting to bullish dominance. If the price can continue to stay above 3130, there is potential for further upward testing of the resistance zone at 3180–3200 in the morn
ETH-3,52%
- Reward
- like
- Comment
- Repost
- Share
Bitcoin rebounded strongly after touching $89,800, and has now stabilized above the key psychological level of $90,000. Currently, it is trading around $90,500. The rebound was accompanied by continuous volume increase from the bulls, indicating strong buying momentum, which provides solid support for the price to challenge the resistance near $91,000 again.
From a technical perspective, $90,000 has shifted from resistance to initial support. If the daily close remains above this level, the short-term trend will stay bullish. The next key target is at $91,000. A successful breakthrough of this
From a technical perspective, $90,000 has shifted from resistance to initial support. If the daily close remains above this level, the short-term trend will stay bullish. The next key target is at $91,000. A successful breakthrough of this
BTC-2,19%

- Reward
- like
- Comment
- Repost
- Share
From the market perspective, Bitcoin surged to 90,500 in the morning before pulling back to around 89,600, which is a healthy consolidation in an upward trend. The price found support at the key moving averages on the hourly chart and did not break below the strong support zone of 89,000-89,300 with increased volume, indicating that the bullish pattern remains intact. The current pullback is more likely to be a preparation for the next upward move.
Technical indicators also support a bullish outlook: the hourly RSI has recovered from overbought territory to neutral, and the MACD momentum remai
Technical indicators also support a bullish outlook: the hourly RSI has recovered from overbought territory to neutral, and the MACD momentum remai
BTC-2,19%
- Reward
- like
- Comment
- Repost
- Share
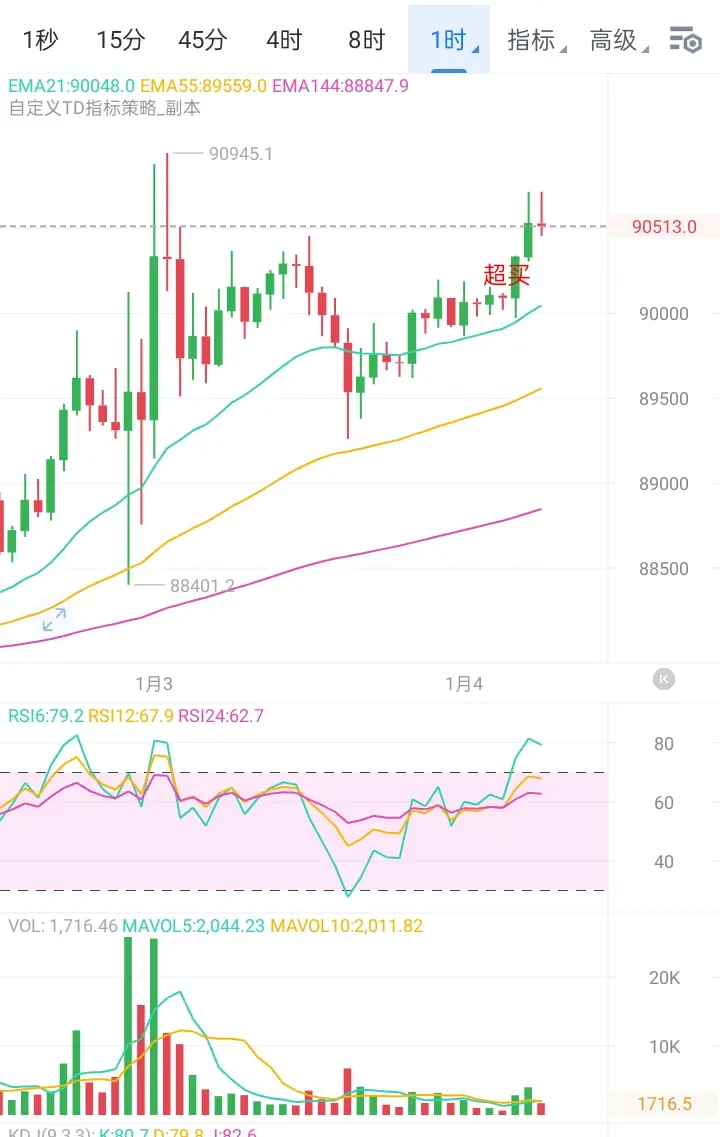
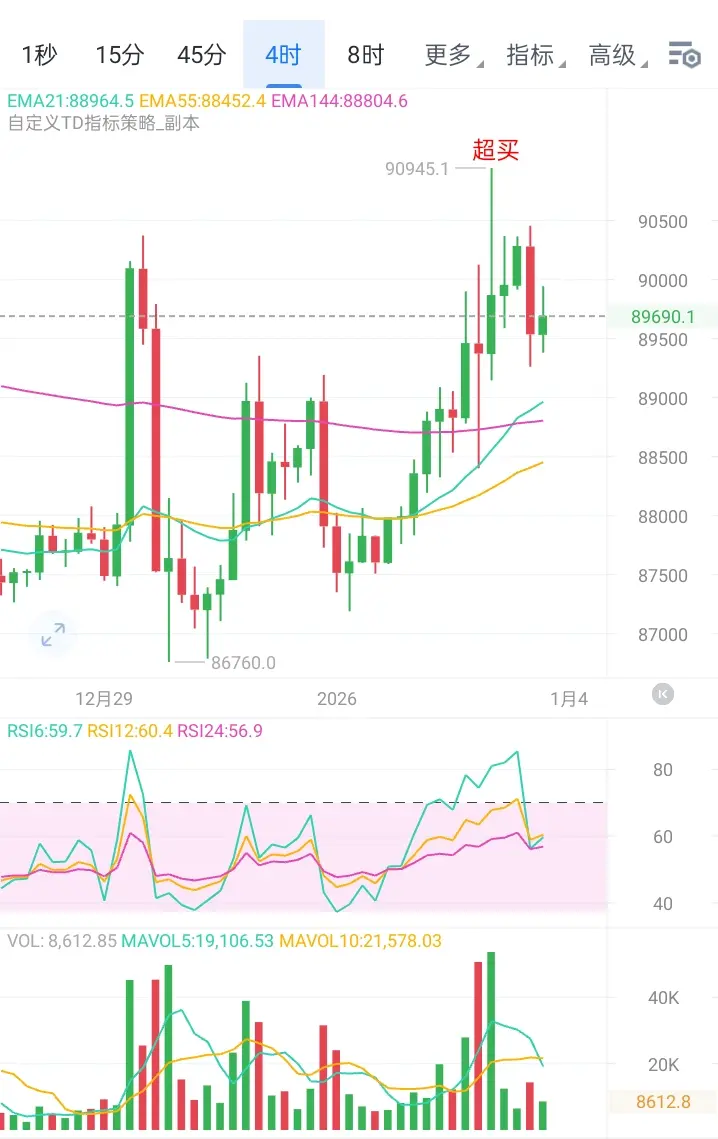
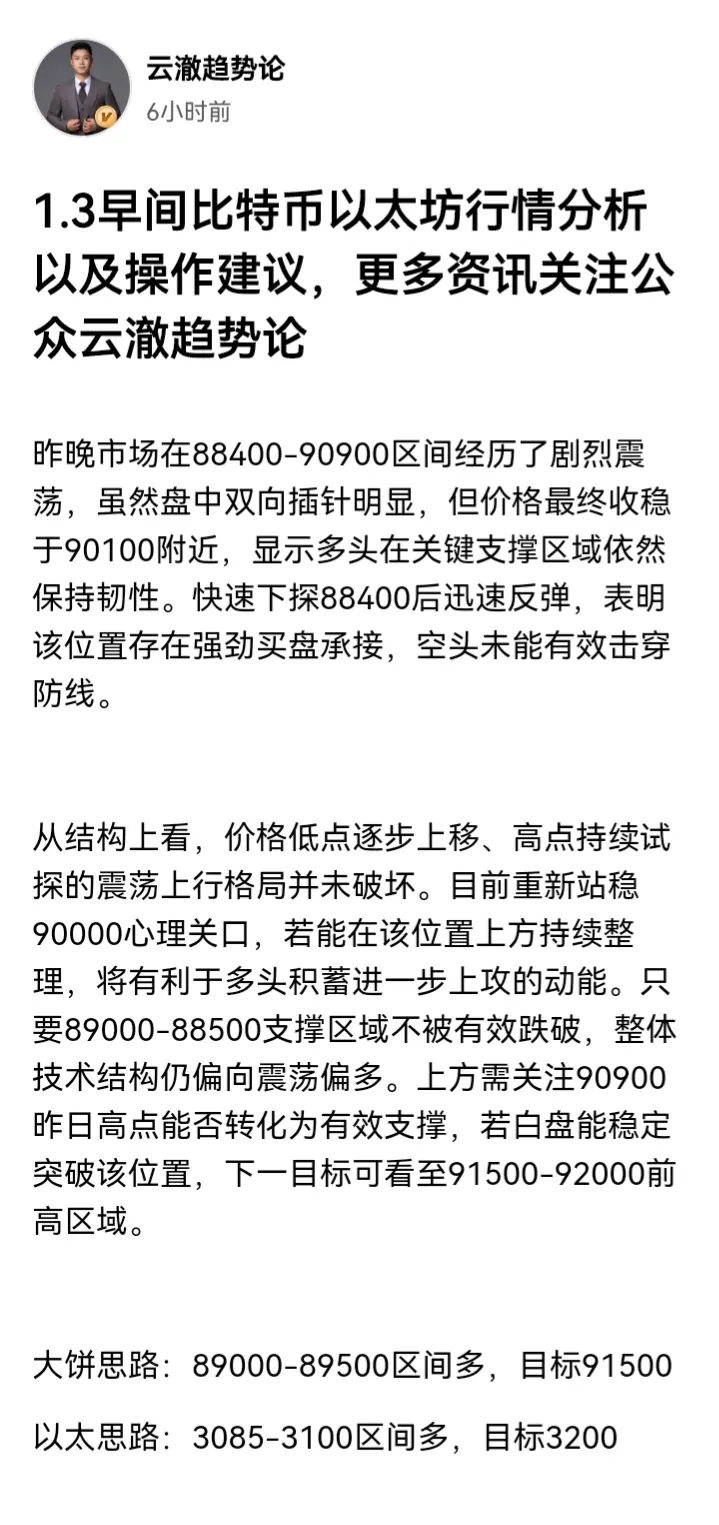
Last night, the market experienced intense volatility within the 88400-90900 range. Although there were obvious two-way pinning during the session, the price ultimately stabilized around 90100, indicating that the bulls still maintain resilience at the key support area. After a quick dip to 88400, a rapid rebound occurred, showing strong buying interest at that level, and the bears failed to effectively break through the defense line.
From a structural perspective, the pattern of gradually rising lows and continuous testing of highs in a oscillating upward trend has not been broken. Currently,
From a structural perspective, the pattern of gradually rising lows and continuous testing of highs in a oscillating upward trend has not been broken. Currently,
BTC-2,19%
- Reward
- like
- 2
- Repost
- Share
鑫鑫鑫赚:
Experienced driver, guide me 📈View More
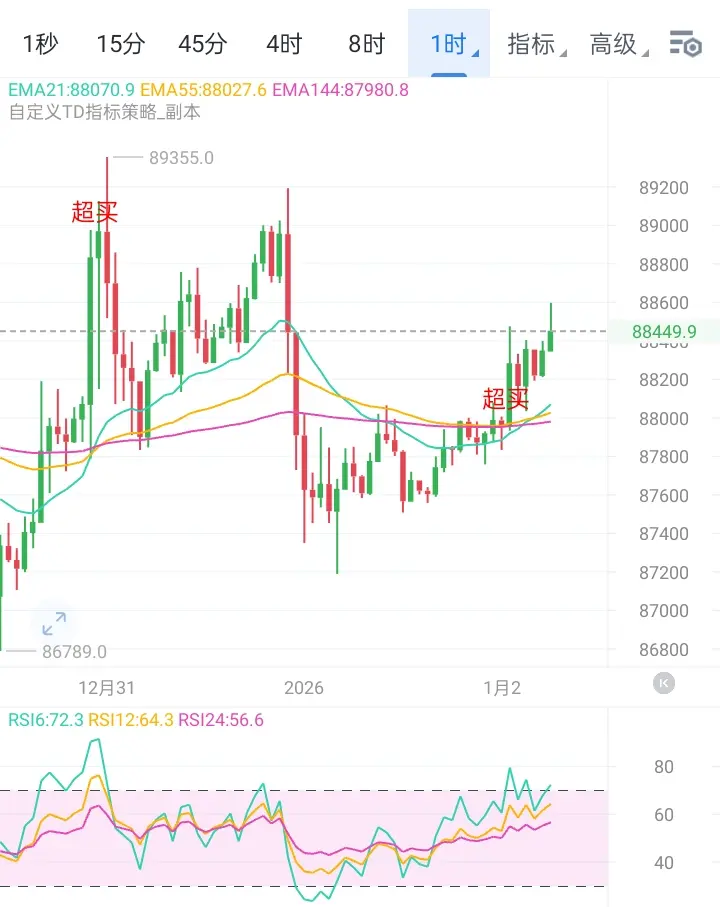
Bitcoin sharply broke through and stabilized above the key resistance level of $88,000 in the early morning, successfully turning this important threshold into a support platform for subsequent upward movement. The price then further rose above $88,500, showing a healthy breakout pattern with rising volume and price, indicating strong bullish momentum and a significant shift in market sentiment towards optimism.
From a technical perspective, this effective breakout marks the establishment of a new upward trend, with the market focus overall shifting higher. In the short term, the market is exp
From a technical perspective, this effective breakout marks the establishment of a new upward trend, with the market focus overall shifting higher. In the short term, the market is exp
BTC-2,19%
- Reward
- like
- Comment
- Repost
- Share
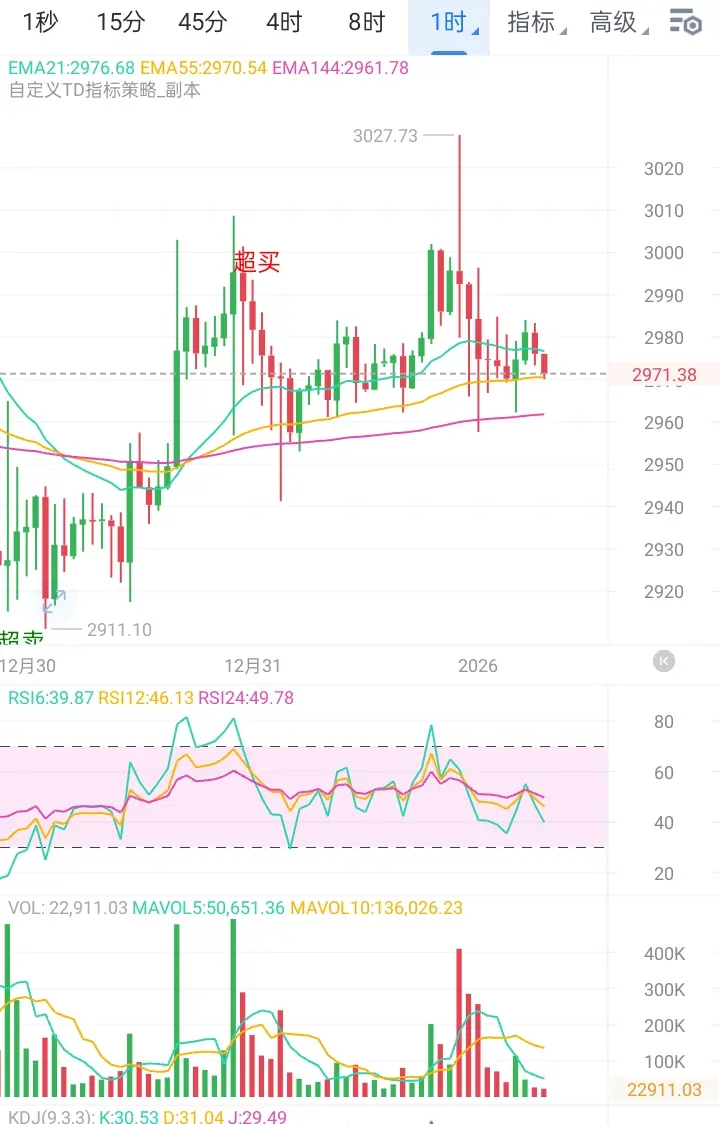
Currently, Ethereum is oscillating around 2970, with a technical structure showing signs of weak rebound. Although the price has rebounded from the support level of 2960, the hourly chart is approaching a key resistance zone, and multiple indicators are signaling weakening momentum.
From a technical indicator perspective, the price is clearly under pressure near 2975, close to the middle band of the hourly Bollinger Bands and the lower edge of the previous small-cycle consolidation platform, forming a short-term critical resistance. During the rebound, trading volume has continued to decline,
From a technical indicator perspective, the price is clearly under pressure near 2975, close to the middle band of the hourly Bollinger Bands and the lower edge of the previous small-cycle consolidation platform, forming a short-term critical resistance. During the rebound, trading volume has continued to decline,
ETH-3,52%

- Reward
- like
- Comment
- Repost
- Share
Bitcoin's current rebound to around 87,700 faces significant resistance at this level, which is within the dense pressure zone of 87,800-88,000. During the rebound, trading volume continues to decline, showing signs of volume-price divergence. The hourly moving average system is gradually narrowing and shows a potential death cross. The MACD and RSI indicators are weakening simultaneously, indicating that bullish momentum is diminishing.
If the price cannot effectively break through the 88,000 barrier, it may test the key support at 87,200 again in the short term. If this support level is brok
If the price cannot effectively break through the 88,000 barrier, it may test the key support at 87,200 again in the short term. If this support level is brok
BTC-2,19%


- Reward
- like
- Comment
- Repost
- Share