


- Bitcoin ETF funds attract new inflows, while Ethereum and XRP experience slight outflows.
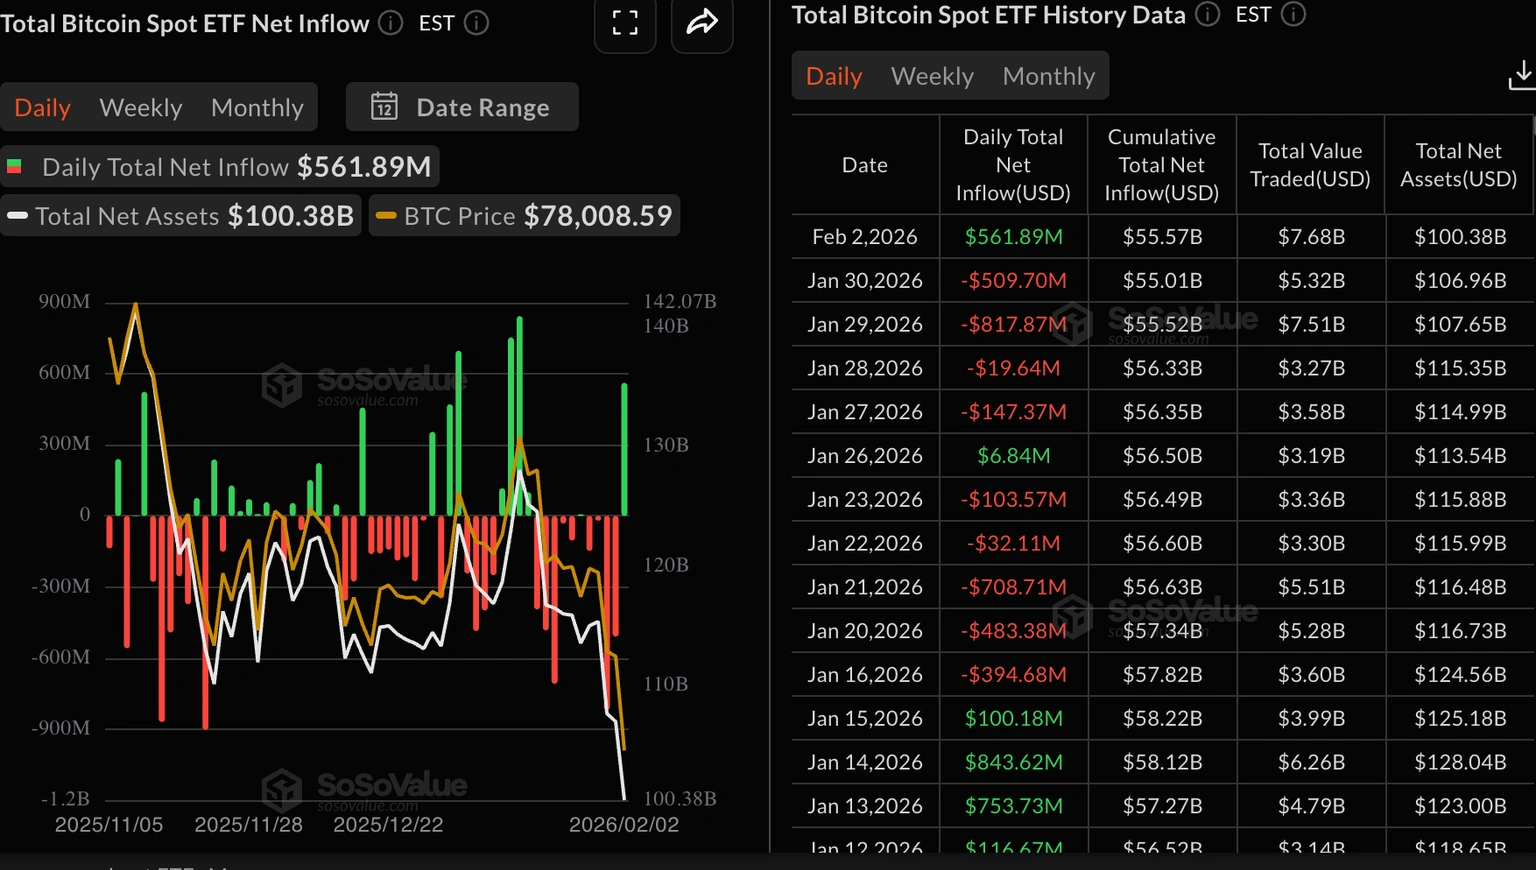
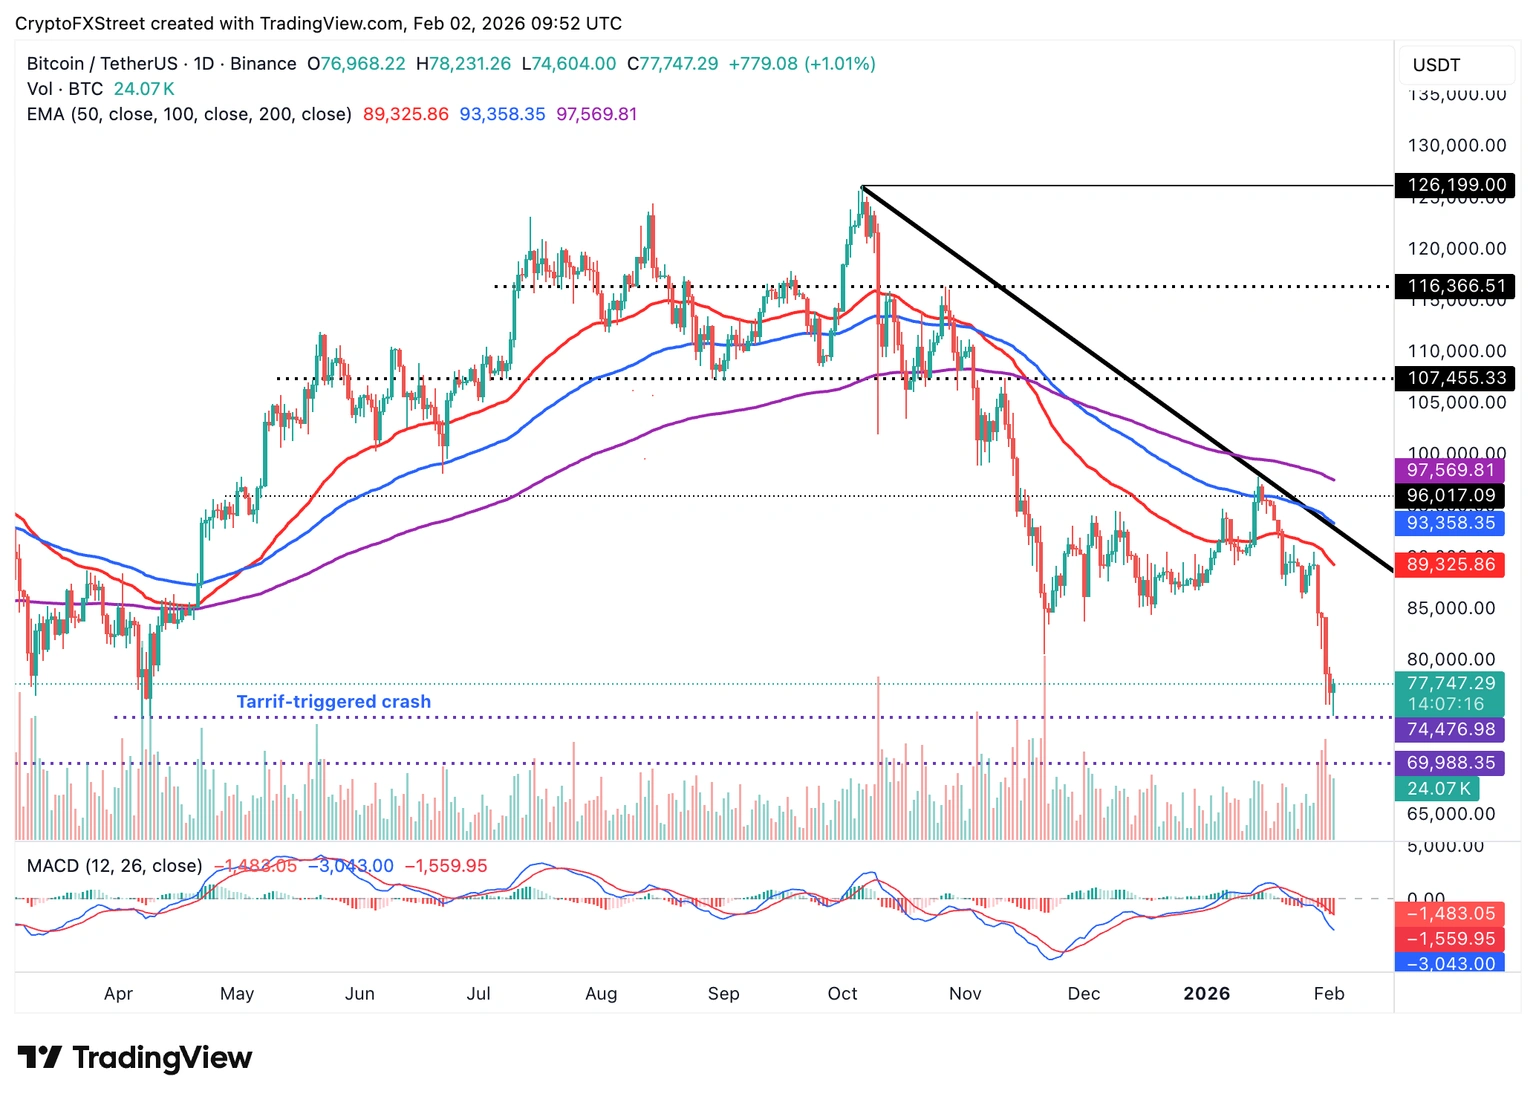
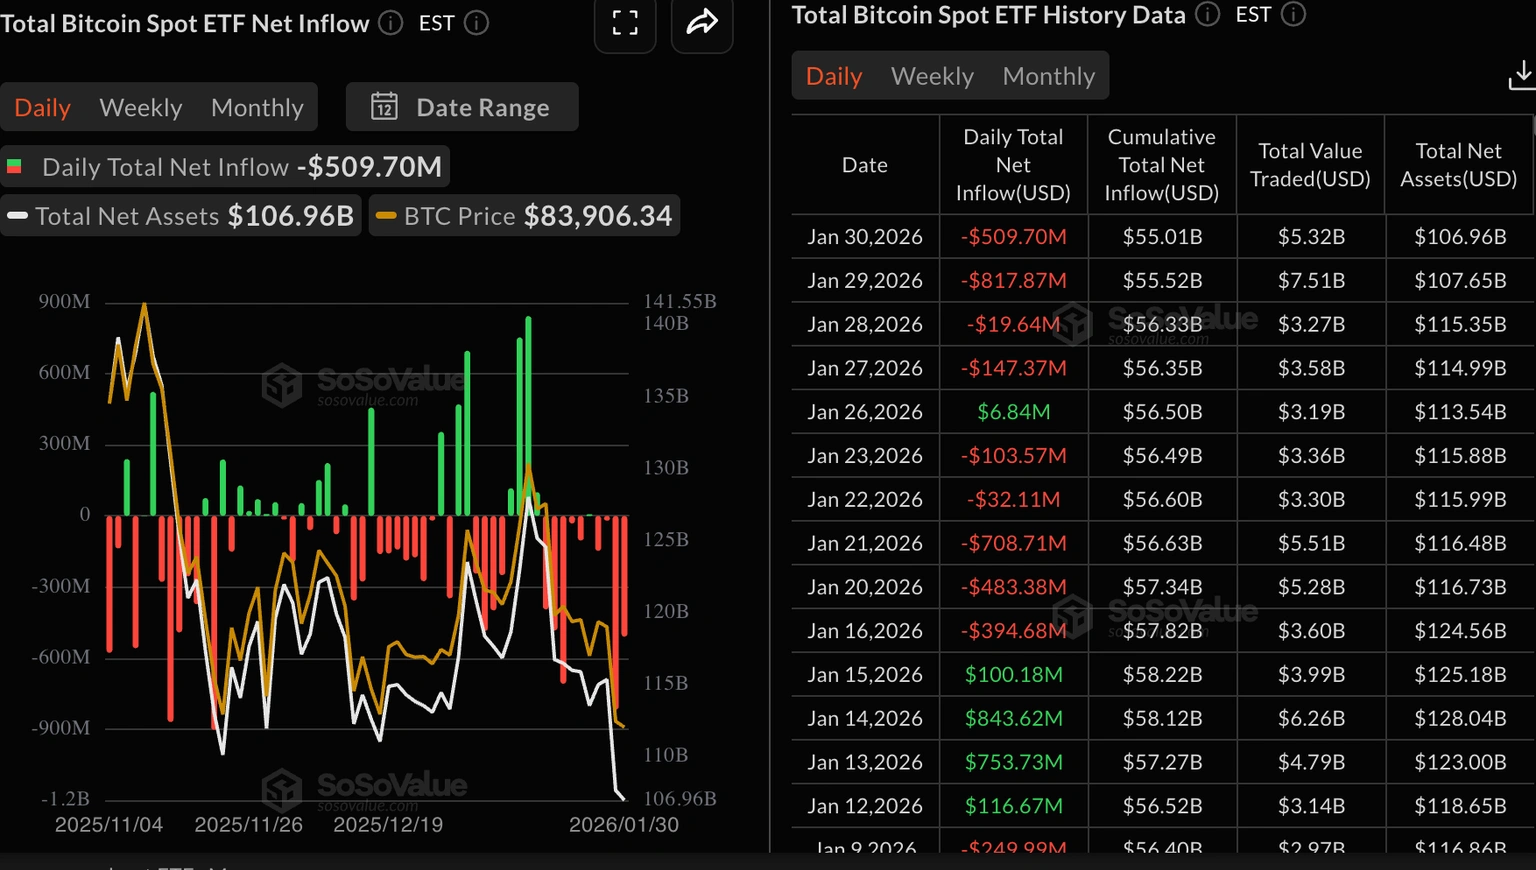
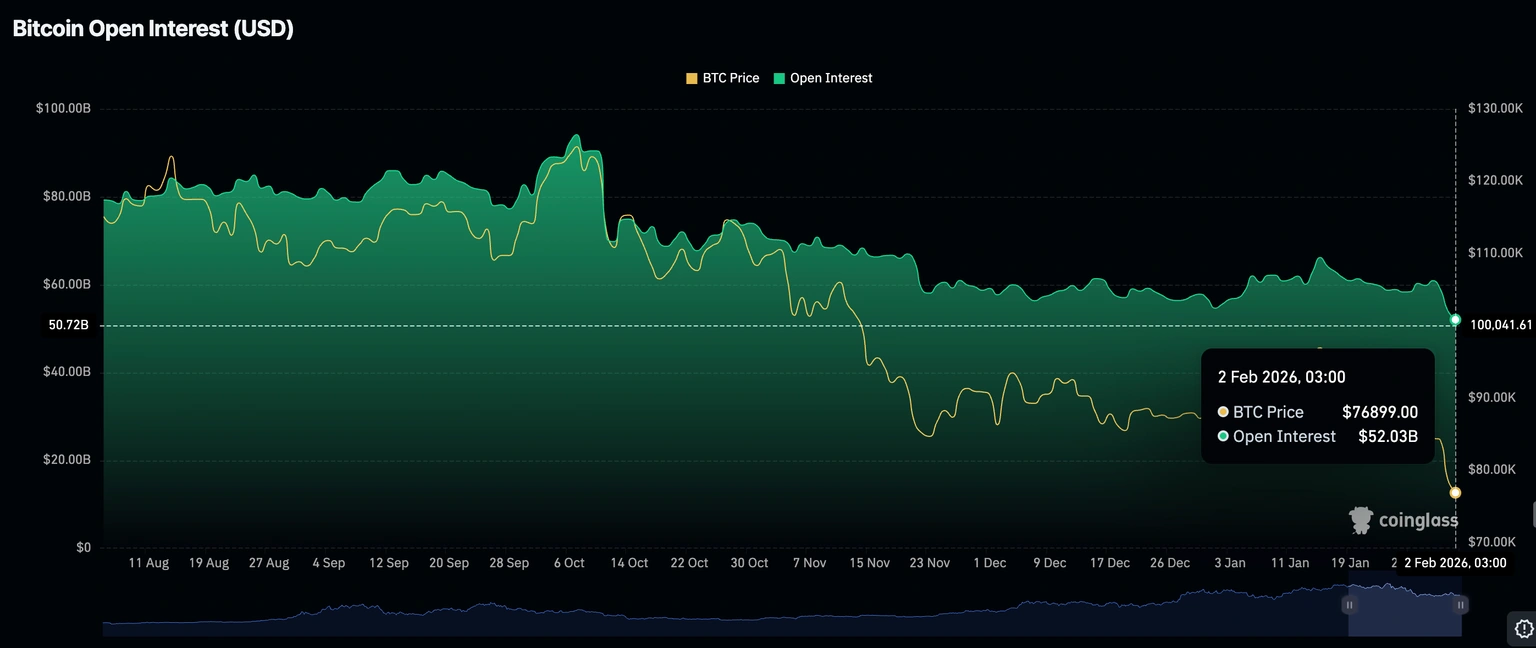
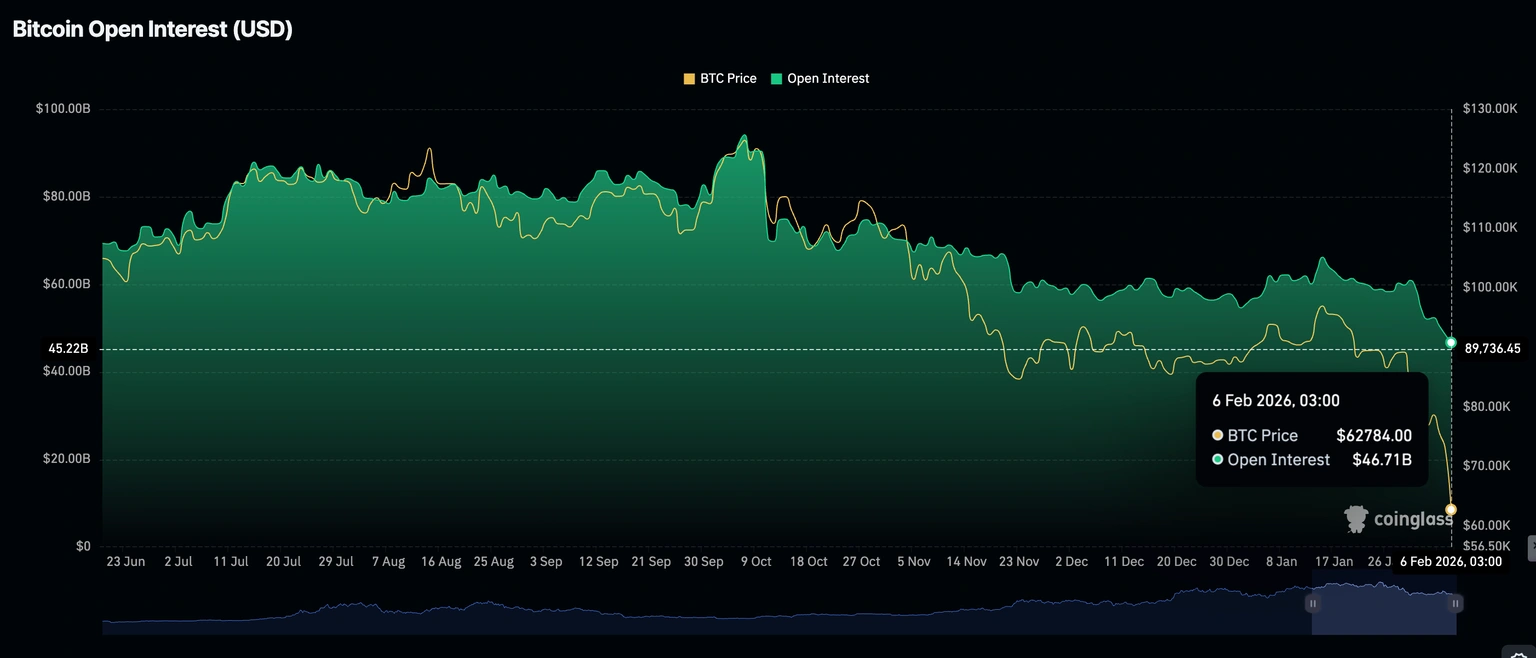
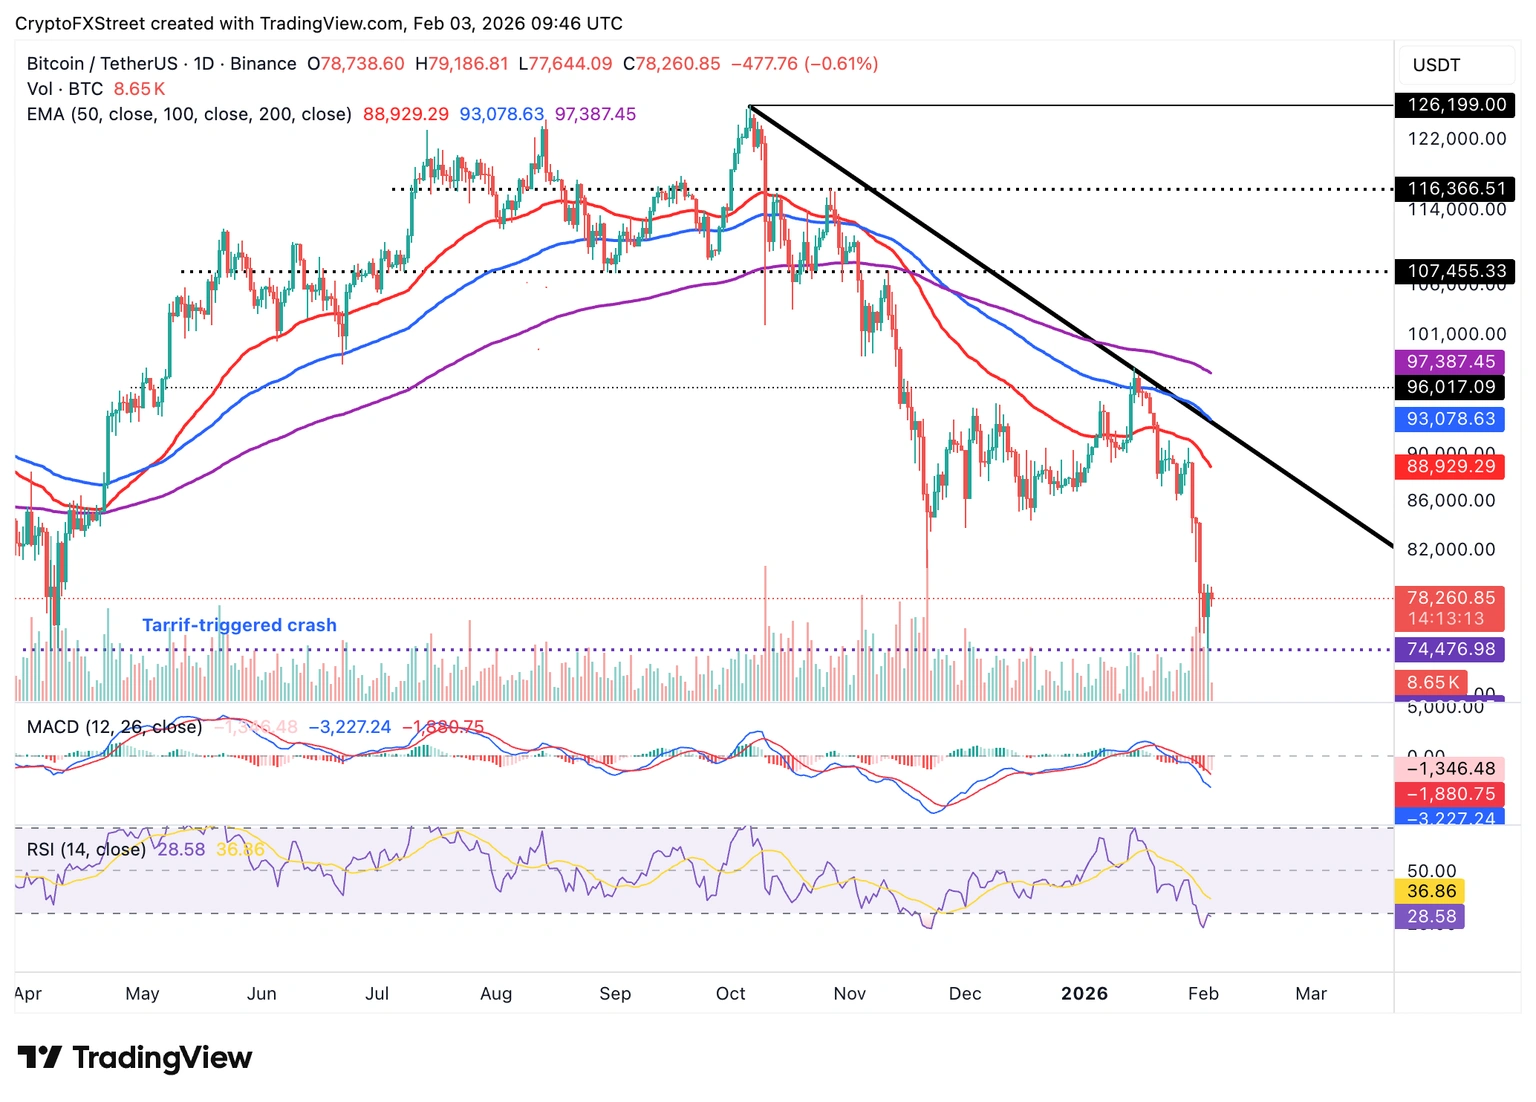
U.S.-listed spot Bitcoin ETFs saw approximately $562 million in inflows on Monday. This marks a return of institutional interest, ending a four-day streak of outflows that had led to a decline in Bitcoin's price performance.
Total current inflows amount to $55.57 billion, with assets under management (AUM) at $100.38 billion. Stable cash flows into ETF funds indicate positive market sentiment, which could support a Bitcoin rebound.
Bitcoin ETF Flows | Source: SoSoValue
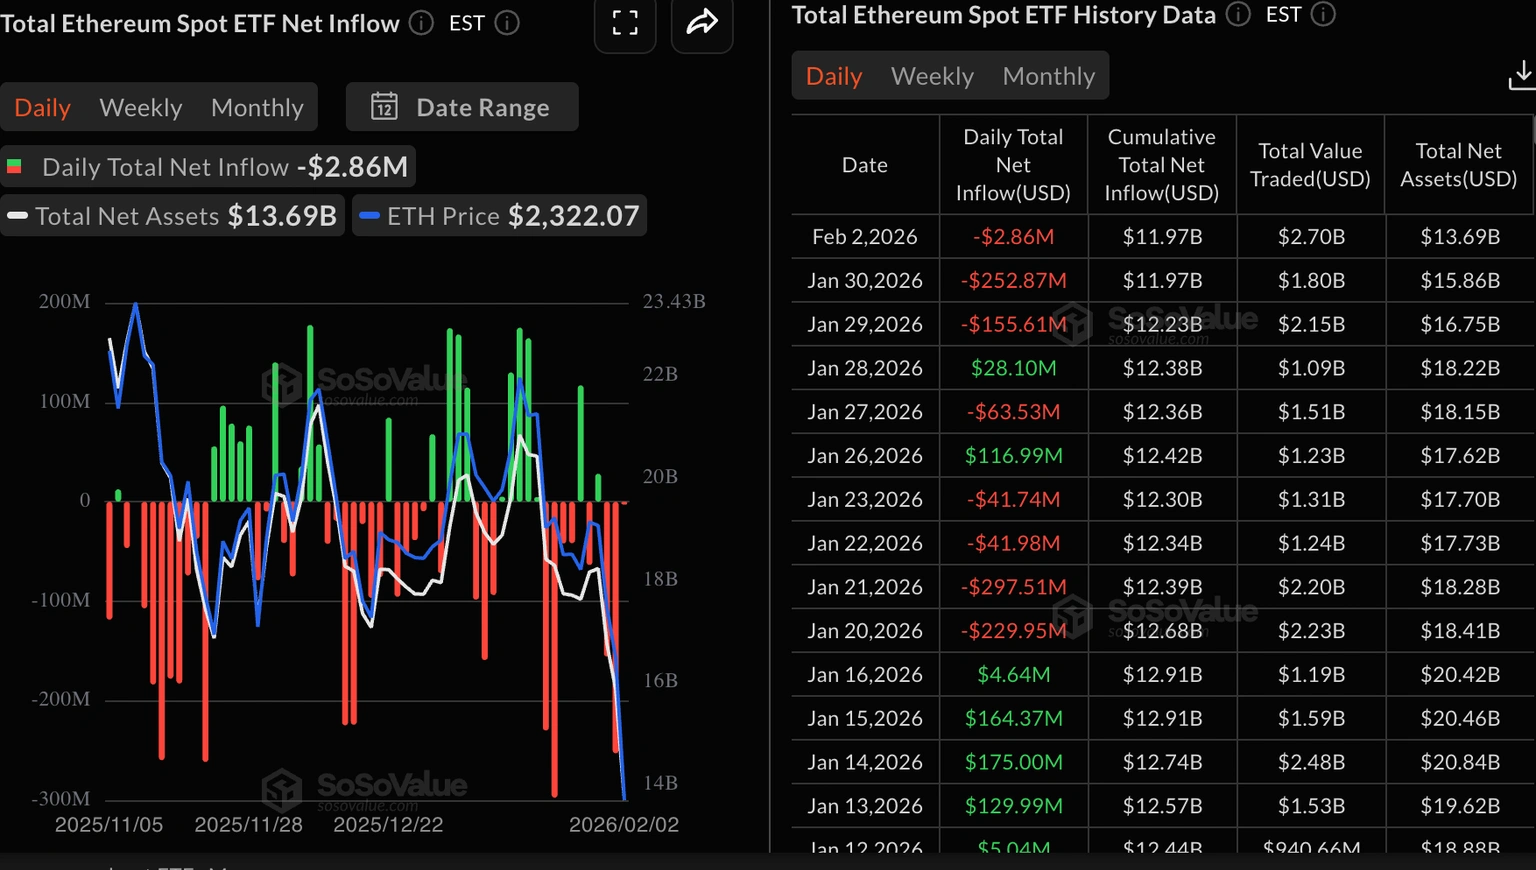
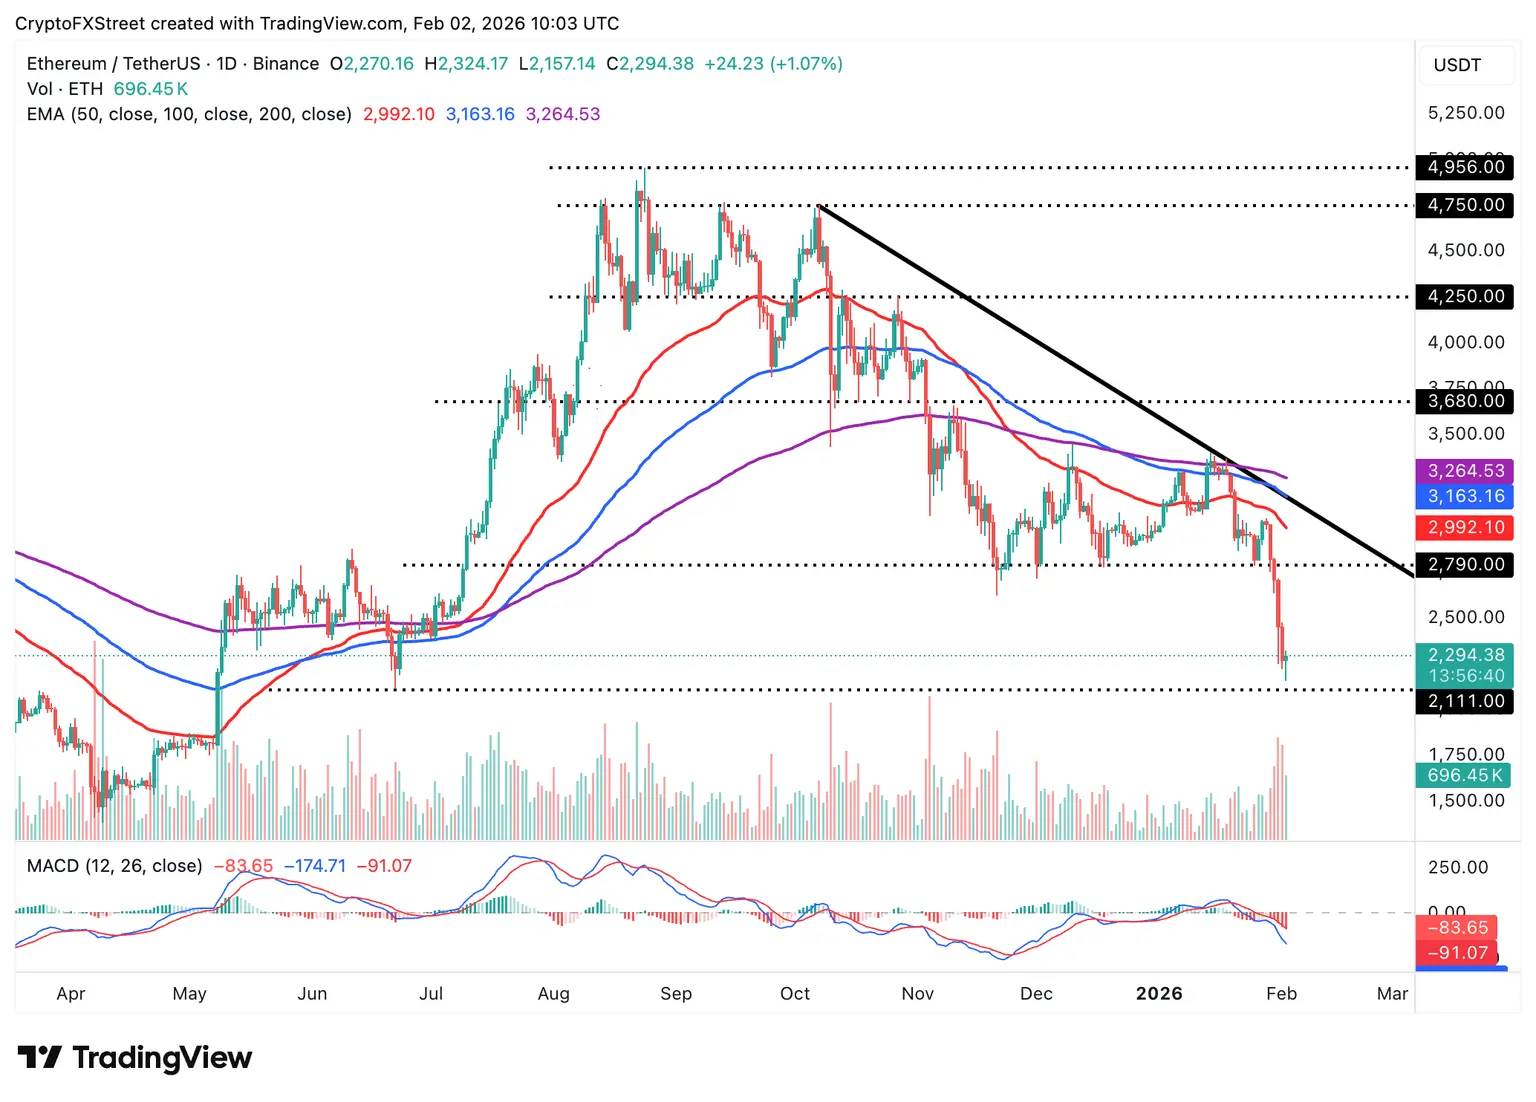
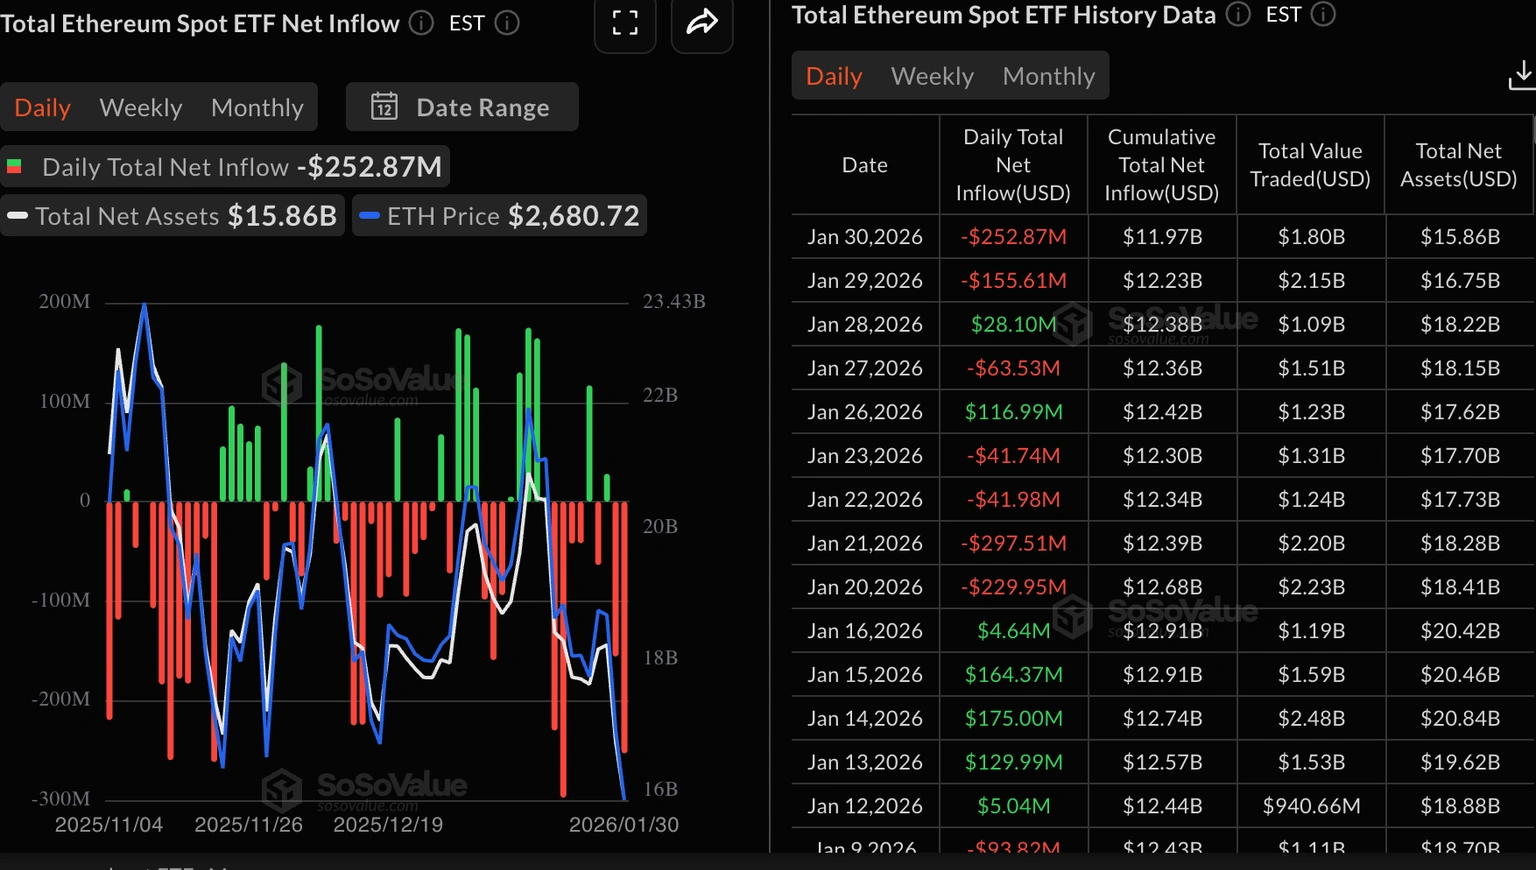
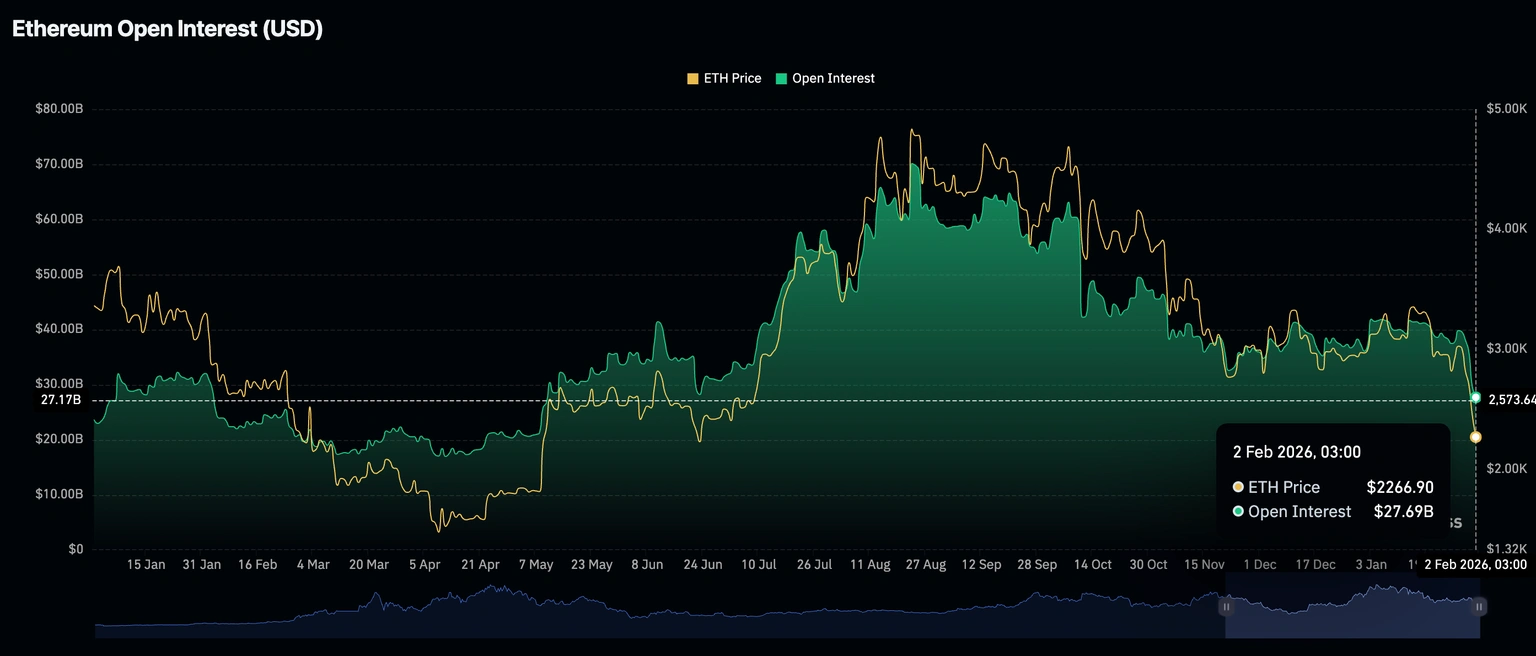
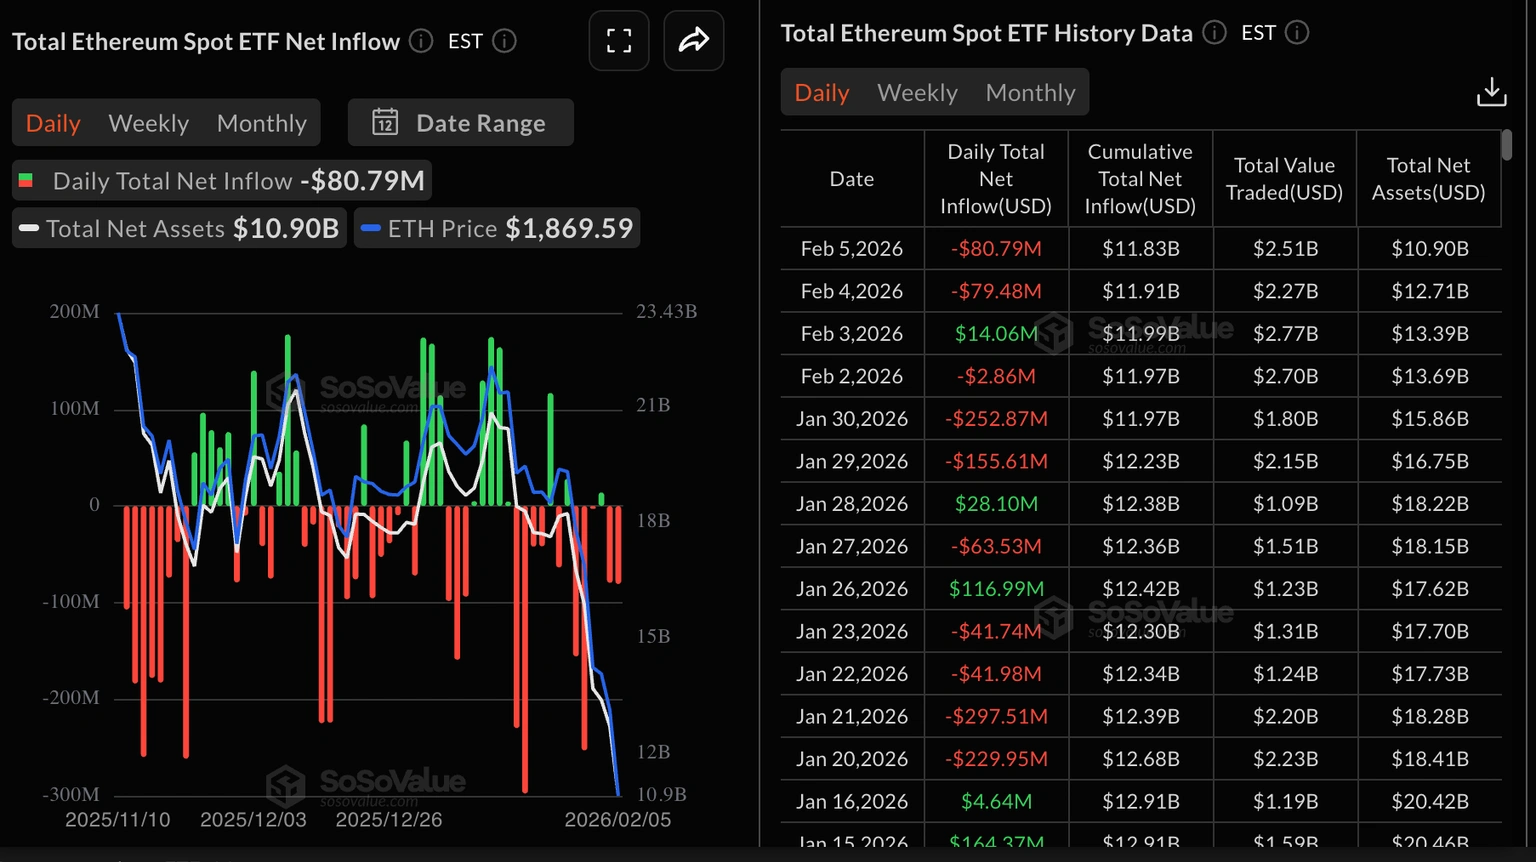
Meanwhile, Ethereum spot ETFs continued a third consecutive day of investment withdrawals, with investors pulling nearly $3 million on Monday. Total inflows now stand at $11.97 billion, with an average net asset value of $13.69 billion. Continued outflows could dampen sentiment and slow the recovery pace.
Ethereum ETF Flows | Source: SoSoValue
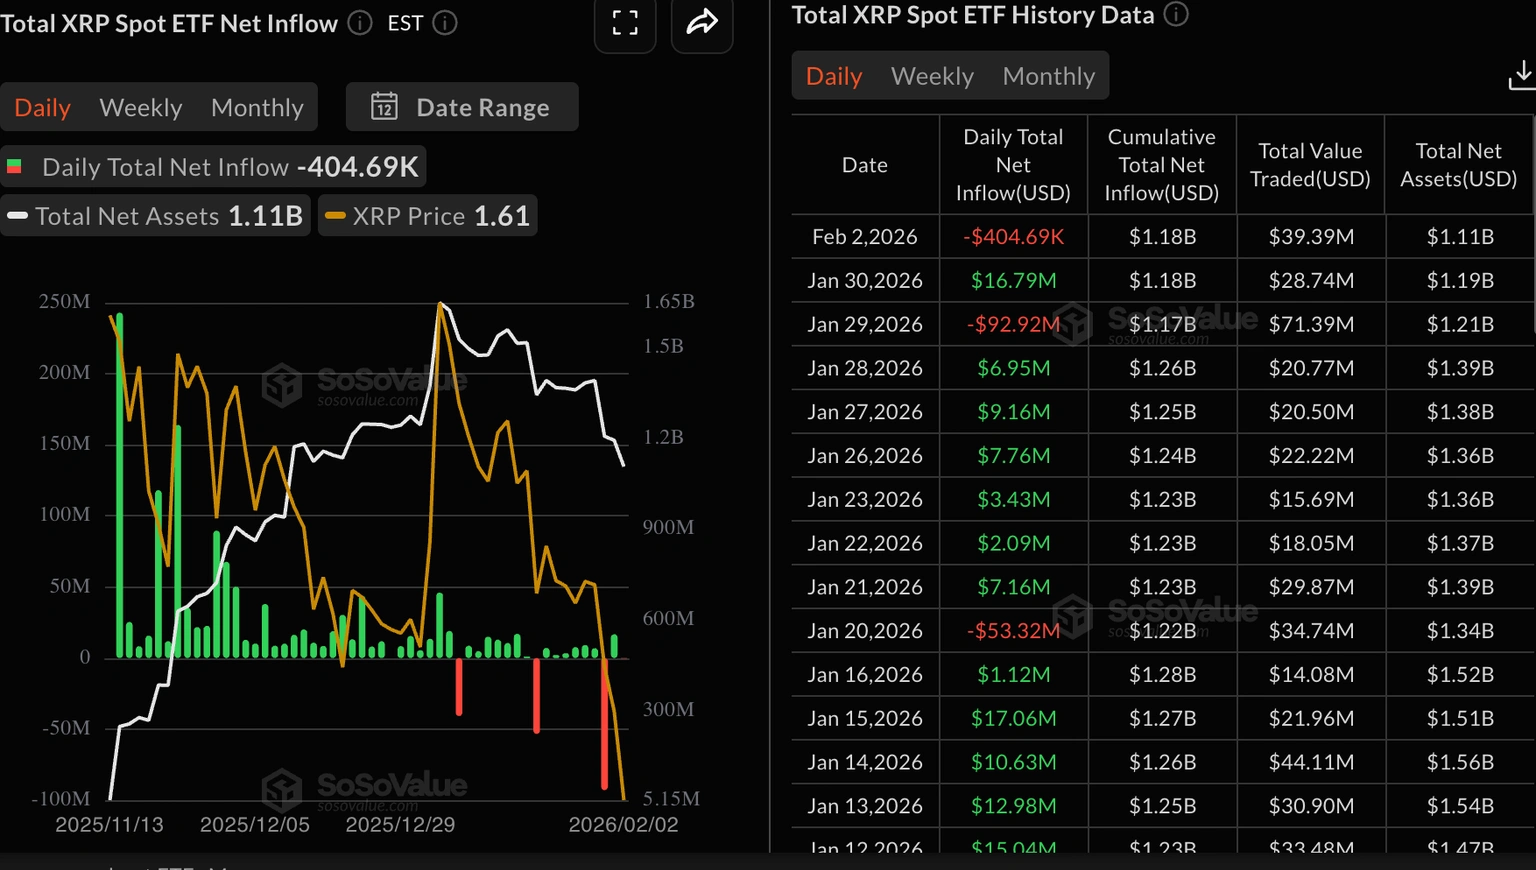
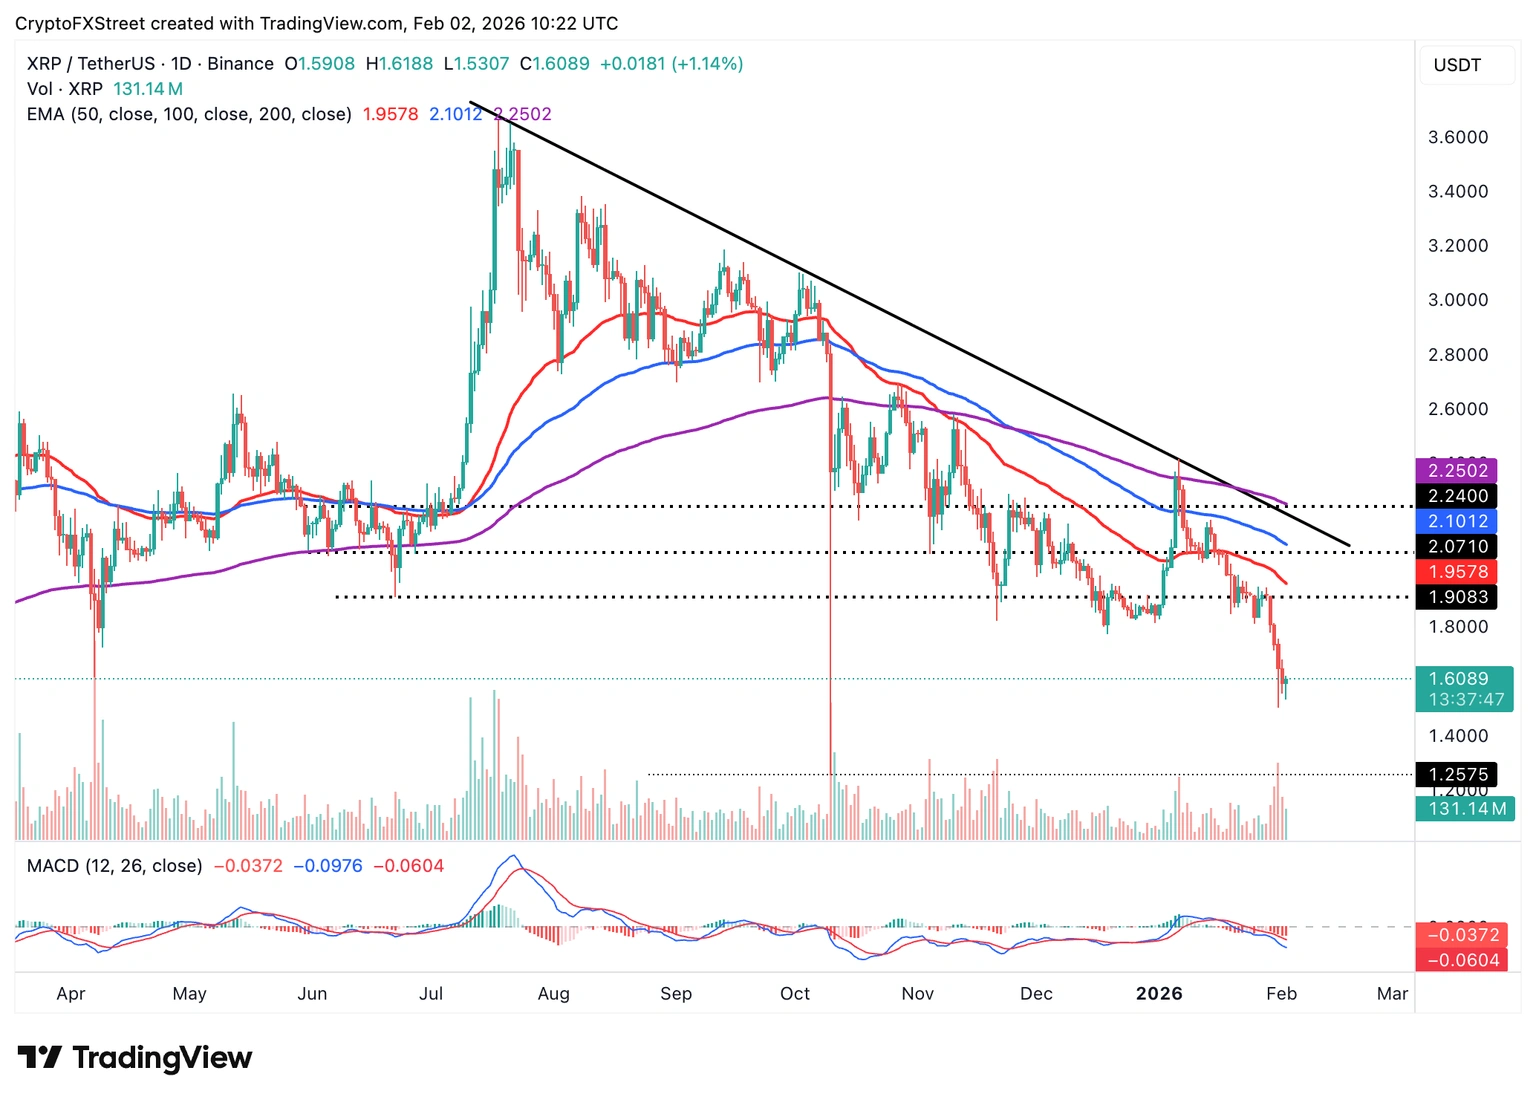
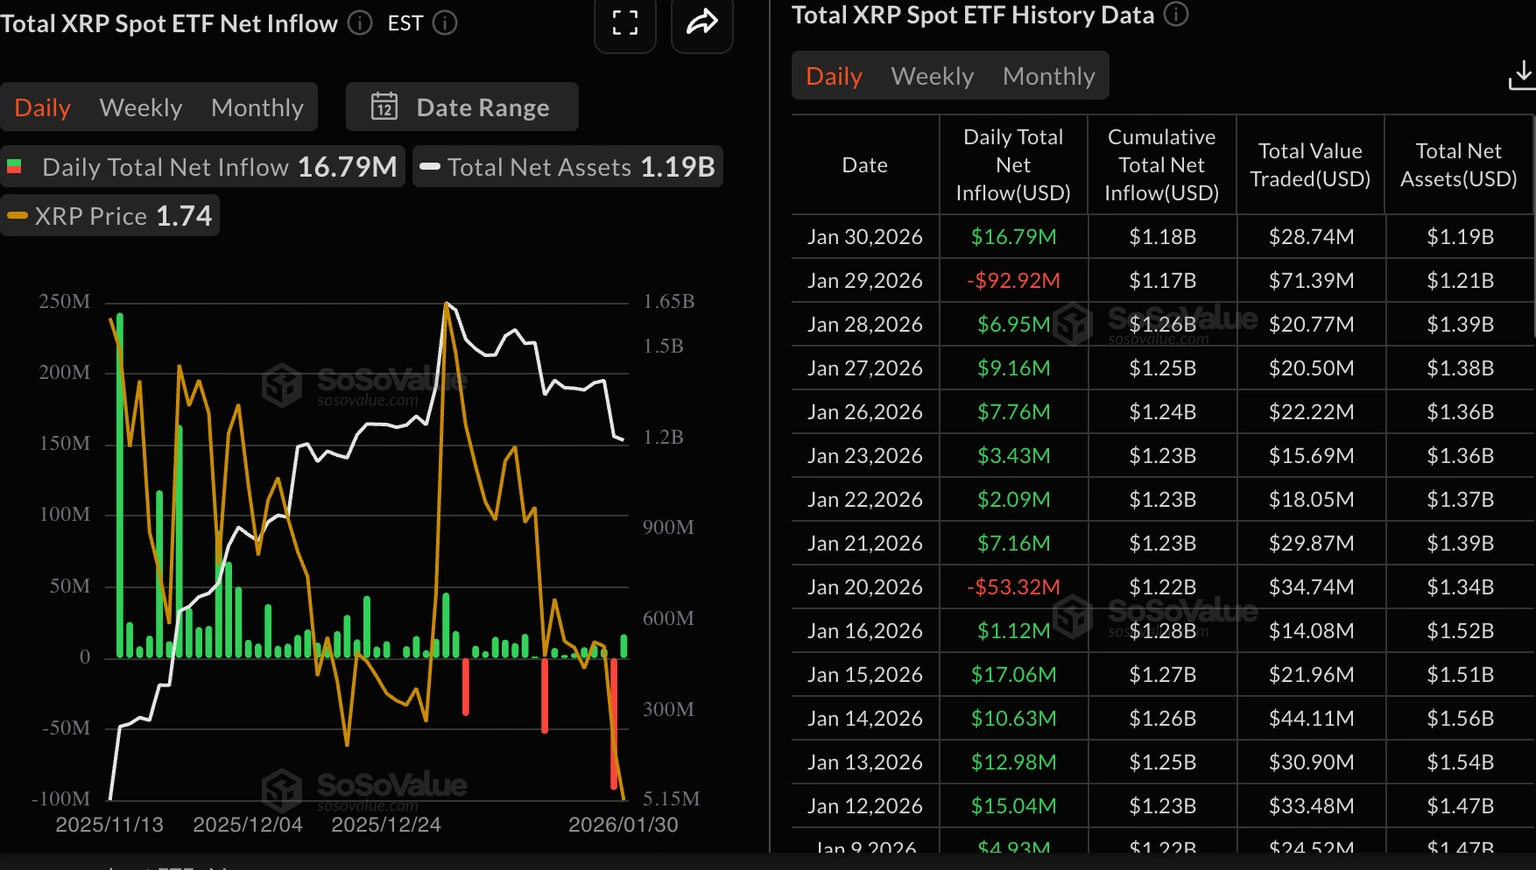
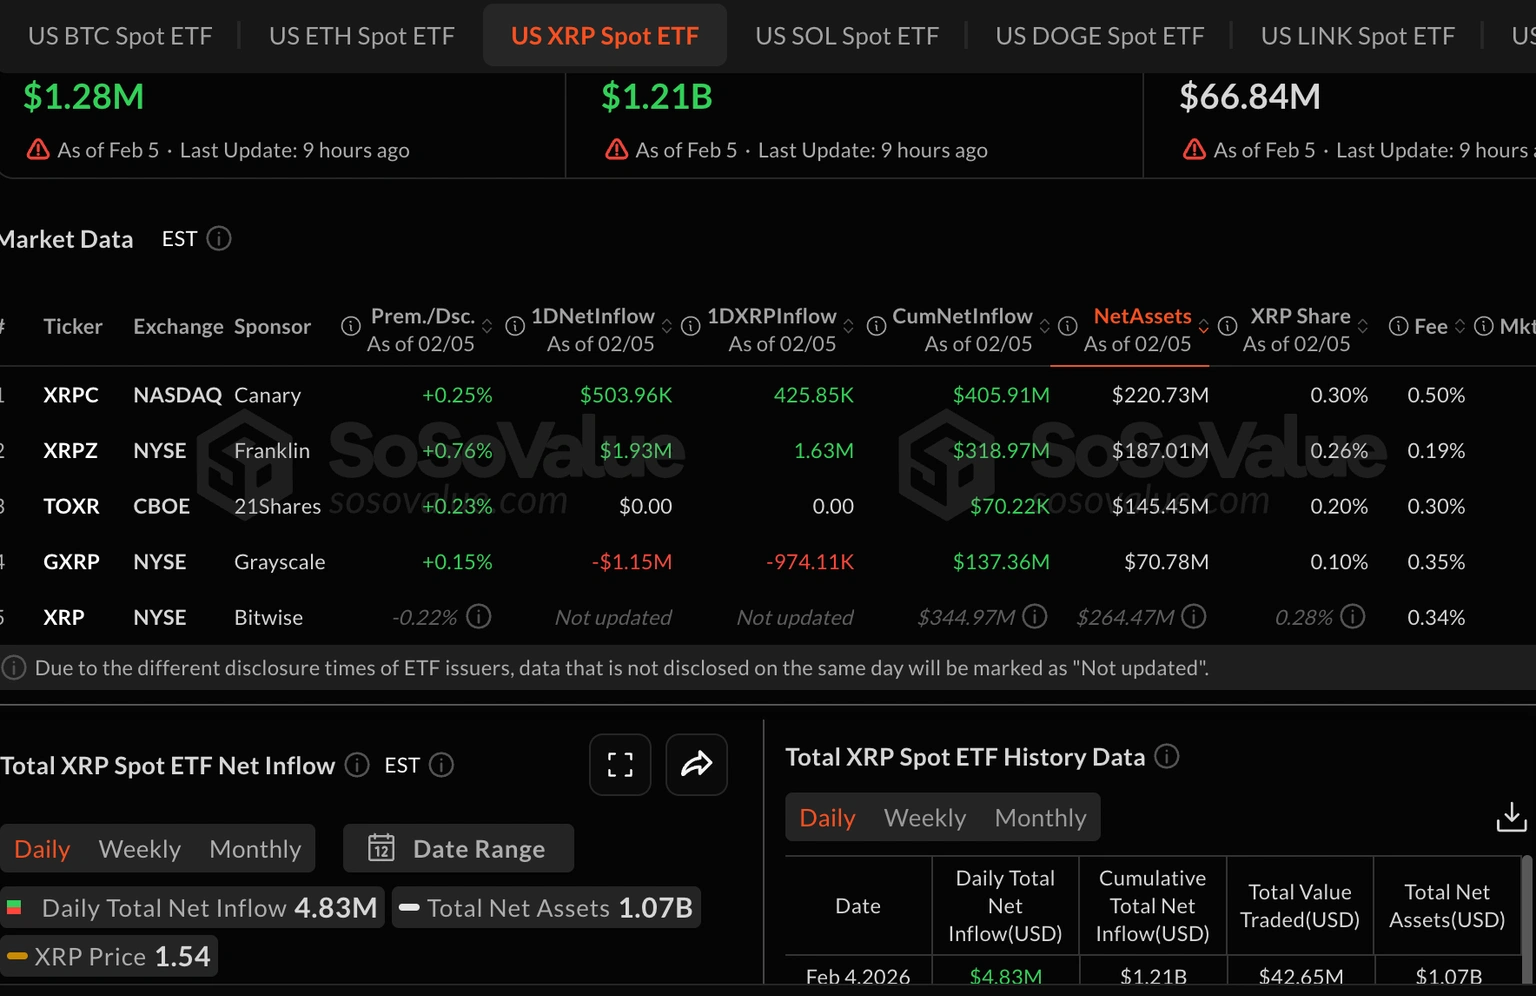
Additionally, XRP ETF outflows were modest, totaling around $405,000 on Monday, after large inflows of approximately $17 million on Friday. The total value of XRP ETFs is $1.18 billion, with a net AUM of $1.11 billion, according to SoSoValue data.
XRP ETF Flows | Source: SoSoValue
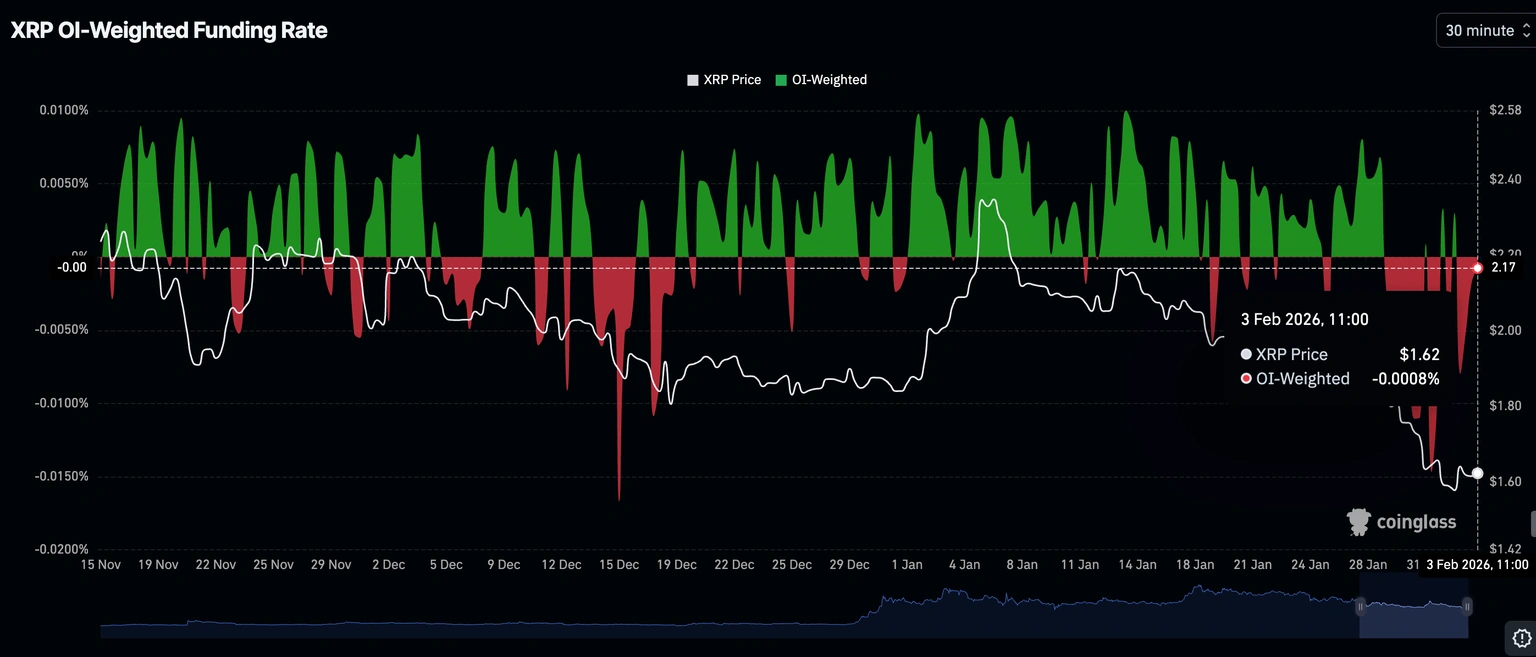
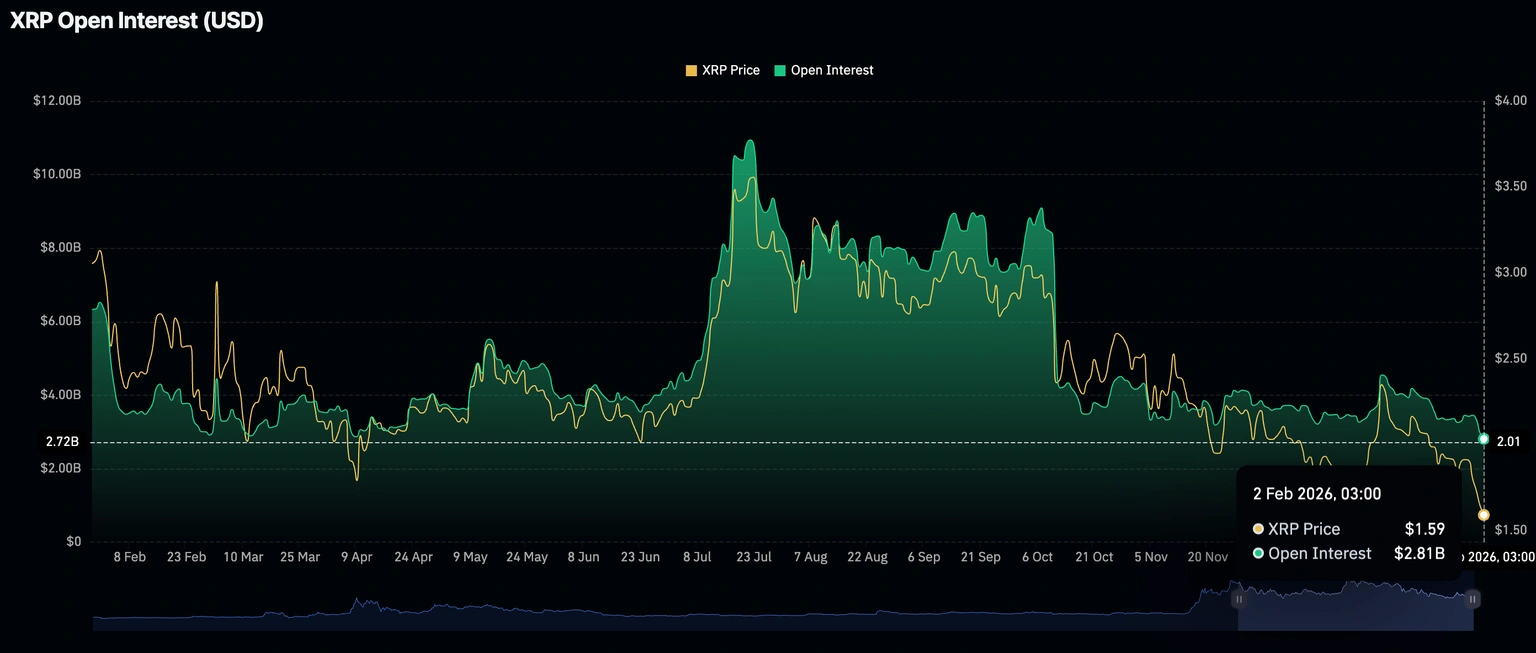
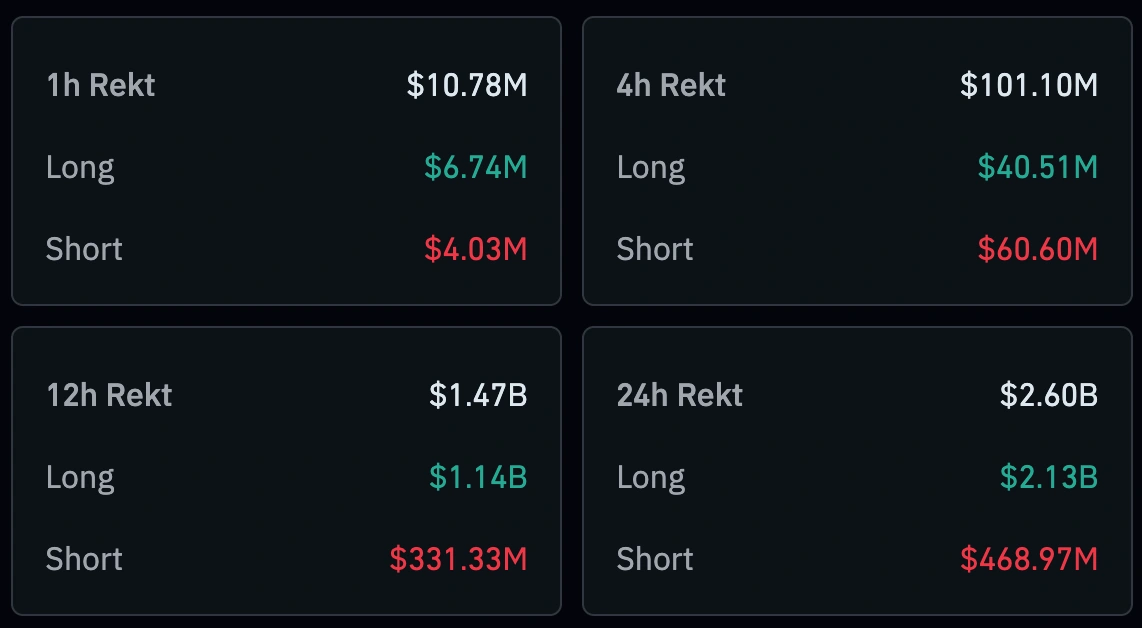
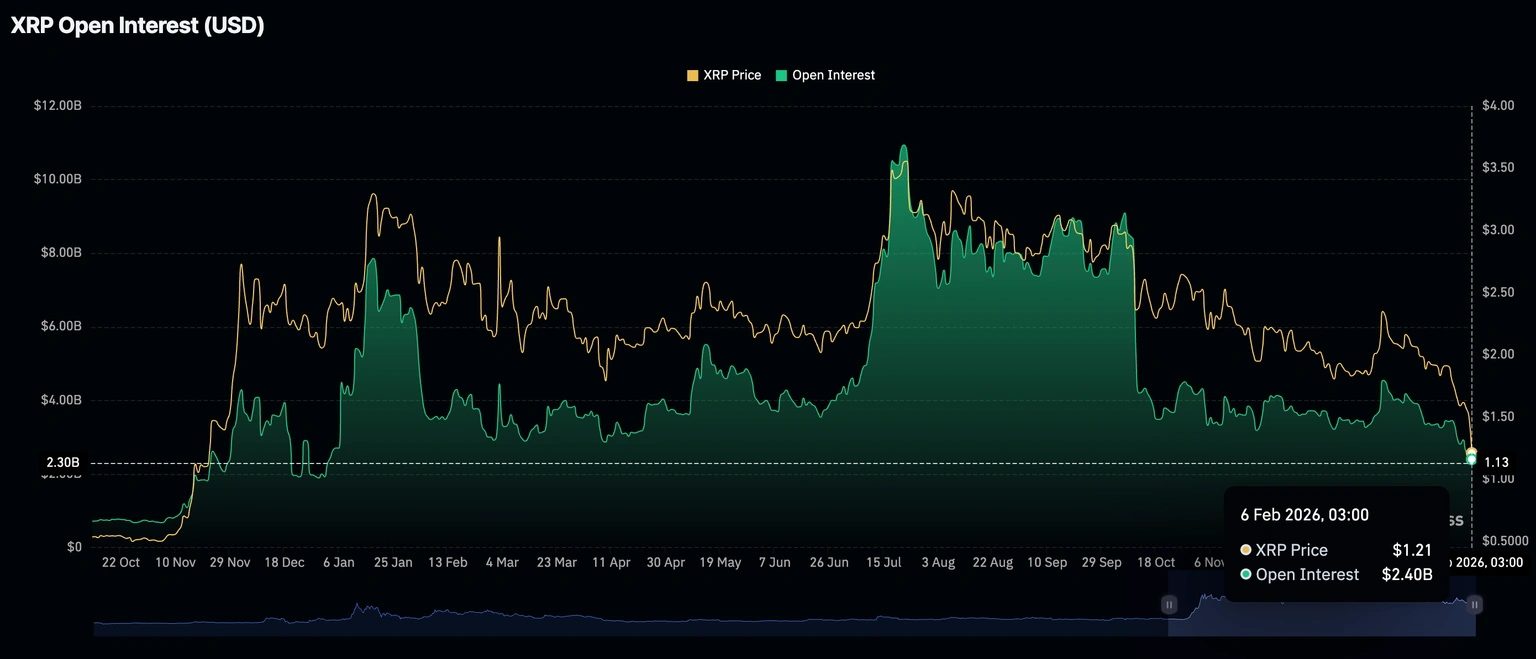
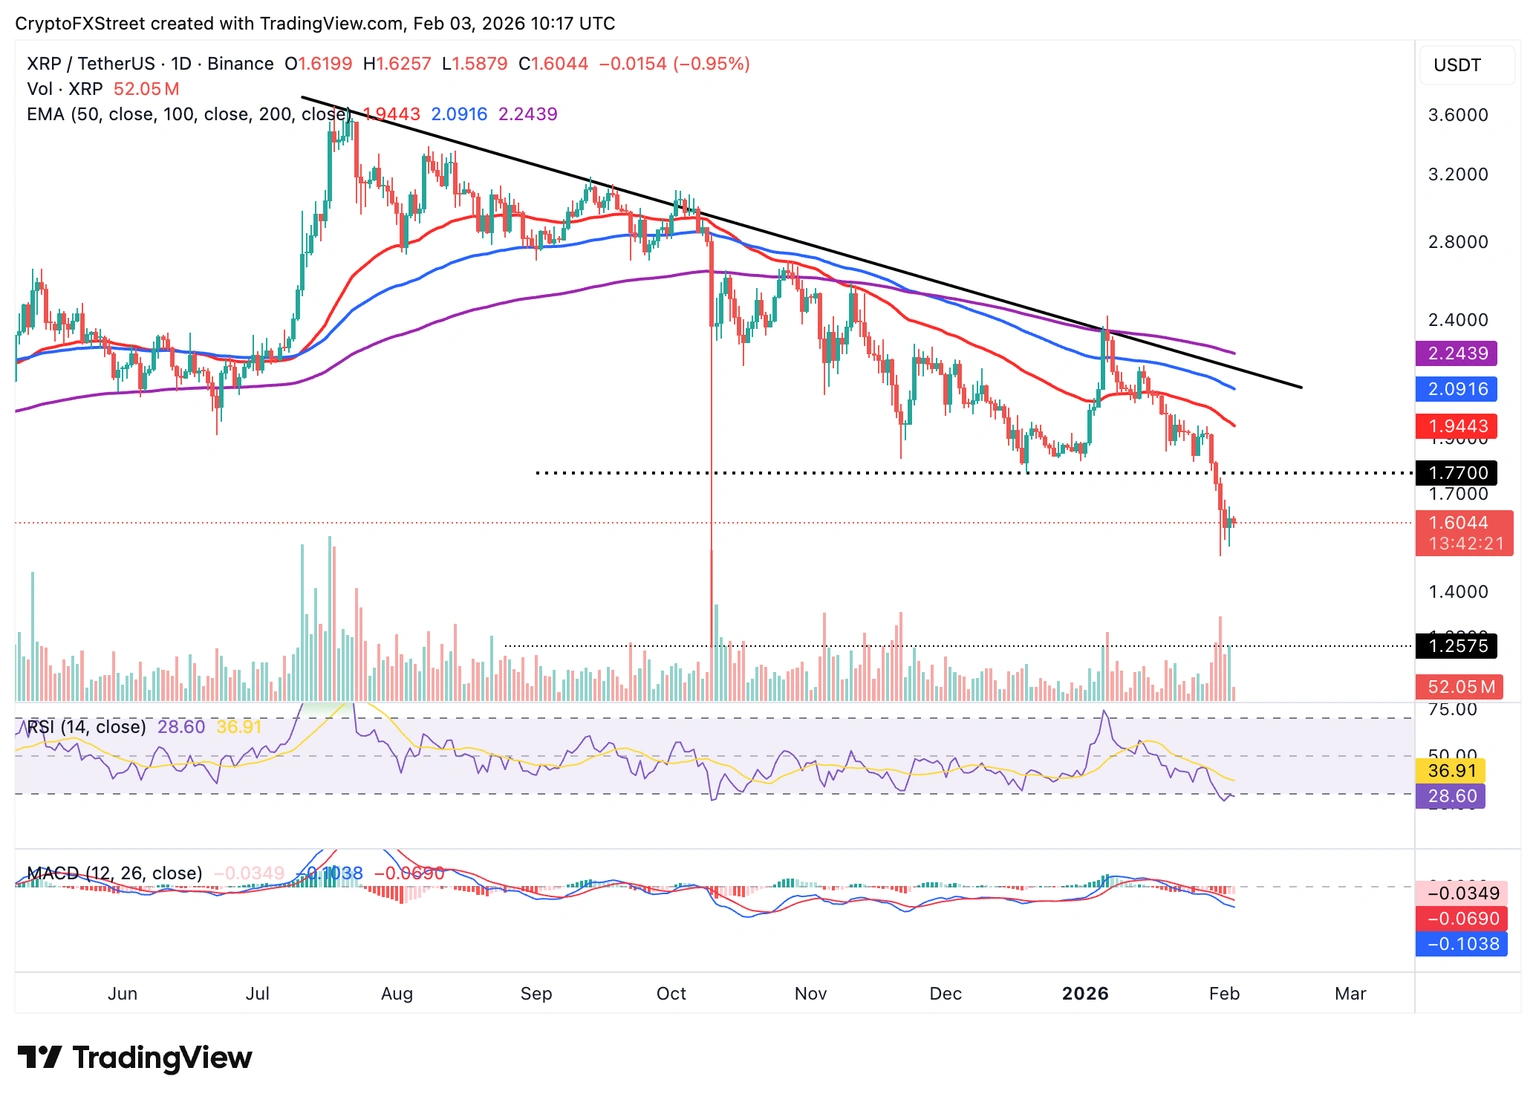
The retail market remains cautious, with traders preferring to close positions rather than open new ones. Data from CoinGlass shows that the funding rate, weighted by open interest for XRP, remains negative at -0.0008% on Tuesday, up from -0.0080% the previous day.
For XRP to maintain its upward trend, the funding rate must steadily rise into positive territory and continue increasing, indicating sustained interest from retail investors.
XRP Funding Rate Weighted by Open Interest | Source: CoinGlass
U.S.-listed spot Bitcoin ETFs saw approximately $562 million in inflows on Monday. This marks a return of institutional interest, ending a four-day streak of outflows that had led to a decline in Bitcoin's price performance.
Total current inflows amount to $55.57 billion, with assets under management (AUM) at $100.38 billion. Stable cash flows into ETF funds indicate positive market sentiment, which could support a Bitcoin rebound.
Bitcoin ETF Flows | Source: SoSoValue
Meanwhile, Ethereum spot ETFs continued a third consecutive day of investment withdrawals, with investors pulling nearly $3 million on Monday. Total inflows now stand at $11.97 billion, with an average net asset value of $13.69 billion. Continued outflows could dampen sentiment and slow the recovery pace.
Ethereum ETF Flows | Source: SoSoValue
Additionally, XRP ETF outflows were modest, totaling around $405,000 on Monday, after large inflows of approximately $17 million on Friday. The total value of XRP ETFs is $1.18 billion, with a net AUM of $1.11 billion, according to SoSoValue data.
XRP ETF Flows | Source: SoSoValue
The retail market remains cautious, with traders preferring to close positions rather than open new ones. Data from CoinGlass shows that the funding rate, weighted by open interest for XRP, remains negative at -0.0008% on Tuesday, up from -0.0080% the previous day.
For XRP to maintain its upward trend, the funding rate must steadily rise into positive territory and continue increasing, indicating sustained interest from retail investors.
XRP Funding Rate Weighted by Open Interest | Source: CoinGlass