Trade
Basic
Futures
Futures
Hundreds of contracts settled in USDT or BTC
TradFi
Gold
Trade global traditional assets with USDT in one place
Options
Hot
Trade European-style vanilla options
Unified Account
Maximize your capital efficiency
Demo Trading
Futures Kickoff
Get prepared for your futures trading
Futures Events
Participate in events to win generous rewards
Demo Trading
Use virtual funds to experience risk-free trading
Earn
Launch
CandyDrop
Collect candies to earn airdrops
Launchpool
Quick staking, earn potential new tokens
HODLer Airdrop
Hold GT and get massive airdrops for free
Launchpad
Be early to the next big token project
Alpha Points
Trade on-chain assets and enjoy airdrop rewards!
Futures Points
Earn futures points and claim airdrop rewards
Investment
Simple Earn
Earn interests with idle tokens
Auto-Invest
Auto-invest on a regular basis
Dual Investment
Buy low and sell high to take profits from price fluctuations
Soft Staking
Earn rewards with flexible staking
Crypto Loan
0 Fees
Pledge one crypto to borrow another
Lending Center
One-stop lending hub
VIP Wealth Hub
Customized wealth management empowers your assets growth
Private Wealth Management
Customized asset management to grow your digital assets
Quant Fund
Top asset management team helps you profit without hassle
Staking
Stake cryptos to earn in PoS products
Smart Leverage
New
No forced liquidation before maturity, worry-free leveraged gains
GUSD Minting
Use USDT/USDC to mint GUSD for treasury-level yields
More
JAVON⚡️MARKS
No content yet
JAVON⚡️MARKS
If there's a time for such a season for alts, it's soon and or extremely close to now...
#Altcoins
#Altcoins
- Reward
- 1
- Comment
- Repost
- Share
What’s worth it doesn’t always come about fast or easily but when it does, you’ll see exactly why the wait and such was necessary…
- Reward
- like
- Comment
- Repost
- Share
GREAT RISING 🤲!
- Reward
- like
- Comment
- Repost
- Share
- Reward
- 1
- 1
- Repost
- Share
WhyAreYouStillAwakeSo:
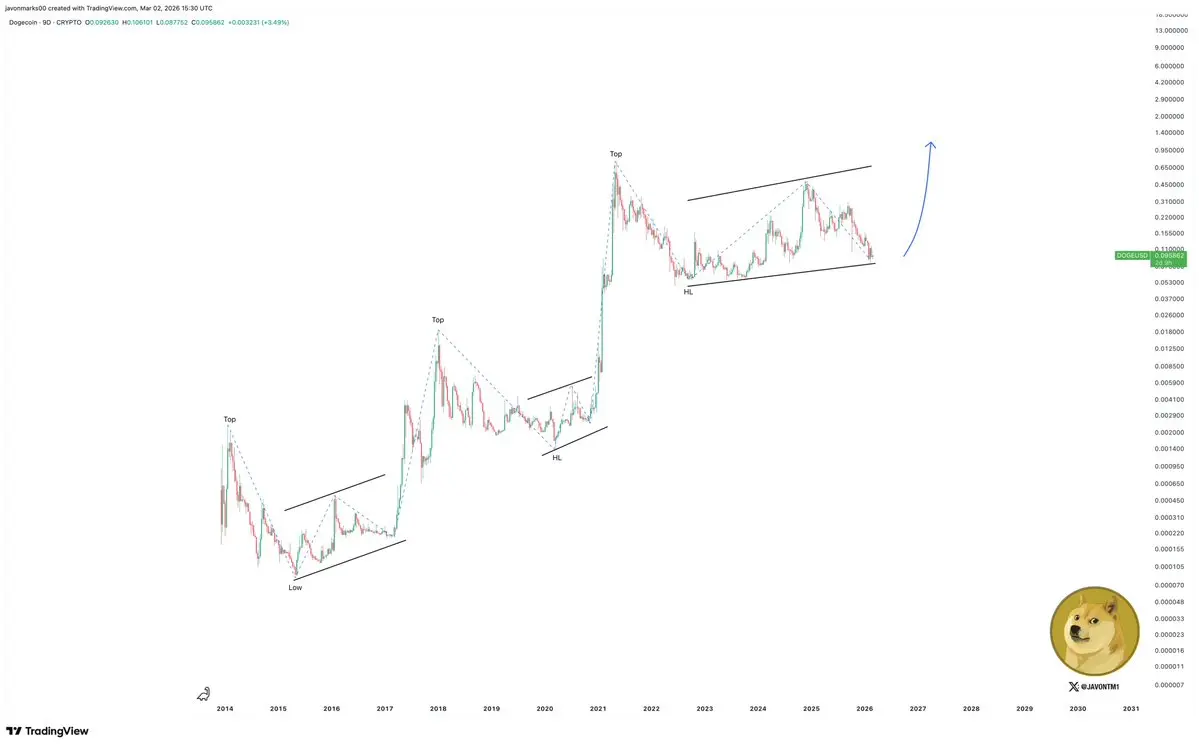
Where did you see it?Next Targets for $DOGE:
$0.6533 (>560% Increase)
$0.73905 (All Time Highs)
$1.25111
(Dogecoin)
$0.6533 (>560% Increase)
$0.73905 (All Time Highs)
$1.25111
(Dogecoin)
DOGE-2,76%
- Reward
- like
- Comment
- Repost
- Share
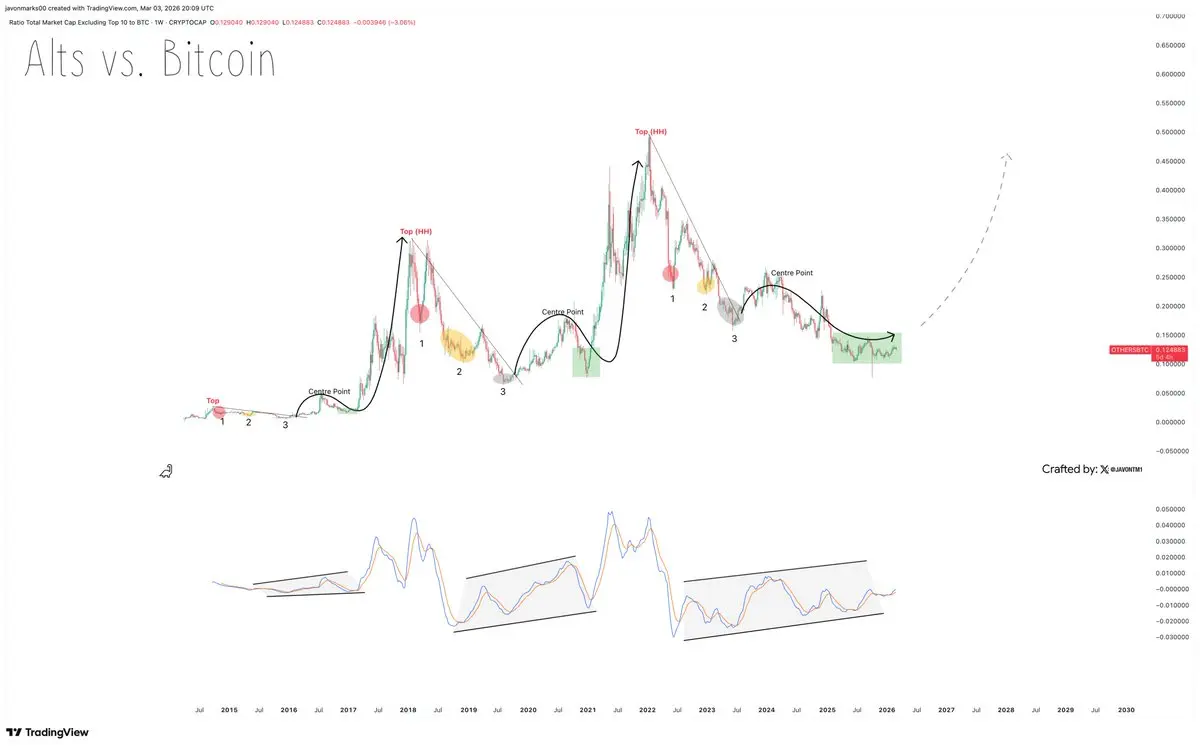
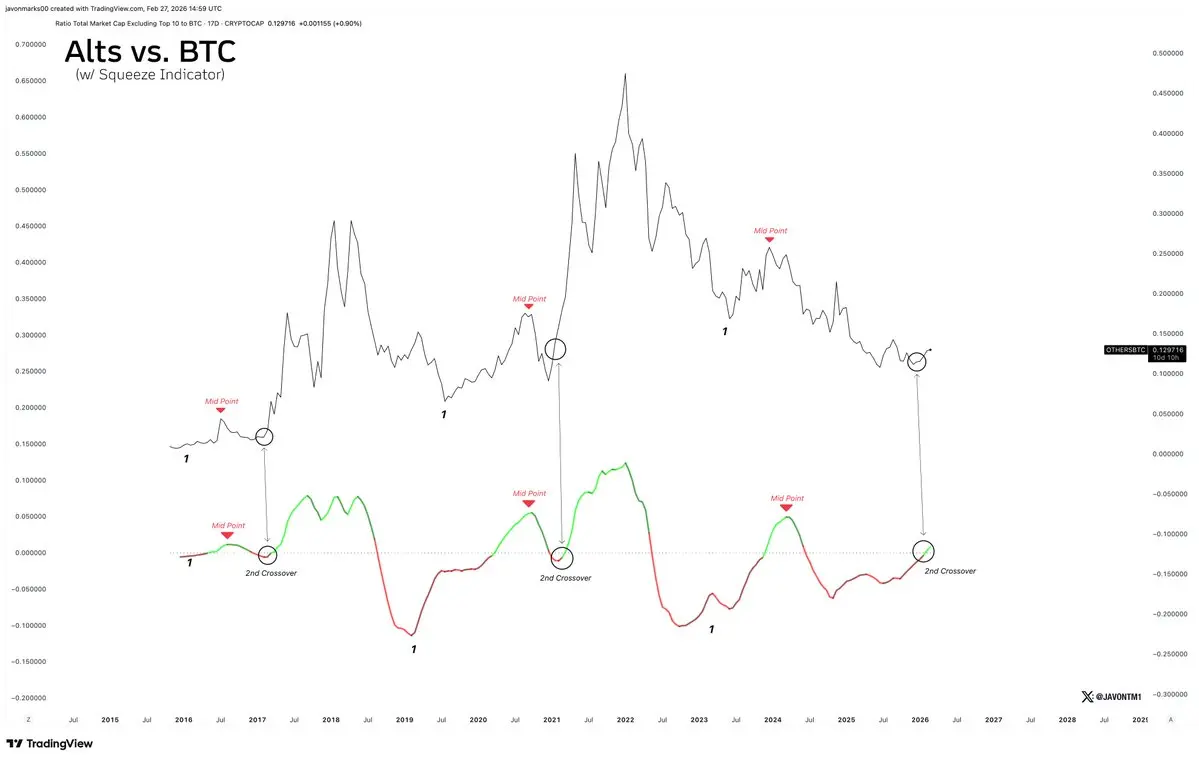
For alts, the cycle continues to look fully developed and ready for an expansion state.
The mid point is clear and another bull pattern has formed, which has happened before each of the previous two alt seasons.
With it happening again, next stage looks to be takeoff 🛫...
The mid point is clear and another bull pattern has formed, which has happened before each of the previous two alt seasons.
With it happening again, next stage looks to be takeoff 🛫...
- Reward
- like
- Comment
- Repost
- Share
With Bitcoin already being widely recognized as a digital commodity under CFTC and having a more mature blockchain status, the primary beneficiaries for the CLARITY Act is looking to be altcoins.
With this act being urged to pass imminently and alts (per OTHERSBTC and OTHERS.D) positioned for a significant expansion state, this act can be catalyst for the next alt-season and the timeline looks to be narrowing.
With this act being urged to pass imminently and alts (per OTHERSBTC and OTHERS.D) positioned for a significant expansion state, this act can be catalyst for the next alt-season and the timeline looks to be narrowing.
BTC0,41%
- Reward
- 3
- Comment
- Repost
- Share
Alts, per OTHERSBTC, are in perhaps their best positions in nearly 4 years.
If there is a time for another alt-season to commence, it is extremely close to now, if not quite literally in these moments now, seriously...
#Altcoins
If there is a time for another alt-season to commence, it is extremely close to now, if not quite literally in these moments now, seriously...
#Altcoins
- Reward
- 1
- Comment
- Repost
- Share
GREAT RISING 🍀!
- Reward
- like
- Comment
- Repost
- Share
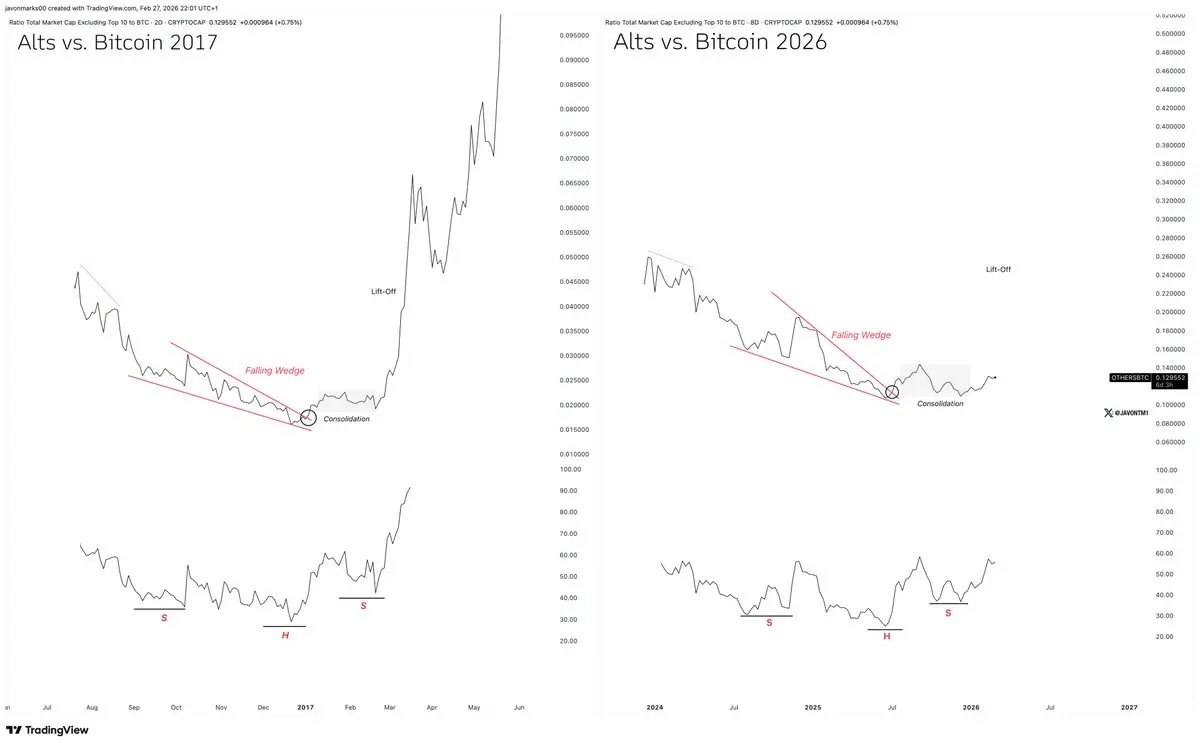
Not only are the prices of the OTHERSBTC pair lined up similar to 2017 before the alt season then but momentum (per RSI) is also right there in line with it.
The altcoin market looks to be positioned for "Lift-Off" 🚀!
#Altcoins
The altcoin market looks to be positioned for "Lift-Off" 🚀!
#Altcoins
- Reward
- like
- Comment
- Repost
- Share
Historically, alt seasons are unlikely to happen in a genuine Bitcoin bear market and right now, signs of early alt season stages are showing up, heavily.
And if altcoin season dynamics are emerging, this suggests $BTC to either be getting ready for a major expansion phase or transitioning into a strong consolidation, not a macro downtrend.
And if altcoin season dynamics are emerging, this suggests $BTC to either be getting ready for a major expansion phase or transitioning into a strong consolidation, not a macro downtrend.
BTC0,41%
- Reward
- like
- Comment
- Repost
- Share
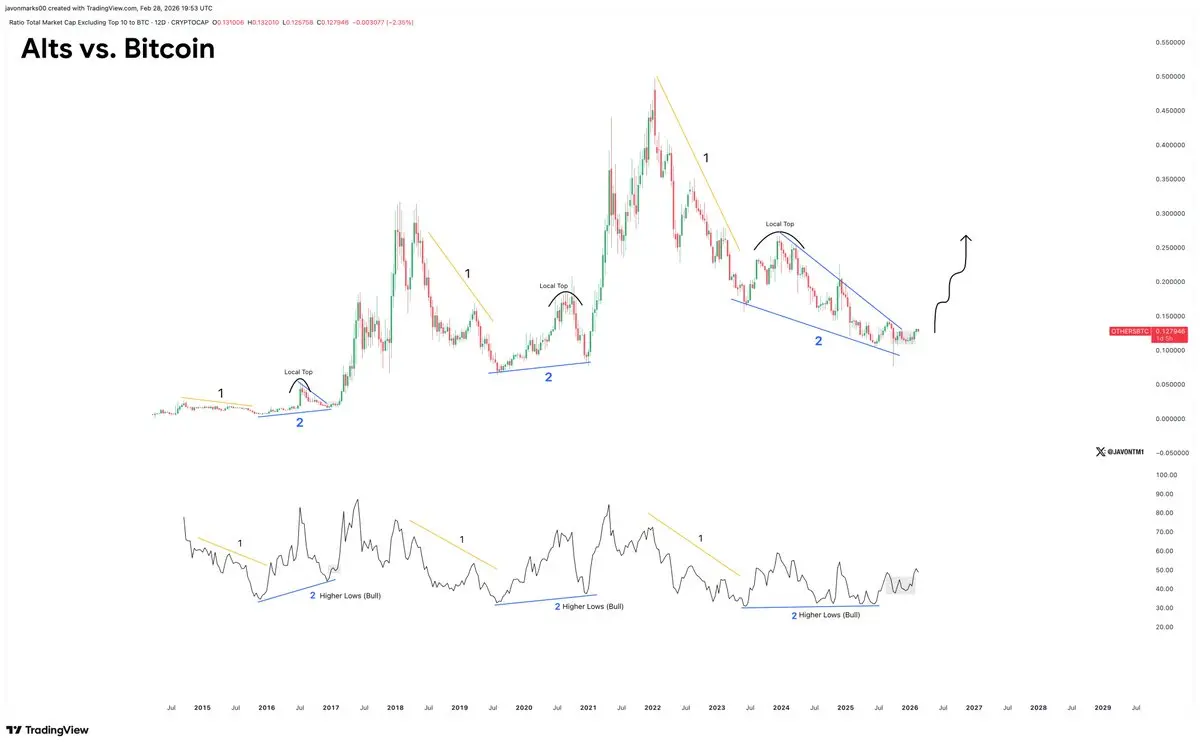
When the Squeeze Momentum Indicator crosses into green for the second time in the cycle, this is usually where alts start to heavily outrun Bitcoin, sparking what we know as Alt-Seasons.
This second cross has happened again this cycle meaning that next up can be yet another alt-season.
#Altcoins
This second cross has happened again this cycle meaning that next up can be yet another alt-season.
#Altcoins
BTC0,41%
- Reward
- like
- Comment
- Repost
- Share
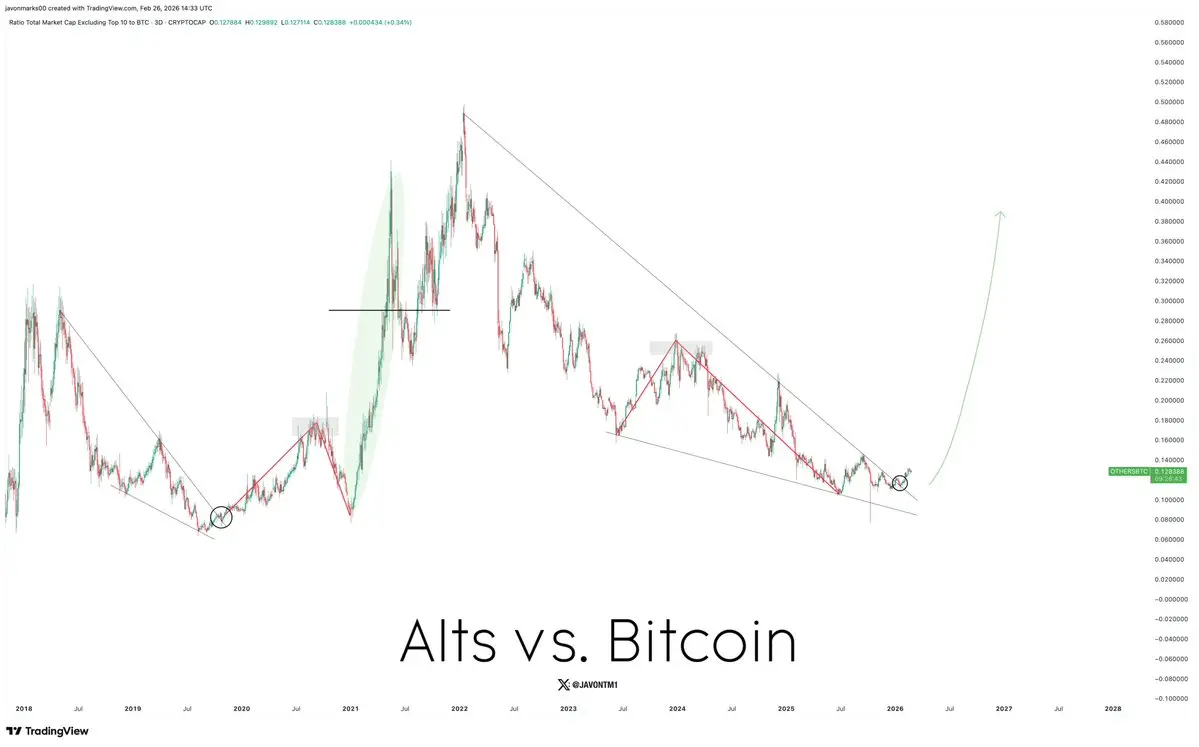
To repeat, alts against Bitcoin are broken out and they are showing early signs of positive response.
Looking to be in the last phases of the overall alt cycle, the next move can be a large and near vertical one!
#Altcoins look ready, now...
Looking to be in the last phases of the overall alt cycle, the next move can be a large and near vertical one!
#Altcoins look ready, now...
BTC0,41%
- Reward
- like
- Comment
- Repost
- Share
There's no giving up in the journey to mastery + advancement no matter how tough it gets, or how stagnant progress seems.
The only way to get to the next level is to keep going with a consistent and quality focus + action on mastery and advancement.
If you truly want it, you'll find a way to keep pushing.
The only way to get to the next level is to keep going with a consistent and quality focus + action on mastery and advancement.
If you truly want it, you'll find a way to keep pushing.
- Reward
- like
- Comment
- Repost
- Share