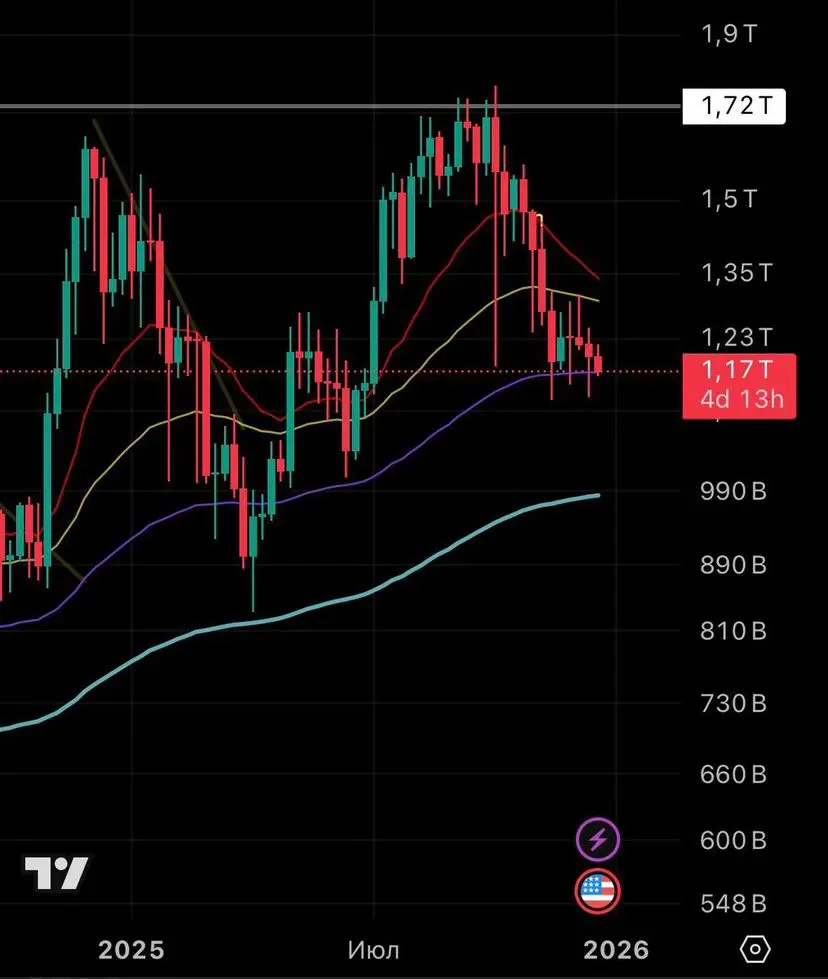
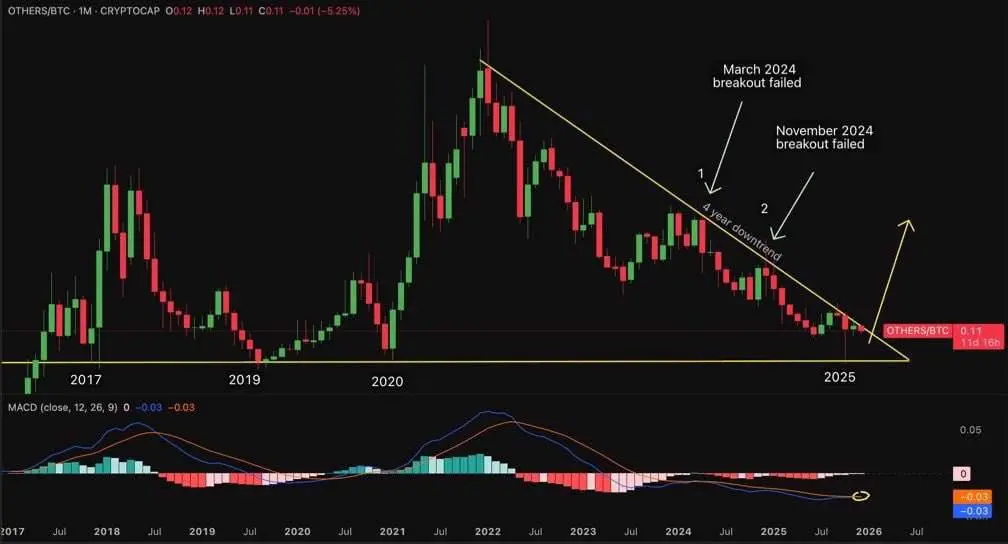
⚡️Will the alt market soon take off? The chart shows the ratio of altcoin market capitalization to Bitcoin. 🟠 Altcoins have been declining against Bitcoin for almost 4 years. The yellow line at the top represents the downtrend since 2022. 🟠 Attempts to break upward in March and November 2024 failed. Both are marked on the chart. The market was not ready at that time. 🟠 Currently, the indicator has hit the lower boundary of this trend. Pressure on altcoins is already at its maximum. 🟠 The MACD indicator (from the bottom) has been in the negative zone for 43 months. This also shows signs of
Almost all tokens launched in 2025 have gone to the bottom. As it turned out, 85% of tokens have fallen below their initial market caps and FDV. Average decline: ▸ −71% from initial FDV; ▸ −67% from initial market cap
Solana, Technical decline: SOL is trading below key moving averages at around ~$122. Negative MACD and RSI around 42 confirm a strong bearish momentum, testing important support. The weekly chart shows a double top indicating a bearish scenario in the medium term with a price of $90-85 per coin. #sol
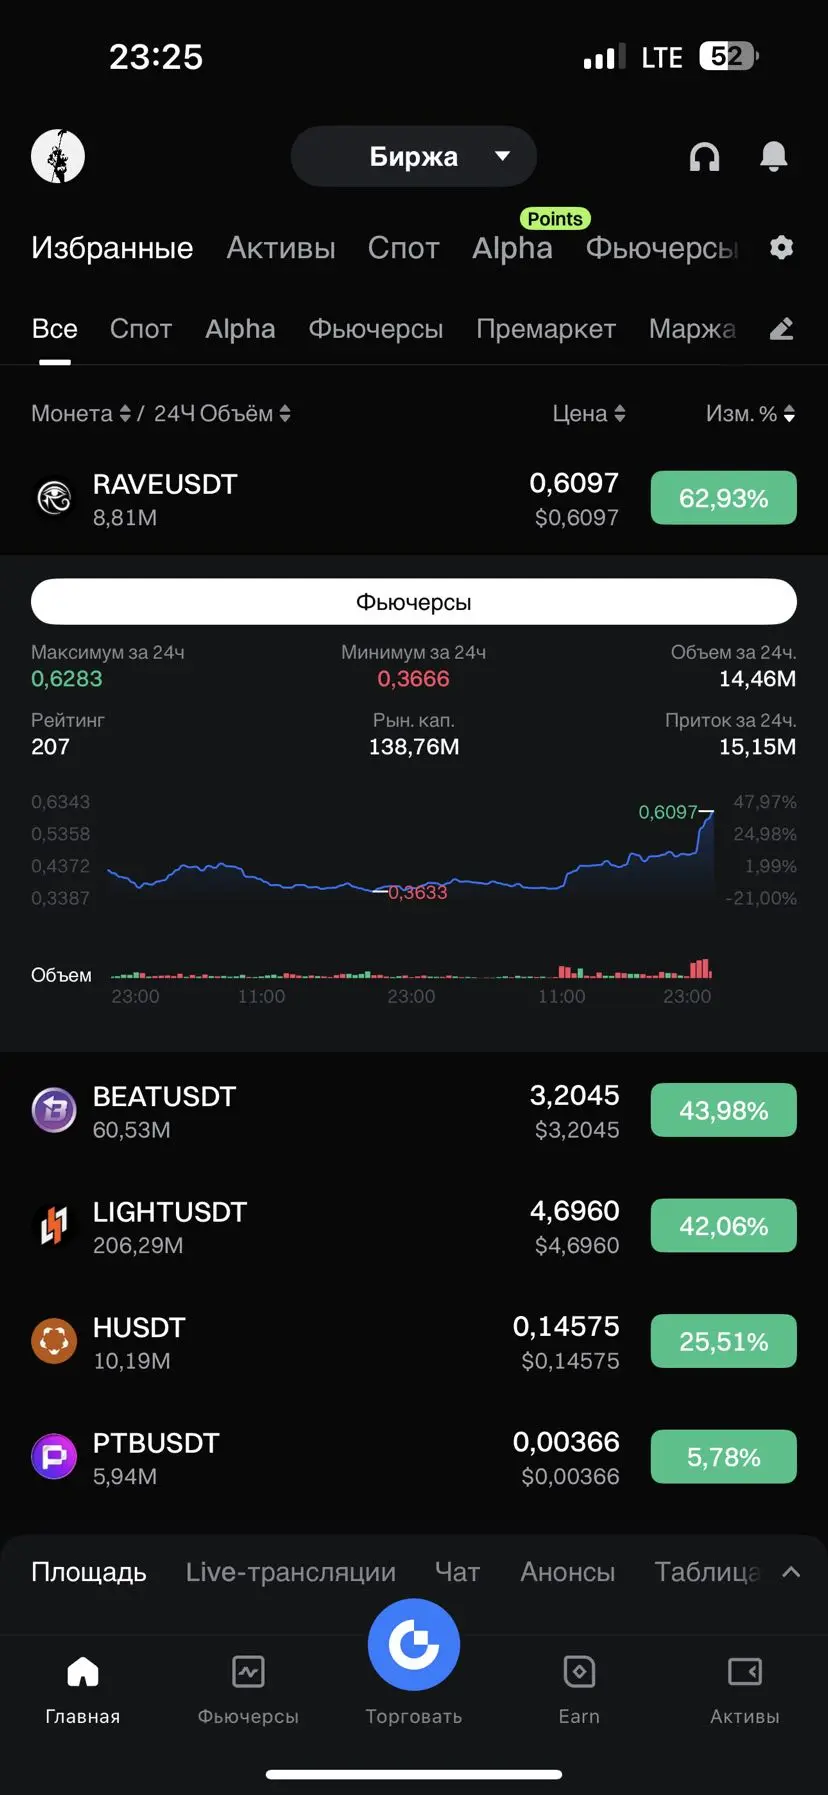
You can gradually build a short position here, and if it moves up, average down your position. The coin has updated its high and taken liquidity. #RAVE